XAUUSD — 4,460 Retest or 4,342 Sweep?Gold is still trading under clear bearish pressure after breaking down from the previous channel structure.
Price is now moving around 4,430 - 4,440 after a sharp selloff.
This is not a clean buy reversal yet.
The market may bounce first, but the bigger structure is still showing seller control.
The simple read
4,396 is the first liquidity support area.
If gold holds above this level, price may create a short-term recovery toward 4,460.
But 4,460 is the Sell Scalping Zone.
If gold reaches this area and rejects, sellers may try to push price back lower again.
Above that, 4,531 is the stronger Sell Zone / Continuation Selling Zone / Retest Trend area.
As long as gold stays below 4,460 - 4,531, the short-term bearish structure remains active.
If 4,396 breaks clearly, the next downside target is 4,342.
That area is the OB Buy Zone / End Liquidity zone, where I will watch for reaction.
Key price zones
Current price area: 4,430 - 4,440
Liquidity support: 4,396
Sell scalping zone: 4,460
Main retest sell zone: 4,531
OB Buy / end liquidity zone: 4,342
Short-term recovery improves above: 4,460
Bearish continuation remains active below: 4,531
Trading plan
Short-term bounce scenario
If gold holds above 4,396:
A recovery toward 4,460 can appear.
But I would not chase that bounce as a bullish reversal.
The reaction at 4,460 is the real test.
Sell reaction scenario
If gold reaches 4,460 and rejects:
This can become the first clean resistance reaction.
Price may rotate back toward 4,396.
If 4,396 breaks, 4,342 becomes the next important downside zone.
Deeper retest scenario
If gold pushes higher toward 4,531:
I will watch for strong rejection from the retest trend zone.
This is the stronger sell reaction area on the chart.
No rejection = no forced sell.  Short
Short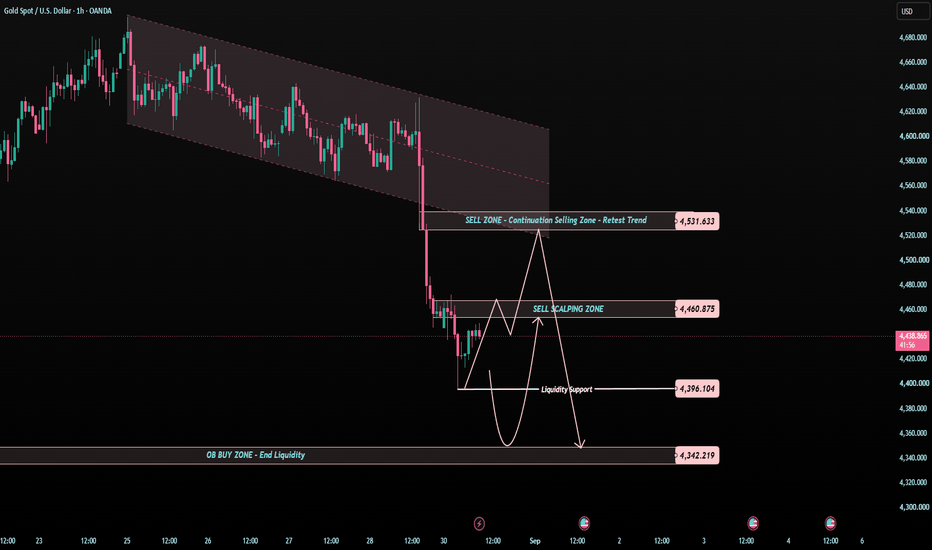
SITCo Monday Market Review | Stable Indexes, Weakening BreadthSITCo Monday Market Review | Stable Indexes, Weakening Breadth
Market Regime
The market remains in a Mixed / Risk-Off-tilted regime.
ES and NQ continue to hold their larger balance structures, but the market beneath them weakened. Equal weight, small caps, financials, several megacaps, and international indexes are deteriorating while leadership remains concentrated in selected semiconductors and TSLA.
Risk Posture: Yellow
Risk-On, Risk-Off, or Chop?
Current classification: Mixed / Risk-Off Tilt.
This was not an indiscriminate liquidation. Credit improved, Fed funding markets remained orderly, volatility stayed contained, and selected semiconductor CVD strengthened.
However, the broader market did not confirm the relative stability in ES and NQ:
• RTY broke below important volume structure
• RSP lost its rising trend
• Financials remained weak
• Traditional market internals finished negative
• Short-term S&P 500 breadth deteriorated
• European and Hong Kong futures weakened with declining CVD
The market is still functioning normally, but its participation remains fragile.
What Happened
MES stabilized near 7,697 after entering a lower-volume area.
On the four-hour chart, price continues to hold better than CVD. The 15-minute chart is slightly more constructive, with CVD improving as price stabilized above the 7,683.50 support area.
MES remains balanced between 7,683.50 and 7,724.25. Acceptance outside that range should matter more than a brief intraday breach.
MNQ remains inside its larger 29,220.75–29,541.75 balance. Four-hour CVD has not fully repaired, but the shorter-term CVD improved beneath sideways price.
RTY was the clearest warning. It lost 3,000.50 and failed to recover the 2,963.40–2,976.90 region. That is downside acceptance below its former balance—not simple underperformance.
Market Internals
The breadth picture remains divided by timeframe:
• 42.34% of S&P 500 stocks are above their 20-day average
• 52.88% are above their 50-day average
• 68.78% are above their 200-day average
Short-term participation is deteriorating considerably, but the longer-term market foundation has not yet broken.
RSP confirmed the short-term warning by breaking its rising trend, losing 219.88, and weakening through RSI and CVD.
NYSE internals were also soft:
• ADD finished near −853
• VOLD was negative
• Cumulative TICK finished near −214
The internals did not confirm broad accumulation.
Rates, Bonds and the Dollar
Treasury yields increased across the curve:
• 2Y: approximately 4.35%
• 5Y: approximately 4.52%
• 10Y: approximately 4.78%
• 30Y: approximately 5.27%
The long end rose more aggressively than the front end. That suggests term-premium, supply, inflation, or fiscal-duration pressure rather than a pure increase in near-term Fed expectations.
The dollar did not strongly confirm the yield move, remaining near 99.4.
That combination deserves monitoring, but this is not evidence of Treasury-market failure. HYG/LQD strengthened, funding plumbing remained unchanged, and volatility did not disorderly expand.
TLT also produced an interesting divergence: price weakened while CVD rose sharply. That may indicate absorption beneath the bond selloff, but price has not confirmed a reversal.
Treasury Stress: Elevated Rate Pressure, Not Dysfunction.
Credit and Funding
HYG/LQD was one of Monday’s strongest counter-signals.
Price, RSI, and CVD all improved, arguing against broad corporate-credit stress.
Financials were less reassuring. XLF held its HVN shelf but continued to show weak CVD. KRE declined but stabilized around 73.66–73.69 while its CVD improved late.
That may represent early absorption, but KRE still needs to reclaim 74.25 and eventually 75.08.
Fed plumbing was unchanged. There was no new SOFR, EFFR, repo, reserve, or liquidity warning.
Credit: Constructive, Not Stress
Funding: Tightening, Not Stress
Volatility
VIX1D weakened sharply, while VIX and VX retained modest background demand.
VX price and CVD declined together intraday, showing no hidden volatility accumulation.
Immediate event fear eased, but the broader volatility complex did not produce a full Risk-On confirmation.
Leadership
Semiconductors were mixed but showed some constructive internal improvement.
• NVDA stabilized around 220 but still needs to reclaim 220.83 and then 224.94–225.30
• SMH held 552.84–556.29 while CVD strengthened
• MU produced the cleanest price, RSI and CVD confirmation
• AMD remained trapped below 481.74
• SOX remained structurally weak despite stabilizing near support
The megacap picture was less constructive.
MSFT, META, AAPL and ORCL held price better than their weakening CVD. AMZN and GOOGL showed price and CVD deterioration together.
TSLA produced genuine relative strength, but isolated leadership does not repair weak market breadth.
Global Markets
International markets broadly supported the defensive interpretation.
HSI, FDAX, FESX and FTSE weakened with declining CVD. NK also weakened in price, but its strong CVD may indicate underlying absorption.
Crypto remained stable, with BTC near $78,300 and ETH near $2,450. That does not confirm panic, but it also does not provide meaningful speculative Risk-On leadership.
What Changed?
The most important change was the growing separation between stable headline indexes and weaker participation.
ES and NQ are holding, but RSP, RTY, financials, breadth and several international markets are deteriorating.
At the same time, credit remains firm, funding remains orderly, short-term volatility eased, and selected semiconductor CVD improved.
The market is not undergoing broad liquidation. It is becoming increasingly dependent on narrow leadership.
Tomorrow I’m Watching
For bullish repair:
• MES accepting above 7,724.25
• MES clearing 7,764.75
• MNQ reclaiming 29,542–29,647
• RTY reclaiming 2,976.90
• RSP reclaiming 219.88
• NVDA holding 217.37–219.86 and reclaiming 220.83
• SMH reclaiming 559.47
• HYG/LQD remaining firm
• ADD, VOLD and TICK improving with price
For downside confirmation:
• MES losing 7,683.50 and especially 7,670.50
• MNQ losing 29,220.75
• RTY remaining below 2,963.40 and breaking 2,945–2,940
• RSP losing 219 and moving toward 217.91
• NVDA losing 217.37
• HYG/LQD reversing Monday’s improvement
• VIX and VX rising with strengthening CVD
SITCo Conclusion
The headline indexes remain stable, but the market’s internal foundation weakened Monday.
RTY, RSP, financials, breadth, and international markets support a Risk-Off tilt. Credit, funding, volatility, and selected semiconductor CVD prevent a full bearish classification.
Market Regime: Mixed / Risk-Off Tilt
Participation: Weakening
Credit: Constructive, Not Stress
Funding: Tightening, Not Stress
Risk Level: Yellow
Confidence: 88%
Stable index prices should not be mistaken for healthy participation. What’s Next for Gold in the New Trading Week?📊 XAUUSD – H1 | Technical Update
Current Price: ~4,448
The current H1 structure is leaning bearish following a strong breakdown below the 4,520–4,525 zone. Price is currently experiencing a technical rebound but has not yet reclaimed the key resistance levels.
🔵 Resistance
* 4,520–4,525: Near-term resistance and former breakout zone → prioritize monitoring price action here.
* 4,560–4,575: Strong resistance; if price rallies into this zone and gets rejected, selling pressure could return.
* 4,572.478: Notable resistance level on the chart.
🟢 Support
* 4,365–4,375: Current major support zone.
* If this zone is broken with a clear H1 candle close below it, the bearish momentum could continue toward lower levels.
📉 Preferred Scenario
Sell the Rally: If price rallies toward 4,520–4,525 and shows a clear rejection signal → this could trigger another bearish move toward 4,480 → 4,450 → 4,368.
⸻
📋 TRADING PLAN
🔴 SELL GOLD
* Entry: 4,482–4,484
* Stop Loss: 4,494
* Take Profit: 200 / 500 / 1000 pips
🟢 BUY GOLD
* Entry: 4,367–4,369
* Stop Loss: 4,357
* Take Profit: 200 / 500 / 1000 pips Short 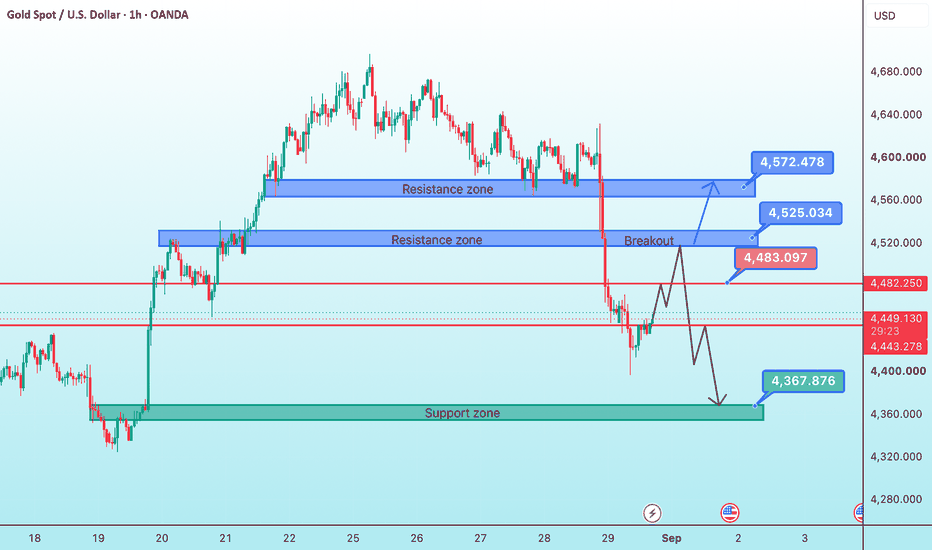
 Long
Long
GOLD - A sudden shift in the fundamental backdropICMARKETS:XAUUSD is reacting to the news, specifically the Fed Chair’s speech. The markets have reversed sharply, and the move could continue
Risk-off sentiment has increased significantly following Waller’s hawkish comments. Expectations for a Fed rate hike this year rose sharply on Friday. The strong sell-off was news-driven, and the fundamental backdrop has shifted. The dollar is strengthening, putting pressure on gold. A correction could develop at the start of the session before the decline resumes.
Gold could test the 4,435–4,450 liquidity zone. A long squeeze followed by profit-taking could trigger a bounce toward 4,500 before the decline resumes due to the shift in the fundamental backdrop
Resistance levels: 4500, 4540
Support levels: 4450, 4435, 4394
Technically, I expect a bounce and correction from the 4,435–4,450 support zone toward 4,500. However, from a medium-term perspective, due to the shift in the fundamental backdrop, gold could continue declining toward 4,400–4,300
Best regards,
R. Linda. Short 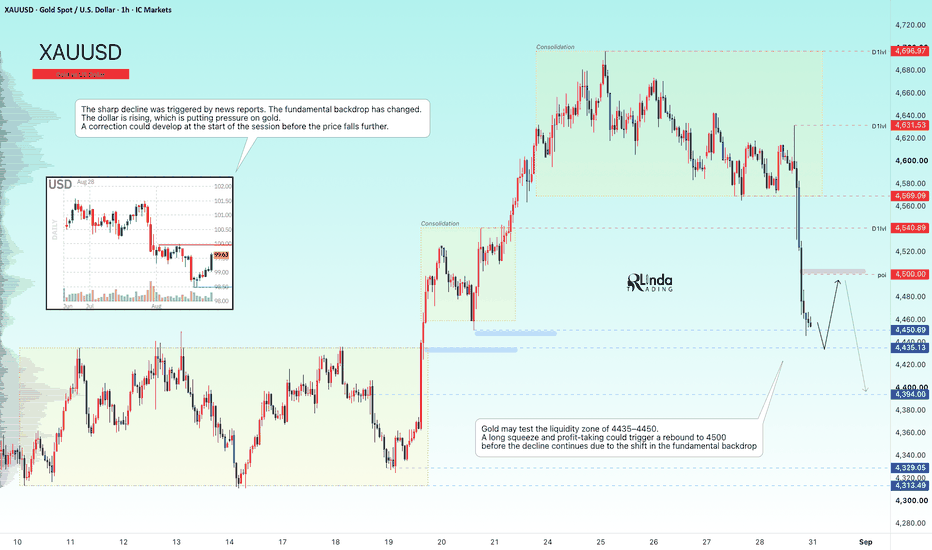
LINKUSDT - Hunting for liquidity before growthBINANCE:LINKUSDT.P is consolidating within the 11.00–12.00 range following a strong rally. However, corrections are typical within a consolidation phase, and the market could enter a liquidity-hunting phase before moving higher
Bitcoin has entered a consolidation phase after its strong rally. A correction could develop within this consolidation. Overall, the market still has bullish potential, and if the fundamental backdrop remains unchanged, the uptrend could resume soon.
The altcoin is consolidating after a strong rally. The key range is 11.00–12.00. A counter-trend correction is developing, and LINK could test the liquidity area before moving higher
Resistance levels: 12.00, 12.6
Support levels: 11.0, 10.90
Technically, a long squeeze of the 11.04–10.90 liquidity zone followed by consolidation above this area could shift the balance of power in favor of buyers and trigger a move toward the 11.60 area and the 12.02 liquidity zone
Best regards,
R. Linda.  Long
Long
XAUUSD — Wave 4 Rebound Before Wave 5
Gold is showing a clear bearish Elliott Wave structure after the strong rejection from the upper area near 4,620–4,640. From Kelly’s view, the current chart suggests that XAUUSD may have already completed wave (3) into the 4,400–4,425 zone, and the market could now build a corrective wave (4) before continuing lower into wave (5).
The key idea is simple: gold may rebound first, but as long as the recovery stays below the sell FVG zone, the larger short-term structure still favors another bearish leg.
⟡ Market Structure
Price is currently trading around 4,421, right inside the Resistance Fibonacci wave 4 area. This zone is important because it may decide whether gold continues lower immediately or makes a temporary recovery first.
The recent selloff was strong and impulsive, which supports the idea that sellers are still controlling the market. However, after such a sharp drop, a short correction toward the upper FVG area is possible before the next bearish continuation.
The main sell reaction zone on the chart sits around 4,500–4,530, marked as the FVG Sell wave 5 area. If gold rebounds into this zone and fails to break higher, sellers may step in again for the next downside move.
➤ Key Levels
◌ Current price area: 4,421
◌ Resistance Fibonacci wave 4: 4,400–4,425
◌ FVG Sell wave 5 zone: 4,500–4,530
◌ Key sell reaction level: 4,507
◌ Main downside target: 4,280–4,300
◌ End wave 5 level: around 4,286
◌ Bullish invalidation: above 4,540
⌁ Elliott Wave View
The chart is showing a bearish 5-wave sequence.
Wave (1) formed after the first rejection from the top.
Wave (2) created a corrective rebound near 4,620–4,640.
Wave (3) pushed strongly lower into the 4,400–4,425 Fibonacci zone.
Wave (4) may now create a corrective rebound toward 4,500–4,530.
If that zone rejects price, wave (5) may continue lower toward 4,280–4,300.
This is why Kelly is not chasing sells at the current low. The cleaner setup is to wait for either a weak rebound into the sell FVG zone or a clear breakdown below the current support structure.
▸ Trading Scenario
Preferred bearish scenario
Entry: Sell around 4,500–4,530 if price gives bearish rejection from the FVG Sell wave 5 zone
Stop Loss: Above 4,540
Take Profit 1: 4,400–4,425
Take Profit 2: 4,340–4,320
Take Profit 3: 4,280–4,300
Alternative entry
If gold fails to recover and breaks below 4,400 with strong bearish momentum, sellers may look for continuation toward 4,286 without waiting for a deeper pullback.
◌ Invalidation
The bearish view becomes weaker if gold breaks above 4,540 and holds above the FVG sell zone. In that case, the wave (4) correction may extend higher and the wave (5) downside scenario would need to be delayed.
⌁ Kelly’s View
Kelly’s main view remains bearish, but not to sell blindly at the current price. Gold is sitting near an important Fibonacci reaction zone, so a short rebound can happen first.
If price pulls back into 4,500–4,530 and rejects, the bearish wave 5 setup becomes cleaner, with the main target near 4,280–4,300.
Do you think gold will retest the FVG sell zone first, or continue directly toward wave (5)? Short 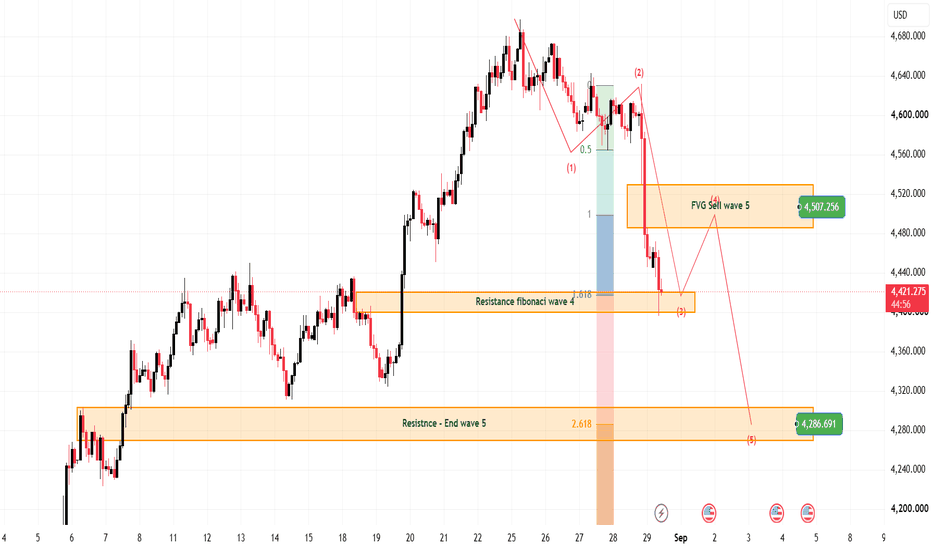
Will gold regain its position in the new week?Based on this XAU/USD H4 chart, the structure has changed noticeably compared with the previous charts: price has broken below the short-term bullish trendline and is currently trading below the 4,530 area. Therefore, in the short term, we need to be cautious with the BUY side.
🔴 Resistance
1. 4,530 – 4,585 — Main Resistance Zone
This is the Resistance Zone marked on the chart.
The 4,583.819 level is the upper boundary worth paying attention to.
Price has now fallen below this zone, so if it retraces back to 4,530–4,585, this area could act as resistance/retest.
If H4 fails to close back above 4,585, selling pressure is likely to remain.
2. 4,455 – 4,435
This is the price area currently being tested after the strong decline.
4,434.896 is a very important level.
If price rebounds but is rejected around 4,435–4,455 → another downward move could follow.
🟢 Support
1. 4,320 – 4,335 — Strong Support
This is the clearest Support Zone on the chart.
The key level is around 4,330.281.
This area also previously acted as an accumulation zone before the strong upward move.
If price declines to this area and shows a bullish reaction, it will be an important zone to look for BUY opportunities.
2. 4,400 – 4,435 — Intermediate Support
If 4,435 holds, price could consolidate and rebound toward 4,530.
However, if H4 closes below 4,435, the structure will become weaker and the probability of continuing toward 4,330 will increase.
📉 Main Scenario Currently
The chart is currently leaning toward a downward correction:
4,455 → 4,435 → 4,330
In particular, the arrow on the chart is also illustrating the possibility of a rebound/retest toward the 4,530 area, followed by another decline toward 4,330.
Therefore, I will not prioritize chasing BUY positions around 4,450–4,460.
BUY Scenario
If price reaches 4,320–4,335 and shows a clear reversal signal:
4,320–4,335 → BUY → 4,435 → 4,530
This would offer a better Risk/Reward opportunity.
SELL Scenario
If price rebounds to 4,530–4,585 but fails to break out and shows a clear rejection:
4,530–4,585 → SELL → 4,435 → 4,330 Short 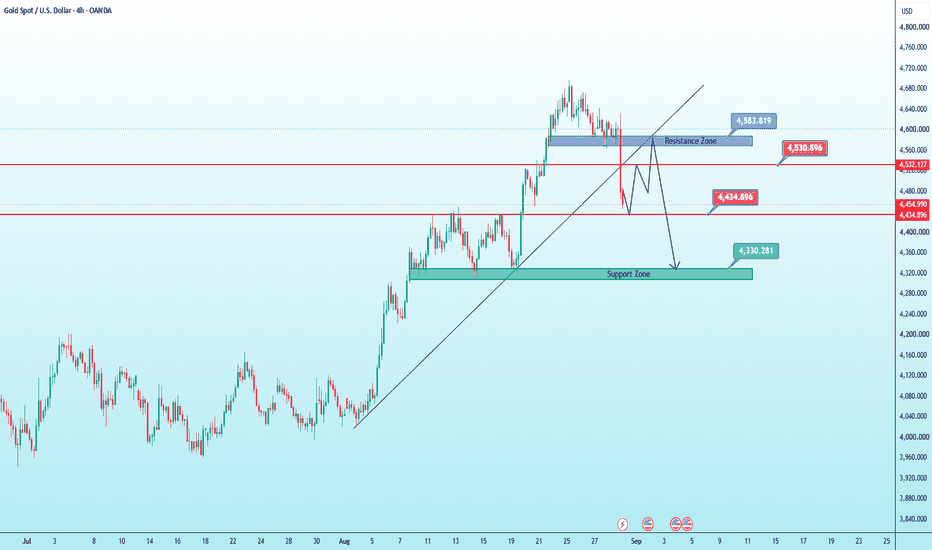
 Short
Short
Will Gold Experience a Sharp Drop Today?📊 XAUUSD – H1 | Technical Update
Current Price: ~4,581
* 🔵 Major Resistance: 4,620–4,630 — Strong supply zone, also aligned with the descending trendline. This is the key area that will determine the short-term direction.
* 🟠 Intermediate Resistance: 4,600–4,610 — An area where a technical rebound may occur before price retests 4,620.
* 🟢 Major Support: 4,520–4,540 — Important demand zone, corresponding to the previous support area.
* 📉 Trendline: The short-term bearish structure remains intact as price continues to form Lower Highs and trade below the descending trendline.
🔎 Preferred Scenarios
1️⃣ Bearish – Preferred while 4,620 remains unbroken
Price may continue trading below the trendline, rebound toward 4,600–4,620, then face rejection → targets toward 4,560 → 4,540 → 4,520.
2️⃣ Bullish – Only confirmed after a breakout
If an H1 candle closes clearly above 4,620–4,630 and the retest successfully holds this zone, the bearish structure would weaken → next targets at 4,660 → 4,680.
⸻
📋 TRADING PLAN
🟢 BUY GOLD
* Entry: 4,530–4,532
* Stop Loss: 4,520
* Take Profit: 200 / 500 / 1000 pips
🔴 SELL GOLD
* Entry: 4,620–4,622
* Stop Loss: 4,632
* Take Profit: 200 / 500 / 1000 pips Short 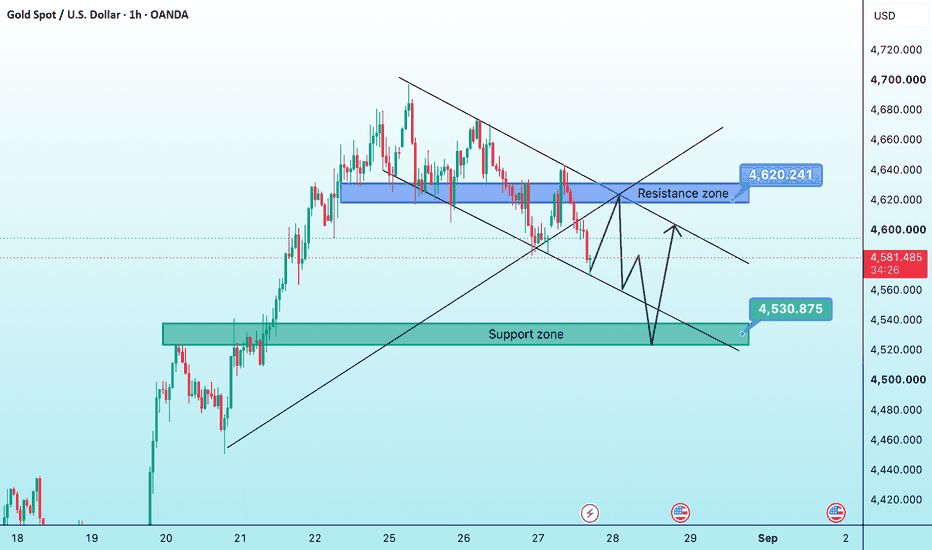
XAUUSD — Bullish Wave 5 Setup From Buy FVG
Gold is starting to build a bullish recovery structure after defending the lower area near 4,570–4,580. From Kelly’s view, the current chart suggests that XAUUSD may be forming a new Elliott Wave upside sequence, with the latest pullback acting as wave (2) before price attempts to continue higher into wave (3), wave (4), and finally wave (5).
The key idea is simple: if gold continues to hold above the Buy FVG zone, the bullish structure remains valid and the next upside target may open toward 4,655 first, then 4,705–4,712.
⟡ Market Structure
Gold previously moved inside a descending correction channel, but the latest reaction from the lower zone shows that sellers are starting to lose pressure. Price is now trading around 4,603, right above the Buy FVG zone near 4,590–4,598.
If buyers continue to defend this area, gold may complete wave (2) and start pushing into wave (3). The first breakout area to watch is the Buy zone wave 5 / reaction zone around 4,622–4,628. A clean break above this zone would confirm stronger bullish momentum.
Above that, the next important target is the Fibonacci + FVG zone around 4,654–4,660, which also matches the projected wave (3) area. If price later pulls back and holds above structure, the final upside target remains the Target wave 5 zone near 4,705–4,712.
➤ Key Levels
◌ Current price area: 4,603
◌ Buy FVG support: 4,590–4,598
◌ Wave (2) invalidation area: below 4,570
◌ Buy zone wave 5 / breakout zone: 4,622–4,628
◌ Fibonacci + FVG target: 4,654–4,660
◌ Main wave 5 target: 4,705–4,712
⌁ Elliott Wave View
The chart is showing a possible bullish 5-wave recovery structure.
Wave (1) may have formed from the lower reaction zone toward 4,615–4,620.
Wave (2) appears to have corrected back into the lower FVG area near 4,570–4,580.
If this low holds, wave (3) can develop toward 4,654–4,660.
After that, wave (4) may create a small pullback toward 4,622–4,628.
The final wave (5) target remains near 4,705–4,712.
This is why Kelly is not focusing on chasing sells at the current level. The cleaner plan is to wait for confirmation that buyers are defending the FVG and that price can break back above the short-term correction structure.
▸ Trading Scenario
Preferred bullish scenario
Entry: Buy around 4,590–4,598 if price gives bullish confirmation from the Buy FVG zone
Stop Loss: Below 4,570
Take Profit 1: 4,622–4,628
Take Profit 2: 4,654–4,660
Take Profit 3: 4,705–4,712
Alternative entry: If gold breaks above 4,622–4,628 and retests this zone as support, buyers may look for continuation toward the Fibonacci + FVG zone.
◌ Invalidation
The bullish view becomes weaker if gold breaks below 4,570 and fails to reclaim the Buy FVG zone. In that case, the wave (2) structure may fail and price could continue the correction lower before any new bullish setup appears.
⌁ Kelly’s View
Kelly’s main view is bullish as long as gold holds above the lower FVG support. The market is still inside a recovery attempt, and the Elliott Wave structure suggests that a new upside sequence may be forming.
If buyers defend 4,590–4,598 and price breaks above 4,622–4,628, gold may continue toward 4,654–4,660, then potentially complete wave (5) near 4,705–4,712.
Do you think gold will confirm wave (3) from here, or will price retest the Buy FVG one more time first? Long 
BITCOIN - Correction ahead of the rally to 83K...BINANCE:BTCUSDT.P , after a strong rally, has entered a consolidation phase. The market has not yet reached the technical pullback zone around 83K and could form a correction to build up liquidity before the next impulse.
Bitcoin has broken its global bearish trend but is still under selling pressure. We can start talking about a bullish market if Bitcoin closes above 83K and continues its upward momentum.
For now, the key focus remains on the broader 83K–60K range. The market is preparing to test resistance but has first entered a liquidity-hunting phase.
A false breakout of the 81,270 resistance level is triggering a correction, during which the market could test the 79,500–78,500 area
Resistance levels: 81,270, 82,460, 83,000
Support levels: 79,550, 78,650
The correction could extend toward the local trendline and the liquidity area below 78,800.
A long squeeze around the key trigger could then trigger a bullish impulse toward the technical pullback zone around 82,500
Best regards,
R. Linda. Long 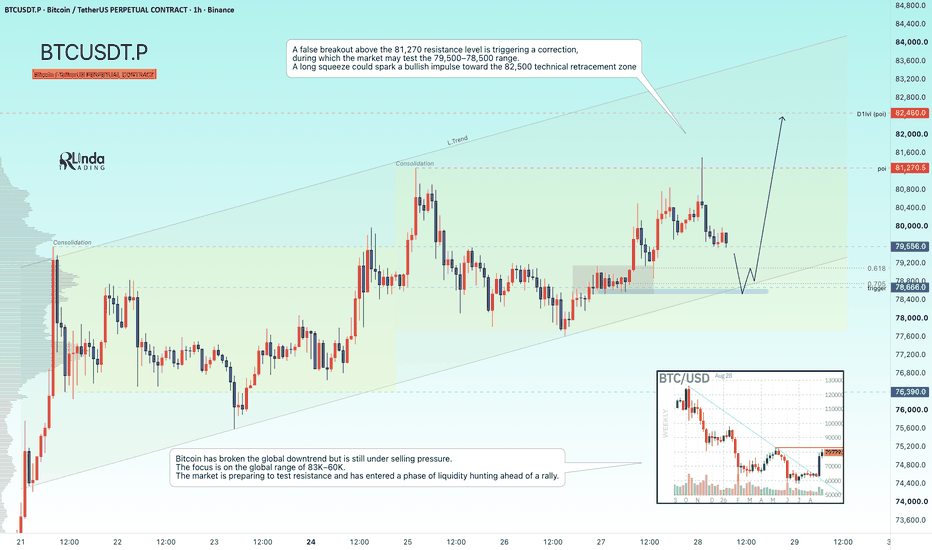
GOLD - The Hunt for Liquidity Ahead of a Rally ICMARKETS:XAUUSD continues its corrective phase due to the locally strengthening Dollar Index. On the D1 timeframe, price is consolidating above the intermediate range, and the market may give us an opportunity
The dollar is forming a counter-trend correction, which is also putting pressure on gold.
Gold maintains its bullish momentum amid a weaker dollar and positive medium-term market sentiment. The key events are the employment data and Waller’s speech. Technically, the target is a breakout above 4,697. Sustained upside is possible if the Fed maintains a dovish tone.
Drivers:
Upside: weaker dollar, lower rate expectations, falling oil prices, continued geopolitical tensions.
Downside: hawkish rhetoric from Waller, a stronger dollar, rising yields
Resistance levels: 4640, 4680, 4700
Support levels: 4600, 4595, 4583
Gold is trapped within the 4,585–4,640 range and, at the same time, inside a symmetrical triangle. The local trend remains bullish.
If the bulls manage to hold above 4,600, gold could move higher. Otherwise, a breakdown of the triangle structure could send gold toward 4,540. From that level, we could also expect a recovery phase toward 4,700
Best regards,
R. Linda. Long 
Long 
XAUUSD — Bearish Structure Below 4,600
Gold is starting to lose upside momentum after rejecting from the upper side of the rising channel. From this chart, the latest rebound still looks corrective, which keeps the short-term bias tilted to the downside and supports the idea of one more bearish leg.
⟡ Market structure
Price previously advanced inside an ascending channel, but after peaking near the upper boundary, momentum faded and the market began to print a weaker lower-high sequence. The Elliott Wave structure on the chart suggests wave (3) has already pushed down, wave (4) is forming as a recovery bounce, and wave (5) may still develop lower if sellers stay in control.
The first important reaction area is around 4,579–4,585, which is acting as a key decision zone. Below that, the next liquidity level sits near 4,564.602. If this level breaks cleanly, gold could continue toward the 4,520–4,525 area, where the chart marks the projected Elliott wave 5 completion and Fibonacci 1.618 target.
➤ Key levels
◌ Current price area: 4,598
◌ Reaction / decision zone: 4,579–4,585
◌ Liquidity support: 4,564.602
◌ Main bearish target: 4,520–4,525
◌ Extension target if selling accelerates: around 4,433
◌ Invalidation resistance: 4,630–4,640
⌁ Trading scenario
Entry: Sell on bearish rejection around 4,598–4,605, or after price drops back below 4,585 and retests it weakly.
Stop Loss: Above 4,640
Take Profit 1: 4,564.602
Take Profit 2: 4,520–4,525
Take Profit 3: around 4,433 if wave 5 extends further
This setup stays valid while gold remains capped below the recent lower-high area and fails to reclaim bullish momentum.
◌ Invalidation
If buyers push price back above 4,630–4,640 and hold there, the bearish wave count becomes weaker. In that case, the current downside scenario may be delayed or invalidated.
▸ Final view
Kelly’s main view remains bearish for now. The chart still supports a corrective bounce first, followed by another move lower toward liquidity and the projected wave 5 completion zone. As long as gold stays below the recent swing-high resistance, rallies are still more likely to be sold than chased higher.
Do you think gold will complete wave (5) first, or can buyers defend the structure and force a stronger recovery? Short 
XAUUSD — 4,643 Trap or 4,553 Sweep? Gold is now trading inside XAUUSD — 4,643 Trap or 4,553 Sweep?
Gold is now trading inside a very sensitive compression area.
After the strong bullish run, price is no longer expanding cleanly. The market is now moving between the short-term uptrend support and the descending resistance line.
This is where the next move can become sharp.
The simple read
Gold is currently trading around 4,620 - 4,630.
The first resistance to watch is 4,643.
This area is marked as the Sell Zone / Liquidity Zone and also sits near the short-term downtrend pressure.
If gold pushes into 4,643 and rejects, sellers may try to push price lower toward 4,598 and 4,553.
The 4,553 area is the main downside target zone on the chart.
But if gold breaks and holds above 4,643, the bearish pressure becomes weaker and price may retest 4,670.
Key price zones
Current price area: 4,620 - 4,630
Sell liquidity zone: 4,643
Short-term resistance: 4,670
First downside reaction: 4,598
Main downside target: 4,553
Bullish pressure improves above: 4,643
Bearish pressure increases below: 4,620
Trading plan
Sell reaction scenario
If gold reaches 4,643 and rejects:
This can become the cleanest short-term resistance reaction.
Price may rotate lower toward 4,598 first.
If sellers keep control, 4,553 becomes the next major target zone.
Breakdown scenario
If gold breaks below the uptrend support:
The correction structure becomes stronger.
I will watch for continuation pressure toward 4,598 and 4,553.
Recovery scenario
If gold breaks and holds above 4,643:
The sell setup becomes weaker.
Gold may try to recover toward 4,670 before choosing the next direction.
Tiara’s View
Gold is not in a clean chase zone now.
The market is compressed between support and resistance.
4,643 is the trap zone above.
4,620 is the pressure line below.
4,553 is the main downside target if sellers win this structure.
The clean plan is simple:
Do not chase the middle.
Wait for 4,643 reaction.
Or wait for support breakdown confirmation.
Reaction first.
Confirmation second.
Trade last.
No confirmation = no trade.
Do you think gold will reject from 4,643, or break higher before the next move
Gold is now trading inside a very sensitive compression area.
After the strong bullish run, price is no longer expanding cleanly. The market is now moving between the short-term uptrend support and the descending resistance line.
This is where the next move can become sharp.
The simple read
Gold is currently trading around 4,620 - 4,630.
The first resistance to watch is 4,643.
This area is marked as the Sell Zone / Liquidity Zone and also sits near the short-term downtrend pressure.
If gold pushes into 4,643 and rejects, sellers may try to push price lower toward 4,598 and 4,553.
The 4,553 area is the main downside target zone on the chart.
But if gold breaks and holds above 4,643, the bearish pressure becomes weaker and price may retest 4,670.
Key price zones
Current price area: 4,620 - 4,630
Sell liquidity zone: 4,643
Short-term resistance: 4,670
First downside reaction: 4,598
Main downside target: 4,553
Bullish pressure improves above: 4,643
Bearish pressure increases below: 4,620
Trading plan
Sell reaction scenario
If gold reaches 4,643 and rejects:
This can become the cleanest short-term resistance reaction.
Price may rotate lower toward 4,598 first.
If sellers keep control, 4,553 becomes the next major target zone.
Breakdown scenario
If gold breaks below the uptrend support:
The correction structure becomes stronger.
I will watch for continuation pressure toward 4,598 and 4,553.
Recovery scenario
If gold breaks and holds above 4,643:
The sell setup becomes weaker.
Gold may try to recover toward 4,670 before choosing the next direction.
Tiara’s View
Gold is not in a clean chase zone now.
The market is compressed between support and resistance.
4,643 is the trap zone above.
4,620 is the pressure line below.
4,553 is the main downside target if sellers win this structure.
The clean plan is simple:
Do not chase the middle.
Wait for 4,643 reaction.
Or wait for support breakdown confirmation.
Reaction first.
Confirmation second.
Trade last.
No confirmation = no trade.
Do you think gold will reject from 4,643, or break higher before the next move? Short 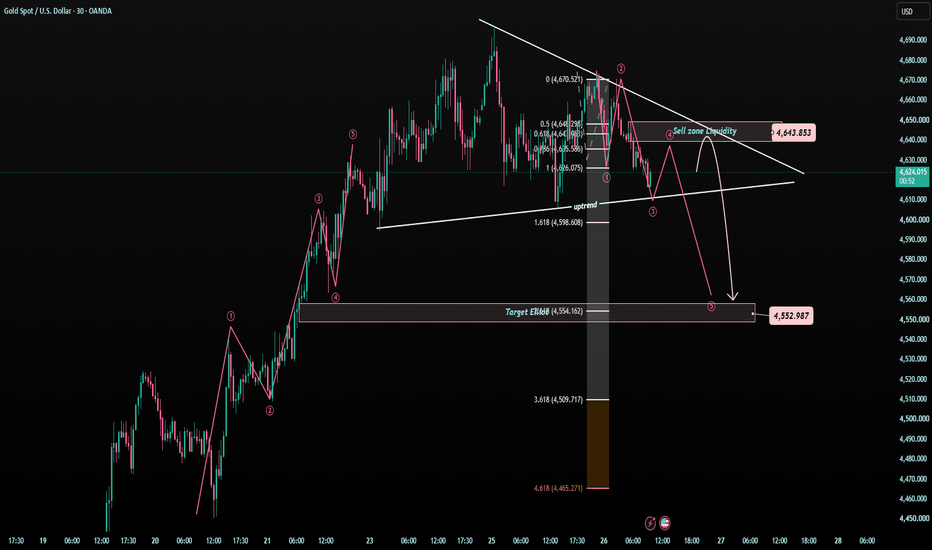
XAUUSD – Bearish Wave Toward 4,500
Gold is showing a short-term bearish Elliott Wave structure after failing to extend higher from the recent top. From Kelly’s view, price is now reacting under the wave 3 sell zone, which keeps the downside scenario active. If sellers stay in control, gold could continue lower, first into the liquidity buy zone, then deeper toward the end wave 5 area.
⟡ Market Structure
The current structure suggests gold may be building a fresh downside leg after the rejection near the upper resistance area. Price is now trading around 4,631, while the chart still shows pressure below the 4,638–4,646 sell zone.
As long as gold remains below this zone, the bearish wave sequence stays valid. The first area to watch on the downside is the dotted support near 4,595. If that level gives way, price may continue toward the 4,565–4,578 liquidity zone, where a short corrective bounce could appear before the next leg down.
If the bearish structure continues cleanly, the final downside target remains the 4,498–4,505 end wave 5 zone.
➤ Key Levels
◌ Current price: 4,631
◌ Sell zone wave 3: 4,638–4,646
◌ Intermediate support: 4,595
◌ Buy zone liquidity: 4,565–4,578
◌ End wave 5 target: 4,498–4,505
⌁ Trading Scenario
Primary bearish scenario
Entry: Sell around 4,638–4,646
Stop Loss: Above 4,655
Take Profit 1: 4,595
Take Profit 2: 4,565–4,578
Take Profit 3: 4,498–4,505
This setup follows the idea that gold is still moving inside a bearish wave sequence. A break below 4,595 would strengthen the move toward the lower liquidity area, and a deeper selloff could complete wave 5 near 4,500.
◌ Invalidation
The bearish view becomes weaker if gold reclaims and holds above 4,646–4,655, because that would suggest the current wave-down structure is failing and buyers are regaining control.
▸ Final View
For now, Kelly’s preferred view stays bearish. Gold is still trading under the wave 3 sell zone, so the path of least resistance remains lower unless buyers can reclaim resistance. The cleaner plan is to watch for rejection around the sell zone, then follow the move toward 4,595, 4,565–4,578, and potentially 4,498–4,505.
Do you think gold will complete wave 5 this week, or will buyers defend the liquidity zone first? Short 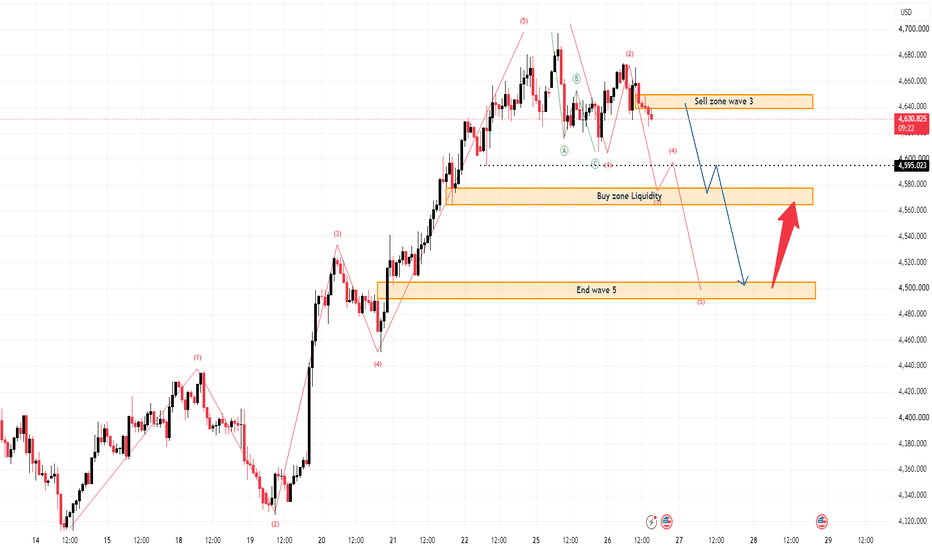
 Long
Long
GOLD - Consolidation. The trend may continueICMARKETS:XAUUSD is correcting from its 15-week highs on Tuesday amid a stronger dollar and heightened geopolitical tensions. The local bullish trend remains intact
The Dollar Index is forming a counter-trend correction, which is putting some short-term pressure on gold. The correction appears temporary, supported by easing rate expectations and technical support. The market is waiting for new signals
Drivers:
Downside: conflict escalation, higher oil prices and a stronger dollar, hawkish Fed signals.
Upside: weaker dollar, easing geopolitical risks, lower yields, dip-buying
Resistance levels: 4,680, 4,700, 4,720
Support levels: 4,630, 4,600
The local trend remains bullish. Gold is undergoing a corrective phase to build momentum ahead of a potential continuation higher.
Areas of interest: 4,720–4,775
Consolidation above 4,630 could become a technical catalyst for further upside toward the stated targets
Best regards,
R. Linda. Long 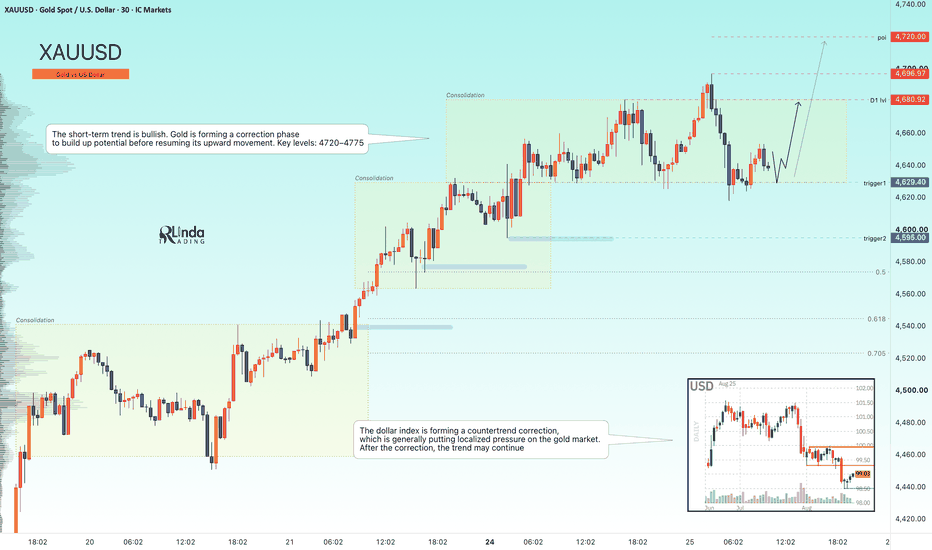

 Long
Long


