EURUSD Faces Another Sell Off Risk Beneath the 1.1220 CeilingHello traders! Hereโs my technical outlook based on the current EURUSD (1H) chart structure. EURUSD previously started to decline under the Trend Line and tested the Seller Zone multiple times. Price then formed a Fake Breakout and was rejected, continuing the bearish structure. Currently, EURUSD is trading below the 1.1220 Seller Zone while holding above the 1.1130 Buyer Zone. The recent rejection and descending Trend Line suggest a possible continuation lower toward support. As long as EURUSD
Triangle
EURUSD - A countertrend correction ahead of the news FX:EURUSD maintains its medium-term bearish trend. A strong dollar index and a weak fundamental backdrop are putting pressure on the currency pair...
The dollar index continues to rise within a bullish trend. Yesterdayโs inflation data pointed to an increase, and against this backdrop traders expect 2โ3 rate hikes.
The global trend for the euro is bearish; however, the currency pair is forming a trading range, within which consolidation continues ahead of the news.
Another batch of news is b
GOLD - A countertrend correction ahead of the CPI. Downtrend...IC:XAUUSD is confirming another bearish structure within its medium-term downtrend. However, inflation data is due to be released, and the market could develop a corrective move.
The dollar has paused its correction, while Treasury yields have stabilized. Traders are taking profits following goldโs recovery last week. Rising oil prices, which have reached two-week highs, have intensified inflation concerns and supported the dollar.
CPI data will be the key factor determining goldโs next mo
BITCOIN - Consolidation Amid a Bull Market CycleBINANCE:BTCUSDT.P maintains its medium-term bullish trend while forming a local countertrend correction, potentially setting the stage for consolidation ahead of a possible medium-term distribution phase
Various analytical services point to temporary market stagnation, while also indicating fresh capital inflows. From a technical perspective, this may reflect improving market sentiment, with additional support coming from the strong S&P 500 and Nasdaq indices.
Globally, Bitcoin has broken
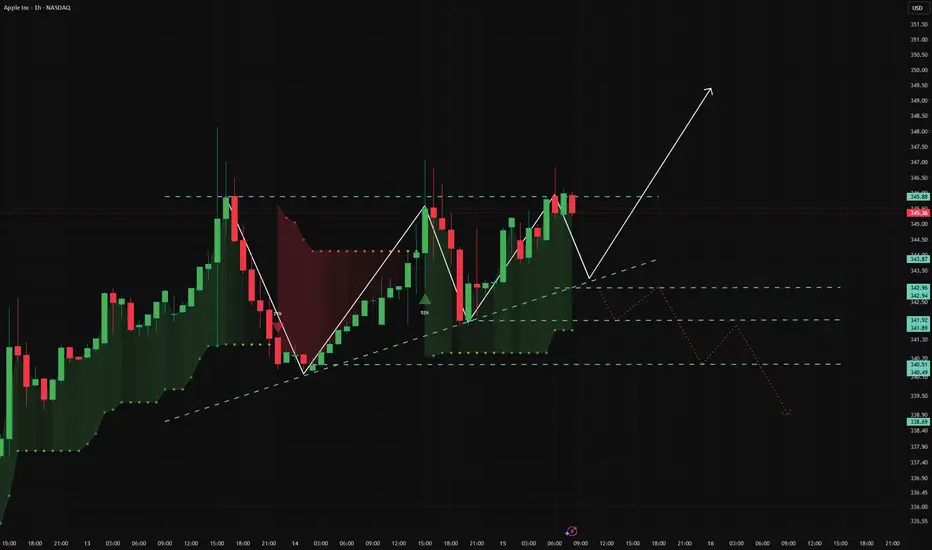
AAPL 1hAAPL 1H
HTF bias remains bullish, but price structure is still bearish.
๐ผ Bullish: Break & hold above $346 โ $349โ350
๐ฝ Bearish: Rejection โ $342.98 / $341.91 / $340.54
Entry: 1H candle closes above $346.10, then price retests $345.80โ346.10 and holds as support.
A wick above resistance alone is not confirmation. Watch volume and follow-through.
โณ Waiting for confirmation. No blind entries.
#AAPL #Trading
AAPL Triangle Breakout: $360 in Focus๐น AAPL is consolidating within a tightening symmetrical triangle, with descending resistance and rising support defining the current market structure. Price has recently pushed above the upper trendline, suggesting a potential bullish breakout after several rejections near resistance. The $330โ$335 region remains an important support area, while the recent highs around $345 represent nearby resistance. Above this structure, the highlighted liquidity area near $358โ$360 could attract attention if
EURUSD: Bearish Continuation ๐ช๐บ๐บ๐ธ
EURUSD broke and closed below the support line of the symmetrical triangle pattern on a daily time frame.
It indicates a highly probable bearish trend continuation.
Next support is 1.1135
โค๏ธPlease, support my work with like, thank you!โค๏ธ
I am part of Trade Nation's Influencer program and receive a monthly fee for using their TradingView charts in my analysis.
EURUSD: Potential Slide To 1.1150 After Its Latest ReversalHello everyone, here is my breakdown of the current EURUSD setup.
Market Analysis
EURUSD previously traded inside a range and triangle structure before breaking higher. Price then entered a downward channel, tested the Resistance Zone near 1.1280, and was rejected, confirming the bearish shift.
Currently, EURUSD is trading below the 1.1280 Resistance Zone while holding above the 1.1150 Support Zone. The recent rejection and downward channel suggest sellers may attempt another move lower.
My
GOLD - Bearish trend. Rebound from 4220 IC:XAUUSD maintains its bearish trend and is forming a bounce as part of my latest trading idea. The market remains within the 4,110โ4,220 range. A reversal setup could trigger another decline.
A strong dollar, rising oil prices, an unstable fundamental backdrop, and anticipation of CPI data are weighing on gold. The market remains in a bearish trend and could extend its decline. Thin liquidity increases the risk of sharp price movements.
The key level is $4,200: holding above it would str
Gujarat Pipavav Port: Symmetrical Triangle Breakout in FocusGujarat Pipavav Port is showing a potential symmetrical triangle breakout on the monthly chart after a strong rally followed by a prolonged consolidation phase.
The price structure indicates converging trendlines, with higher lows suggesting improving buying interest. The latest candle has moved above the upper trendline, indicating a possible bullish breakout.
๐ Technical Setup
Timeframe: Monthly
CMP: โน173.10
Pattern: Symmetrical Triangle
Breakout Zone: โน160โโน165
Immediate Support: โน152โ
Goldโs Rising Trend Line Offers Bulls a Route Back To ResistanceHello traders! Hereโs my technical outlook based on the current XAUUSD (3H) chart structure. XAUUSD previously traded inside a range before breaking higher and later forming a descending structure after turning around from the highs. Price then tested the Buyer Zone and bounced, showing signs of buyers defending support. Currently, XAUUSD is trading below the 4,300 Seller Zone while holding above the 4,150 Buyer Zone and the ascending Trend Line. The recent bounce from support suggests buyers ar
Filusdt.... weekly analysis The weekly FIL chart shows a multi-year triangle that appeared to break down, but the $0.32 wick indicates a liquidity grab by whales. The price recovery to $1.14, combined with an RSI downtrend breakout, signals that selling pressure is exhausted. If $1.40 holds, the next targets are $3.70 and then $7.00.
SPCX (SpaceX) : Ascending Channel Continuation SetupExecutive Summary
Space Exploration Technologies Corp (SPCX) is currently consolidating near the $162.57 level following a steady intermediate recovery. Price action has pulled back into a high-confluence demand zone aligning with a rising structural trendline and short-term Fibonacci retracement levels. The core bullish thesis anticipates a rebound from this "Best place to Buy" zone, targeting an expected upward expansion of approximately 13.5% to Target Zone 1 ($184.55) and up to 30.5% toward
USDINR - 5 months SYMMETRICAL TRIANGLEโโโโโโโโโโโโโโโโโโโโโโโโโโโโโโ
Since 2014, my markets approach is to spot
trading opportunities based solely on the
development of
CLASSICAL CHART PATTERNS
๐คLetโs learn and grow together ๐ค
โโโโโโโโโโโโโโโโโโโโโโโโโโโโโโ
Hello Traders โ
After a careful consideration I came to the conclusion that:
- it is crucial to be quick in alerting you with all the opportunities I spot and often I don't post a good pattern because I don't have the opportunity to write down a proper didactical comment;
- sin
Brent Crude Oil | Wave 5 or a More Complex Correction?โฑ๏ธ Reading Time: ~2 minutes
On the 1-hour Brent chart, the breakout of the Triangle in Wave (4) keeps the bullish continuation scenario in play. However, to assess the next potential move, we need to focus on the internal wave structure and how price develops from here.
In the bullish scenario, if the Triangle breakout remains valid and the market continues to develop an impulsive structure, Wave 5 could travel a distance comparable to the width of the Triangle or extend even further.
The num
BITCOIN: CORRECTION TOWARD $75,000?๐ Wave Structure
Bitcoin appears to have completed a five-wave bullish impulse from the July low near $58,000 to the September high around $87,000.
The recent price action suggests that wave 1 is complete and the market has started a corrective decline in wave 2.
The latest sideways structure can be counted as a completed W-X correction, followed by a potential decline in wave .
๐ฏ Main Scenario
I expect Bitcoin to continue its corrective decline toward the $75,000 area, where wave 2 cou
XAUUSD: Holds Its Ground Near 4,070 โ 4,220 Remains in PlayHello everyone, here is my breakdown of the current XAUUSD setup.
Market Analysis
XAUUSD previously traded inside ranges and a triangle structure before breaking higher multiple times. Price then formed another range near the Resistance Zone and is showing signs of buyers defending the Support Zone.
Currently, XAUUSD is trading below the 4,220 Resistance Zone while holding above the 4,070 Support Zone and the ascending Trend Line. The recent rebound from support suggests buyers may attempt a
BTCUSDT: Retreats From Resistance โ 81,500$ the Next Key LevelHello everyone, here is my breakdown of the current BTCUSDT setup.
Market Analysis
BTCUSDT previously traded inside a range and triangle structure before testing the Resistance Zone near 85,600. Price was rejected and broke lower, confirming the short-term bearish shift.
Currently, BTCUSDT is trading below the 85,600 Resistance Zone while holding above the 81,500 Support Zone. The recent rejection from resistance suggests sellers may attempt another move lower.
My Scenario & Strategy
As lo
GOLD - A short squeeze in 4220 could trigger a decline IC:XAUUSD remains within a medium-term bearish trend. However, the market is recovering locally as part of a liquidity-hunting phase. The key focus is on the current trading range.
The dollar is stagnating as traders take profits ahead of the long weekend in the U.S. and await next weekโs key CPI inflation report. However, the DXY remains in a bullish trend.
The CPI report will determine whether a Fed rate hike in October can be ruled out and whether a December hike remains on the table. G
Brent Crude Oil | Has the Triangle Breakout Started Wave 5?โฑ๏ธ Reading Time: ~2 minutes
In the previous Brent analysis, the focus was on whether the corrective structure was nearing completion or could develop into a larger correction.
In this latest update, the internal structure is providing more important information.
In the bullish scenario, it appears that Wave (4) has completed a Triangle, and the breakout of Wave D is the first important signal that the bullish move may be continuing.
If this interpretation is correct, the current move can be