AMZN – Triple Bottom at HVLAMZN is consolidating after a sharp pullback from the May highs, and price is now sitting on 257.5 – HVL — the gamma flip / regime pivot.
Over the past month, the stock has tested this zone three times , forming a clear triple bottom at the HVL level. Each dip found support near 255 – P1 and bounced — a technical pattern that aligns with the strongest put wall and the GEX regime boundary below spot.
With price holding above 257.5 – HVL , AMZN remains inside a positive GEX regime — but the setup is fragile until the triple bottom holds on a closing basis.
🔶 Regime Context 🔶
257.5 – HVL is the regime pivot — the level where net gamma flips. Price is currently resting directly on this line after three successful tests, keeping AMZN structurally above negative gamma territory.
A clean loss of HVL would shift the stock back into a more reactive GEX environment, with 255 – P1 as the first major put wall below.
🔶 Options Structure Context 🔶
👉 275 – C1 — highest call NETGEX wall; primary upside target if the HVL base holds
👉 257.5 – HVL — regime pivot / triple bottom support zone
If 275 – C1 is cleared with acceptance, price would enter the positive gamma extension zone — opening gamma squeeze potential toward the next call wall above.
🔶 Downside Structure 🔶
👉 255 – P1 — strongest put wall; floor of the triple bottom pattern
👉 257.5 – HVL — must hold to keep the positive GEX regime intact
The 200 SMA is trending upward just below this zone, adding moving-average confluence to the 255–257.5 support cluster.
🔶 Options Sentiment 🔶
CALL$ 38.9% means call options at an equivalent distance from spot are priced 38.9% higher than the corresponding puts — this is call pricing skew , reflecting moderate upside demand despite the recent pullback.
On the Options Oscillator, the green histogram is building at the right edge — call pricing skew is increasing as price stabilizes at HVL.
IVRank 24.2
IVx 34.9
CALL$ 38.9% — call pricing skew
Implied move ±1.79% (±4.6)
🔶 Key Structure to Watch 🔶
275 – C1 — primary call wall / recovery target
257.5 – HVL — regime pivot; triple bottom support
255 – P1 — put wall floor; loss opens deeper downside
For now, AMZN is sitting on HVL after a triple bottom — the key question is whether this base holds and momentum can rebuild toward 275 – C1 .
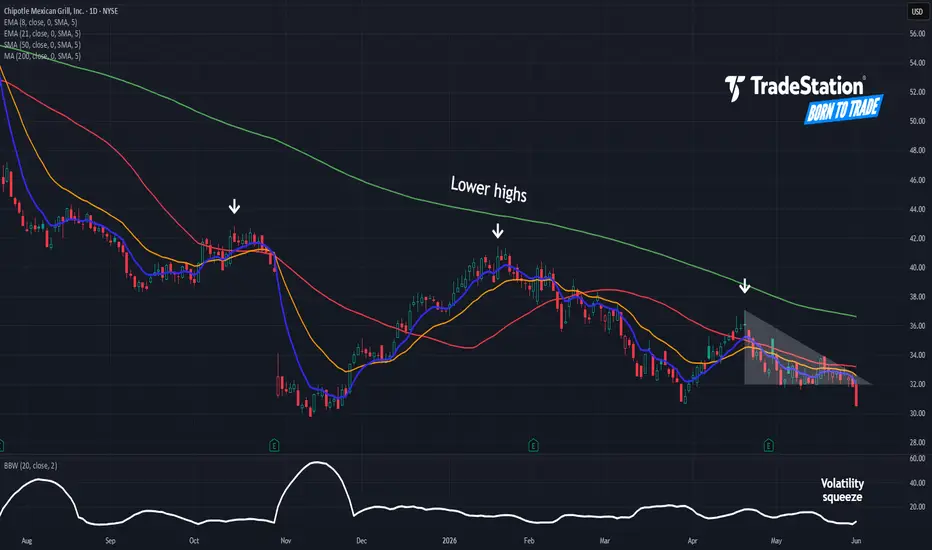
The key question is simple: can price hold 257.5 – HVL on a closing basis — or does the triple bottom fail and price retest 255 – P1 ? Chipotle: Triangle Breakdown?Chipotle Mexican Grill has consolidated all year. Is it ready for another push to the downside?
The first pattern on today’s chart is the series of lower highs since late April. CMG remained above roughly $32 until it fell through support yesterday. That could be viewed as a bearish triangle breakdown.
Second, the burrito chain made successively lower highs since October. Its 50-day simple moving average (SMA) has also stayed below its 200-day SMA. Those signals may be consistent with a long-term downtrend.
Third, Bollinger Bandwidth recently narrowed but is now starting to rise. That may suggest a period of price compression is ending.
Finally, the 8-day exponential moving average (EMA) is below the 21-day EMA. That may be consistent with short-term bearishness.
TradeStation has, for decades, advanced the trading industry, providing access to stocks, options and futures. If you're born to trade, we could be for you. Learn more here about TradingView’s Broker of the Year!
Past performance, whether actual or indicated by historical tests of strategies, is no guarantee of future performance or success. There is a possibility that you may sustain a loss equal to or greater than your entire investment regardless of which asset class you trade (equities, options or futures); therefore, you should not invest or risk money that you cannot afford to lose. Online trading is not suitable for all investors. View the document titled Characteristics and Risks of Standardized Options at www.TradeStation.com . Before trading any asset class, customers must read the relevant risk disclosure statements on www.TradeStation.com . System access and trade placement and execution may be delayed or fail due to market volatility and volume, quote delays, system and software errors, Internet traffic, outages and other factors.
Securities and futures trading is offered to self-directed customers by TradeStation Securities, Inc., a broker-dealer registered with the Securities and Exchange Commission and a futures commission merchant licensed with the Commodity Futures Trading Commission). TradeStation Securities is a member of the Financial Industry Regulatory Authority, the National Futures Association, and a number of exchanges.
TradeStation Securities, Inc. and TradeStation Technologies, Inc. are each wholly owned subsidiaries of TradeStation Group, Inc., both operating, and providing products and services, under the TradeStation brand and trademark. When applying for, or purchasing, accounts, subscriptions, products and services, it is important that you know which company you will be dealing with. Visit www.TradeStation.com for further important information explaining what this means. Forecast: Bitcoin x 100, by 2029Bitcoin has now retraced back to the second downsloping channel, marked as “Windfall.” In essence, a Windfall is a wider version of a trend barrier, which I prefer over single trendlines because it gives price more structural context.
In my framework, two consecutively broken Windfall barriers originating from the same region form one of the strongest bullish signals . When price later retraces back to the second broken barrier, I view that as a high-quality entry opportunity.
We are currently at such a potential entry point. Price has also recently interacted with the orange support line. This line is essentially a modified lower Bollinger Band, set to 50 periods and slightly smoothed, with filtering applied to reduce the impact of extreme outlier moves.
According to @EdgeTools, mean reversion after lower-band penetration produced statistically significant results, especially for long trades. See the related idea for more details.
Although I use the modified lower Bollinger Band as a supporting signal within the entry framework, I do not use the Bollinger mean as my target. Instead, I am aiming for the center median line of the newly formed pitchfork.
Because price history widens over time, pivot B had to be migrated to the left to preserve the proper slope of the median lines. If pivot C is correct, then price should have a statistical probability of around 80% of reaching the next median line.
For the target level and maturity duration, I copied the initial impulse leg and projected it from point C. In my experience, price often tends to mimic the slope and flow of the first major action.
On a lower timeframe, I also see the possibility of a pullback toward the local trend barrier, which could provide a more refined entry opportunity around 73,100 .
 Long
Long
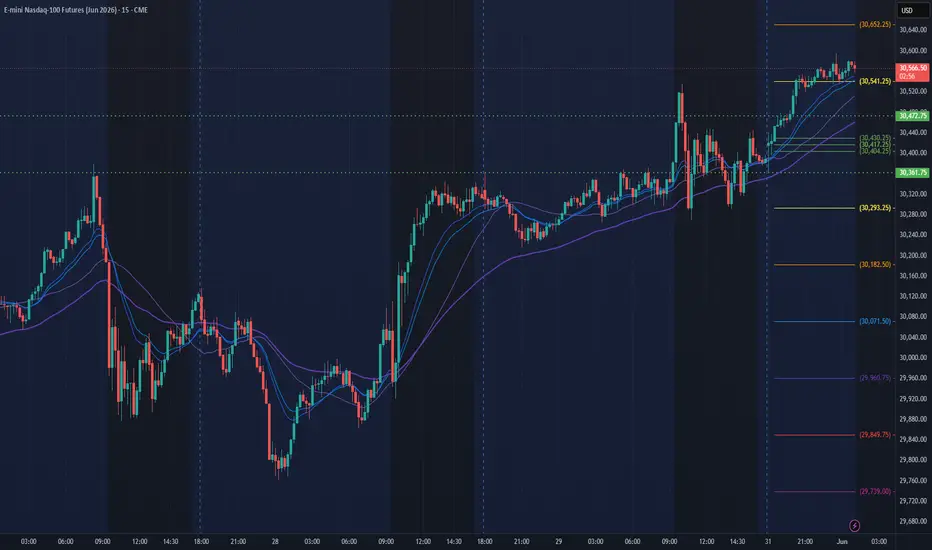
US 100 Index – Can US Data Challenge the Rally?The US 100 index breezed through the psychological 30000 level on Wednesday last week as part of a run of 8 consecutive up days in a row as momentum and sentiment towards AI stocks combined to set several new record all-time highs, culminating in a close on Friday at 30340.
Despite a brief wobble to start June, after concerns rose amongst traders that US-Iran peace talks may have been stalled by Israel’s deeper incursion into Lebanon, the US 100 eventually extended the run to 9 up days in a row by posting a more subdued gain of 0.5% yesterday. This move was supported by comments from NVIDIA CEO Jensen Huang who dismissed concerns over the disruptive force of AI, while the world’s largest company also announced it was entering the PC market in a direct challenge to Intel and AMD, and will run Microsoft’s windows for Arm operating system (Bloomberg).
Looking forward, with the US 100 trading down 0.2% at 30425 at time of writing (0645 BST), the focus for traders may shift to updates on the health of the US economy, and more specifically on the resilience of the labour market. Tomorrow’s US ISM Services PMI survey will provide an important update on how service activity, which is the main driver of growth within the US economy, is performing in the face of rising inflation, while Friday’s crucial Non-farm payrolls release will highlight if the jobs market is maintaining its recent run of resilience in the face of mounting challenges created by the Iran conflict. All of which could impact the thinking of Federal Reserve policymakers in deciding their next move on interest rates when they meet on June 17th.
Technical Update: The Trend Continues …..
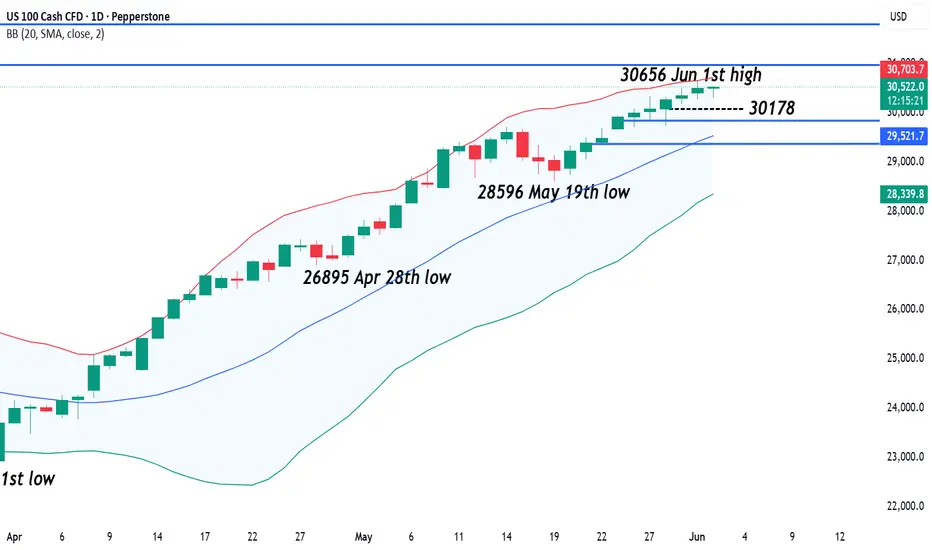
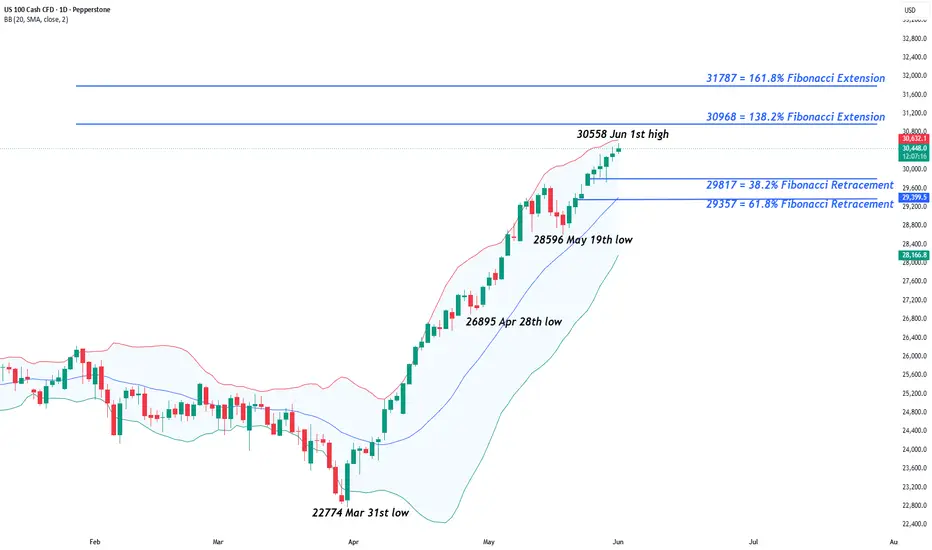
From the March 31st low of 22774 into yesterday’s new all‑time high at 30656, the US 100 index has now rallied more than 34.5% across 45 trading days. During this advance, only 11 sessions have closed lower than they opened the day, producing a red candle on the chart below. This continues to indicate that positive sentiment remains in place, with no sign yet of an extended phase of weakness developing.
Of course, a positive trend does not guarantee further gains.
Unexpected developments can still trigger a sharp correction or a shift in sentiment. With that in mind, ahead of this week’s US data releases it may remain useful for traders to identify key support and resistance levels that if broken, may guide the next directional themes.
Potential Resistance Levels:
While previous all‑time highs have not always acted as significant barriers during this latest US 100 rally, the most recent extreme could still attract attention. Yesterday’s peak of 30656 may act as the first resistance point, and how price behaves around this level on a closing basis could be important. A closing break above 30656 might lead to further attempts at price strength.
If upside breaks above 30656 were to materialise, the prevailing uptrend may continue to generate new highs. In that case, focus could shift to 30968, which is the 138.2% Fibonacci extension, and potentially even 31787, which is the 161.8% extension.
Potential Support Levels:
Given the scale of the recent rally, it could be argued that over‑extended upside conditions are present, which may lead to a period of weakness. The first key support stands at 30178, a level which is equal to half of the latest phase of price strength. If downside momentum begins to build, this could be the initial level traders focus on.
A closing break below 30178 could open scope for a deeper correction phase, exposing potential to test 29846, which is the 38.2% retracement, and then 29369, which is the deeper 61.8% retracement of the latest advance.
The material provided here has not been prepared accordance with legal requirements designed to promote the independence of investment research and as such is considered to be a marketing communication. Whilst it is not subject to any prohibition on dealing ahead of the dissemination of investment research, we will not seek to take any advantage before providing it to our clients.
Pepperstone doesn’t represent that the material provided here is accurate, current or complete, and therefore shouldn’t be relied upon as such. The information, whether from a third party or not, isn’t to be considered as a recommendation; or an offer to buy or sell; or the solicitation of an offer to buy or sell any security, financial product or instrument; or to participate in any particular trading strategy. It does not take into account readers’ financial situation or investment objectives. We advise any readers of this content to seek their own advice. Without the approval of Pepperstone, reproduction or redistribution of this information isn’t permitted.  Short
Short
Oil (WTI) – Assessing Volatility Within a Choppy RangeOil (WTI) prices began the start of a new month of trading by rebounding strongly from a test of 6-week lows at 89.327 on Friday. This morning Oil spiked 2% to trade at 92.77 (045 BST) on disappointment that the US-Iran could not reach terms over the weekend to extend their existing ceasefire agreement for another 60 days and reopen the Strait of Hormuz, leaving the macro backdrop uncertain with the conflict now in its 14th week.
Further complicating the negotiations are an escalation of a war between Israel and Hezbollah, who is Iran’s strongest ally in the region. This has seen Israel launch a new ground assault moving deeper into Lebanon, which led Hezbollah to increase missile attacks on Israel’s north over the weekend. It is unclear whether either side would pause to allow a new agreement between US-Iran to be reached.
Looking forward, progress updates on whether these separate events in the Middle East are heading towards a positive or negative conclusion could be pivotal to the direction of Oil prices across the week.
Technical Update: Choppy Sideways Range Extends:
Between the March 9th high and March 10th low, an Oil (WTI) price sell-off of nearly 36% materialised, and while price moves have subsequently seen volatile swings, these have been confined by those March 9th and 10th extremes. As the chart below shows, even with sentiment still being driven by the constant flow of headlines on the US-Iran conflict, the market continues to trade in a broad sideways range, suggesting a closing breakout of either side may be necessary to reveal the next directional theme.
Given the wide range and elevated volatility, further price swings are still possible, even if they remain inside the broader consolidation. In this environment, tracking more intermediate support and resistance levels inside the wider range could help gauge the shorter‑term directional potential.
Potential Support Levels:
After the latest phase of weakness, traders may now be looking for support levels that could possibly stabilise price declines or even trigger recovery attempts. Following the recent falls, the focus for traders may be on 89.02, which is the April 20th low.
A closing break below 89.02 could increase downside pressure and expose the next support at 82.60, which is the April 17th low. Within the current daily structure, 82.60 appears to mark the lower boundary of the sideways range, making it a potentially important level to monitor for the longer‑term outlook.
Potential Resistance Levels:
If a more sustained price recovery is to develop, traders may be watching how the 93.61 level, which represents half of last week’s range, is defended on a closing basis. While not a guarantee of price strength, closing breaks above 93.61 could encourage further upside attempts.
As the chart above shows, breaks above 93.61 may shift attention toward higher resistance levels, possibly opening scope for tests of 96.98, the 38.2% Fibonacci retracement of the May decline, and potentially then the 50% retracement at 99.29.
The material provided here has not been prepared accordance with legal requirements designed to promote the independence of investment research and as such is considered to be a marketing communication. Whilst it is not subject to any prohibition on dealing ahead of the dissemination of investment research, we will not seek to take any advantage before providing it to our clients.
Pepperstone doesn’t represent that the material provided here is accurate, current or complete, and therefore shouldn’t be relied upon as such. The information, whether from a third party or not, isn’t to be considered as a recommendation; or an offer to buy or sell; or the solicitation of an offer to buy or sell any security, financial product or instrument; or to participate in any particular trading strategy. It does not take into account readers’ financial situation or investment objectives. We advise any readers of this content to seek their own advice. Without the approval of Pepperstone, reproduction or redistribution of this information isn’t permitted.
Long 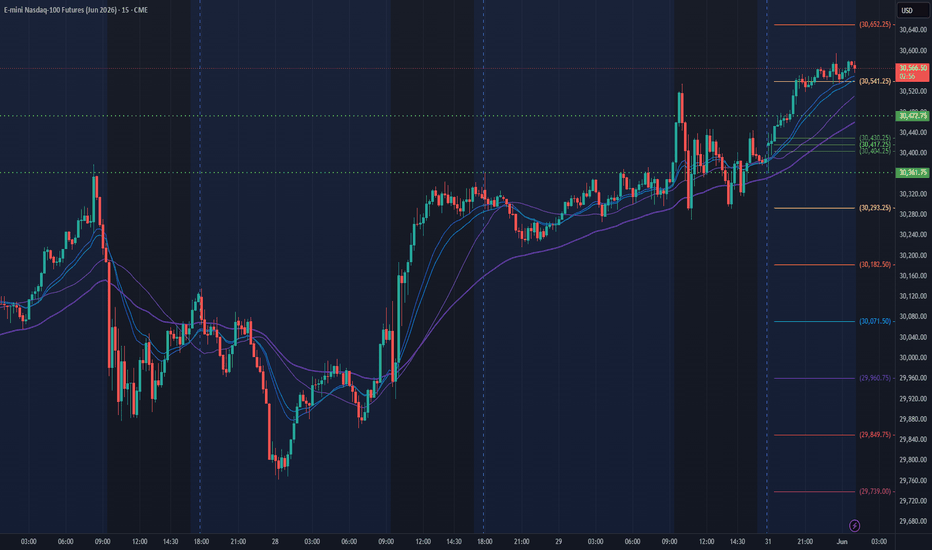
Weekend Review - One chart that makes you act with confidenceIn this post, I show that the S&P 500 is not running on fumes — market internals are confirming the advance and the rally has healthy support.
Using the Market Internal Pressure Dashboard, this article explains why participation is improving, leadership is expanding, and volatility is normalized, giving the uptrend real staying power.
And this is why you can act with confidence — because you understand what’s happening beyond price.
1️⃣ What is it today?
The S&P 500 has largely repaired the damage from the March-April stress event and is trading near recent highs. However, the more interesting story is not price itself but what is happening underneath the surface.
Market internals show:
VIX/VIX3M has moved back below 1, indicating stress normalization.
New 52-week highs continue to outnumber new lows.
Participation has improved materially from the breadth washout seen during the correction.
The percentage of stocks above their SMA20 and SMA200 has recovered, but remains far from euphoric extremes.
Leadership remains constructive rather than collapsing.
The market is behaving like a system testing whether higher prices can be accepted.
2️⃣ Thesis
The current market environment is best described as Recovery transitioning into Acceptance.
The key observation is that volatility normalized before participation fully recovered.
Price has returned to the highs faster than breadth has returned to extremes.
This is important because it suggests the advance is not being driven by indiscriminate optimism. Instead, participation is gradually rebuilding while leadership (currently: Chips, Semis, Fabs, AI) remains intact.
The market appears to be moving from stress relief toward acceptance.
3️⃣ What validates the thesis?
The thesis remains valid while internal conditions continue to support price:
VIX/VIX3M remains below 1 (better below 0.9).
New highs continue to exceed new lows with expanding leadership (other sectors joining such as SaaS and IGV recovering recently)
Breadth (% above SMA20 and SMA200) stabilizes or improves >60%.
Up volume continues to dominate down volume over time (effort confirming the move).
Most importantly:
The market's internal behavior must continue to confirm the message of price.
4️⃣ What invalidates the thesis?
The thesis weakens if price continues higher while internal participation deteriorates.
Warning signs would include:
New highs stop expanding.
New lows begin increasing.
Breadth rolls over while price remains elevated.
VIX/VIX3M starts rising back toward or above 1.
Leadership narrows significantly (even more narrowed on the AI theme; SaaS bounce fails).
Up volume deteriorates despite stable index levels.
A healthy market can withstand pullbacks. What matters is whether participation and leadership remain intact during those pullbacks.
------------------
Grabbing this chart and using it will do the following for you:
1. Reduction of Uncertainty / Confusion
This chart replaces guesswork with clear evidence by showing whether participation, leadership, and volatility are improving or deteriorating. Instead of predicting price, you simply assess if the weight of internal data supports the move.
2. Reduction of Effort
The framework trains you to scan the same five recurring conditions every time — volatility regime, participation, leadership, effort, and price confirmation. Once you recognize these patterns, decisions become faster and far more consistent.
3. Identity Reinforcement
This approach shifts your identity from a prediction-driven trader to a process-driven trader who follows evidence over opinion. You no longer tie self-worth to being right on every trade, but to consistently applying a disciplined framework.
I wish you a fruitful and confident week!
 Long
Long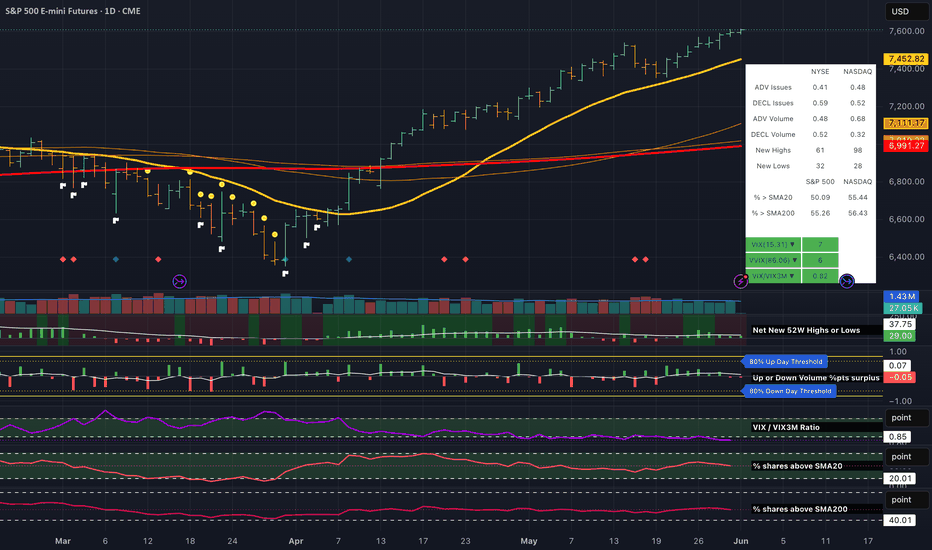
 Long
Long
What You Learn From NOW and DELLAt first glance, DELL and NOW appear to tell very different stories. DELL teaches the danger of dismissing a stock because it has already advanced significantly. NOW teaches the danger of dismissing a stock because you personally do not like it (very much hyped... it's been weeks that a lot of people called it the "buy" opportunity and it dropped another 30% - pure noise and distraction until now when structure starts repairing). Yet both examples ultimately point to the same conclusion: successful investing is less about prediction and opinion than it is about responding to changing evidence.
In the case of DELL, the mistake would have been focusing on the stock's past performance. The framework highlighted improving relative strength, strengthening trend structure, rising momentum, and continued institutional acceptance. The stock felt late, but the evidence kept improving. In the case of NOW, the mistake would have been focusing on a personal narrative. I remained skeptical of the stock, but the framework eventually shifted from "monitor" to "engage" because structure, momentum, relative strength, and participation began aligning.
My opinion did not change the chart; the chart changed the assessment.
Together, these examples highlight three practical benefits of a structured framework:
1. Reduction of Uncertainty / Confusion
A framework replaces opinions with evidence. Instead of trying to predict the future, you simply assess whether the weight of evidence is improving or deteriorating.
NOTE DOWN: "I don't need to know the future; I need to assess whether evidence is improving."
2. Reduction of Effort
Without a framework, every chart feels unique. With one, you repeatedly look for the same small set of conditions, making decisions faster and more consistent.
NOTE DOWN: "I don't need to analyze everything; I need to recognize a handful of recurring conditions."
3. Identity Reinforcement
Successful investors are not defined by being right on every trade. They are defined by following a disciplined process that prioritizes evidence over opinion and probabilities over prediction.
NOTE DOWN: "I am a process-driven investor, not a prediction-driven investor."
The most important lesson from both DELL and NOW is that the market does not reward certainty, personal conviction, or perfect timing. It rewards the ability to recognize when evidence is improving and to act consistently when it does. Sometimes that means buying a stock much later than feels comfortable (I did not track DELL early on, yet getting in late after a +70% move made me a profit of ~115%). Sometimes it means buying a stock you never particularly liked in the first place (NOW has been called out for weeks as a “buy” and one(!) day that will be correct, yet after the March bounce it dropped by more than 30%). In both cases, the process matters more than the noise.
The goal is not to think like a successful investor after you become one. The goal is to think and behave like one before the results arrive. DELL and NOW are not really lessons about two stocks. They are reminders that outcomes are often the delayed consequence of a process. The question is not whether you can identify the next winner. The question is whether your current approach resembles the behavior of the investor you aspire to become. Avoiding a 30% drawdown (or rather realized losses triggered by a stop loss) and a 115% gain with a “late” entry is something I do not feel ashamed of.
Michael Schumacher did not become Schumacher the day he won championships. Cristiano Ronaldo did not suddenly adopt elite habits after becoming (one of) the best player in the world. The All Blacks did not start behaving like champions after they won. They behaved like champions first. The results followed. The same principle applies to trading.
Act like a professional and the results will follow. There are many approaches to the stock market and everyone has different resources and circumstances to deal with but with certainty the approach is not :
- reacting to every headline
- changing methods constantly
- making decisions emotionally
- searching for certainty before acting
 Education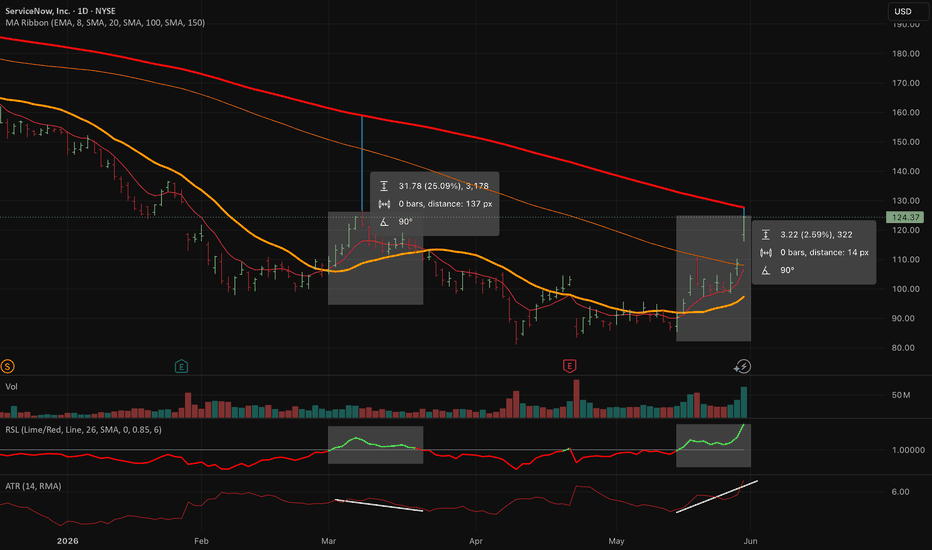
DELL:Worrying About Entering Late Would Have Cost Me a 115% GainLooking back at the chart, what stands out is not the eventual magnitude of the move, but how many signs were already pointing toward an improving structure long before the stock became a market leader. Relative strength turned positive, the relative strength moving average started rising, key moving averages crossed into bullish alignment, and longer-term trend momentum began accelerating. Volatility acted as fuel and was not hostile.
In hindsight, the evidence was plentiful. The reality, however, is that I was not watching Dell particularly closely at the time and therefore did not act on the earlier signals.
What ultimately gave me confidence to enter (late) was not a single indicator but the continued accumulation of evidence. As additional signals appeared and the trend kept confirming itself, the probability of a sustained move increased, even though the stock was trading significantly higher than where the first clues had emerged.
One of the most persistent mistakes investors make is assuming that a stock which has already risen significantly is no longer worth buying. We are conditioned to search for bargains, to believe that the best opportunities exist near the lows, and to feel uncomfortable paying prices that are noticeably higher than they were only a few weeks earlier. In practice, however, many of the market's biggest winners do not look attractive when they begin their most profitable advances. They look expensive, extended, and, above all, late.
When I bought Dell around $197 on 18th April, the stock had already moved well off its lows (> +70%). To many observers, the obvious conclusion would have been that the easy money had already been made. Yet the chart was telling a very different story. Several pieces of evidence suggested that institutional demand was strengthening rather than weakening:
* Relative Strength turned positive.
* Relative Strength started outperforming the market.
* The Relative Strength moving average turned upward.
* Price reclaimed and held above key trend references.
* The longer-term trend structure began accelerating.
None of these developments guaranteed future gains, but together they painted a picture of a stock moving from recovery into leadership. Since then, Dell has advanced to roughly $420, turning what many would have considered a "late" entry into a gain of around 115%.
The lesson is not that every stock purchased after an initial advance will double. The lesson is that investors often focus on how much a stock has already moved instead of asking whether the underlying trend is becoming stronger. Successful trend investing is not about buying at the lowest possible price; it is about recognizing when demand is becoming persistent and when a stock is transitioning from being overlooked to being widely accumulated. Ironically, the greatest opportunities rarely feel comfortable when they first emerge. They often feel:
* Extended.
* Uncomfortable.
* As if the move has already happened without you.
That discomfort is precisely why many investors miss them. What feels late at the beginning of a major trend often turns out to have been remarkably early. In many cases, the greatest opportunity cost is not buying too late—it is spending so much time worrying about being late that you never participate in the trend at all.
 Education
BTC: Bear regime day 3 $74K low, AI reads Range, price says bearRegime State
INDEX:BTCUSD is in a Bear regime for 3 bars with a negative score. The AI model is reading Range at 70% — its lowest confidence reading of the entire post-Bull period, down from 83% two sessions ago. That decay is worth paying attention to: the AI is becoming less certain about Range as a destination just as price is accelerating away from the range boundaries. Something in the derivatives data is shifting the model's view, and the direction it's shifting toward is not reassuring. BINANCE:ETHUSD is at 81% Bear, SOL has flipped to Bear at 65%, and ADA is reading Bear at 91% — the cross-asset picture the AI is processing has deteriorated materially since the May 27 Bear trigger.
The Setup
Price is at $73,954 on INDEX:BTCUSD , having printed a session low of $72,402 — the lowest print of the entire sequence dating back to early April. The 20 SMA is at $77,616 and declining, with price now $3,660 below a falling average and the gap widening. The chart shows three consecutive red sessions since the Bear label appeared, each printing a lower low, with no session attempting to reclaim the $75,149 range floor that broke on May 27. That level has flipped from support to resistance without being retested — clean breakdown behaviour. Volume at 8.68K on today's session is the highest of the Bear regime so far. The $72K–$73K zone referenced in the last two Ideas as the next structural reference below $74K is now being tested in real time.
What Would Change the Read
A close back above $75,149 within the next session is the only scenario that puts the Bear label back in question — that's now a $1,200 move from current price against a declining SMA, and with ADA at 91% Bear and SOL flipping to Bear at 65%, the AI is not reading cross-asset conditions that support a reversal. A close below $72K opens the April low zone as the next reference with no structural support visible on the chart between here and there. The AI confidence in Range dropping from 83% to 70% in two sessions while Bear confirmation builds across assets is the most important model signal right now — watch whether that number continues to decay toward Bear as the primary label.
Continuity
Previous Idea (May 27) called the $74K close below as the level removing false-break ambiguity. Session low today was $72,402. The $72K–$73K zone is being tested, cross-asset Bear is widening, and the AI's Range confidence is fading. Three bars in, the Bear regime is behaving like one. Short 
 Long
Long
I Do or Do Not Like NOW. A Framework Doesn't Care.I do not think "opinions", feelings, emotions, mood etc. are helpful or should matter when it comes to trading stocks.
Gurney told Paul: "Mood's a thing for cattle or making love or playing the baliset. It's not for fighting."
I have been skeptical on NOW and it is the first time since its downtrend that the framework flags (permission to) "engage" instead of just a "monitor" or "reject". There is no point in predicting prices. Either the structure allows you to enter or not.
There is a significant change compared to March: We had another(!) compression/digestion phase and the price is above the SMA20/50/100. But accept the only the SMA20 is moving upwards.
Entry suggestions are shared at the end!
1️⃣ What is it today?
A momentum expansion stock emerging from a successful structural repair.
Price has reclaimed key moving averages, relative strength is improving, and momentum has re-accelerated after the April reset.
2️⃣ Thesis
The market is accepting higher prices again.
This is a Reset → Relaunch phase where trend structure, momentum, relative strength, and participation are aligning. The edge comes from persistence and continued institutional acceptance, not from predicting a breakout.
3️⃣ What validates the thesis?
✅ Price holds above SMA20
✅ Relative Strength remains above its moving average
✅ Momentum continues to improve
✅ Volatility expands with price, not against it
✅ Higher prices continue to be accepted rather than rejected
4️⃣ What invalidates the thesis?
❌ Loss of SMA20 support
❌ Relative Strength deterioration below its moving average
❌ Volatility expansion while price weakens
❌ Failed re-acceleration after the recent recovery
💡 This is not a turnaround story anymore. The repair phase appears complete, and the stock is transitioning into a momentum expansion regime. As long as structure and relative strength remain intact, continuation remains the default assumption.
---Entry Ideas---
Conservative
- Zone: SMA20 region (~96–100)
- Wait for controlled pullback and acceptance
- Risk: Stock may continue without offering the pullback.
Aggressive
- Zone: Current range (~107–111)
- Enter through continued acceptance above SMA100
- Risk: Higher probability of short-term drawdown.
Time Horizon Alignment
- This setup depends more on persistence over time than immediate acceleration.
- Patience is more valuable than perfect timing. Long 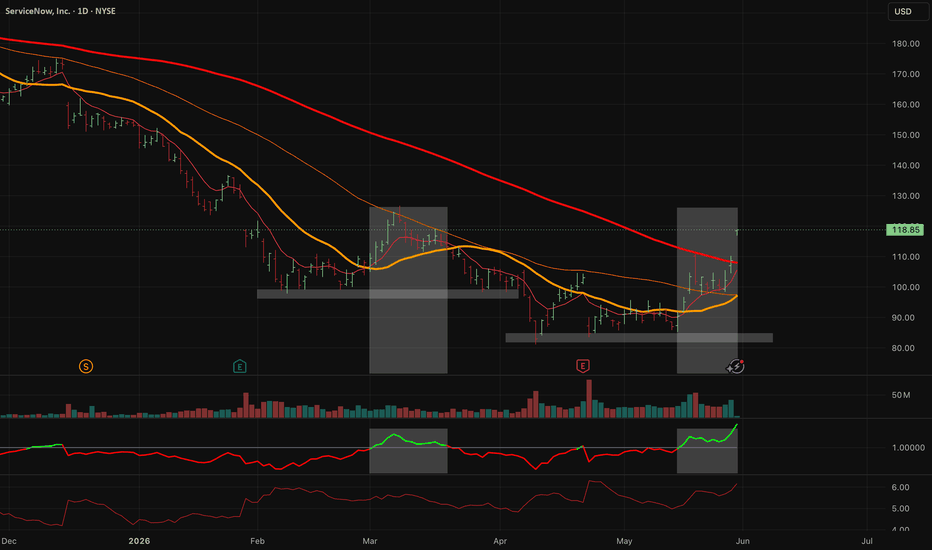
PLTR GEX - Triple Bottom BouncePLTR is bouncing sharply from a triple bottom base after three separate tests of 130 – P1 — the strongest put NETGEX wall on the chart.
Price has reclaimed 135 – HVL and is now pressing 145 – C1 , the highest call NETGEX wall overhead.
🔶 Regime Context 🔶
Price is trading above 135 – HVL , keeping PLTR in a positive GEX regime — typically more controlled price action than below the gamma flip.
The triple-bottom defense at 130 (P1) built the base — but the regime shift came with acceptance above 135 (HVL) , not merely holding P1.
🔶 Options Structure Context 🔶
👉 145 – C1 — highest call NETGEX wall; immediate decision level above spot
👉 150 – C2 — next call wall / extension reference if 145 is accepted
👉 130 – P1 — triple-bottom floor / strongest put wall below
The bounce is constructive while 130 (P1) holds and price stays above 135 (HVL) . A clean acceptance above 145 (C1) would open the positive gamma extension zone — gamma squeeze potential toward 150 (C2) .
🔶 Downside Structure 🔶
👉 135 – HVL — regime pivot; loss here shifts structure back toward transition
👉 130 – P1 — triple-bottom support; failure below HVL opens retest toward 120 (P2)
🔶 Options Sentiment 🔶
CALL$ 44.8% means call options at an equivalent distance from spot are priced 44.8% higher than the corresponding puts — this is call pricing skew , with calls modestly premium-rich at current levels.
On the Options Oscillator, the filled green histogram is flat at the right edge — call pricing skew is stable , not building with the bounce. Mid-term expiries show positive skew , while near-term skew remains negative.
IVRank 17.2
IVx 51.2
CALL$ 44.8% — call pricing skew
Implied move ±2.11%
🔶 Key Structure to Watch 🔶
145 (C1) — primary call wall; breakout vs. rejection
135 (HVL) — regime pivot; must hold for positive GEX
130 (P1) — triple-bottom / put wall floor
150 (C2) — extension target if 145 clears
For now, PLTR has bounced off a triple bottom at 130 (P1) , reclaimed 135 (HVL) , and is pressing 145 (C1) in a positive GEX regime — with gamma squeeze potential only if C1 is accepted.
The key question is whether momentum can break and hold above 145 (C1) — or whether the move stalls and pulls price back toward 135 (HVL) / 130 (P1) . Short 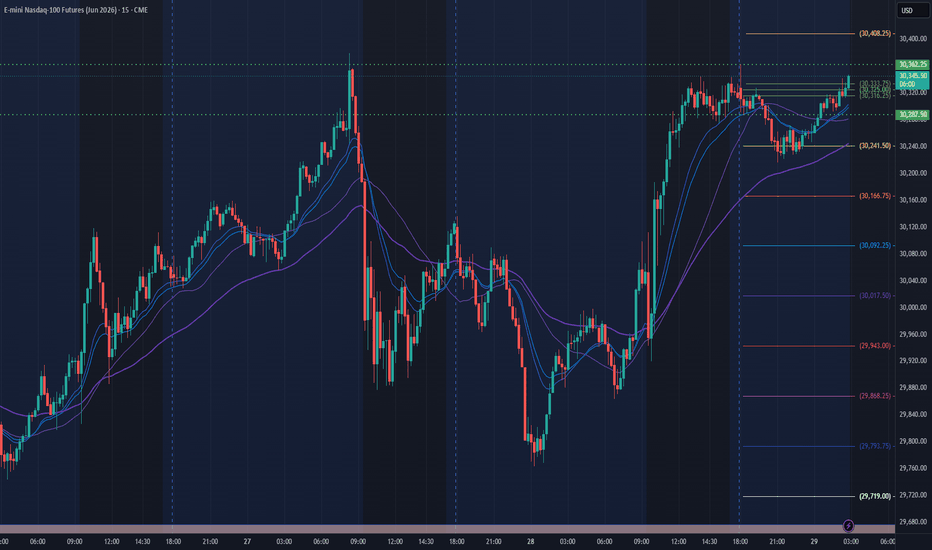
NVDA – Pullback Holding Above P1/HVLNVDA is pulling back after a sharp rally that peaked near 236 in late May.
On the daily chart, price has retraced from those highs but remains above P1 and the High Volatility Level around 207.5 . That keeps the stock inside a positive GEX regime for now — as long as this zone holds, price action tends to stay more controlled than in a negative gamma environment below HVL.
This matters because the current move is not a breakdown yet — it is a retracement within a broader uptrend , with price still holding well above the 50 SMA (~198) and 200 SMA (~187) .
🔶 Regime Context 🔶
Price is currently testing the 207.5 P1 / HVL zone — the immediate regime pivot after the rally. A clean loss of 207.5 would open the path toward the 200 confluence cluster below.
🔶 Options Structure Context 🔶
👉 220 – C1 (highest call NETGEX wall)
Confluence at 220:
C1 — highest call NETGEX
Ab1 — largest absolute gamma
CV / nCV — strongest call volume flow today
That makes 220 a clear reaction zone for any recovery attempt — not just a round number. Above that, structure extends toward 224 (C3) and 232 (C2) .
🔶 Downside Structure 🔶
👉 207.5 – P1 / HVL — immediate regime pivot (currently being tested)
👉 200 – POI + COI + AbOI + nPV + PV
Confluence at 200:
COI — highest call open interest
POI — highest put open interest
AbOI — highest absolute open interest
nPV / PV — strongest put volume
Together, this points to protective put positioning at 200 — a major dual-OI and put-flow cluster below spot.
👉 195 – P2 — next put wall below the 200 zone
🔶 Options Sentiment 🔶
CALL$ at 27.6% (51 DTE) means call options at an equivalent distance from spot are priced 27.6% higher than the corresponding puts — this is call pricing skew , showing moderate call-side demand in the options market.
On the Options Oscillator , the green histogram has declined from a recent peak — call pricing skew is fading from its highs , even though it remains positive.
IVRank 29.7
IVx 42.6 (51 DTE) | IVx 5dCh +0.3%
CALL$ 27.6% (51 DTE) — call pricing skew
Implied move ±0.25% (±0.5)
IVR 28.6 | IVx avg 42.4 | positive GEX dot
🔶 Key Structure to Watch 🔶
207.5 (P1 / HVL) — regime pivot / hold or break
220 (C1 + Ab1 + CV) — primary call wall / recovery ceiling
200 (COI + POI + AbOI + PV) — major support / protective put cluster
236 — recent swing high / pullback origin
195 (P2) — put support below 200
For now, NVDA is in a post-rally pullback, still holding above P1/HVL inside positive gamma, with call skew fading but still positive.
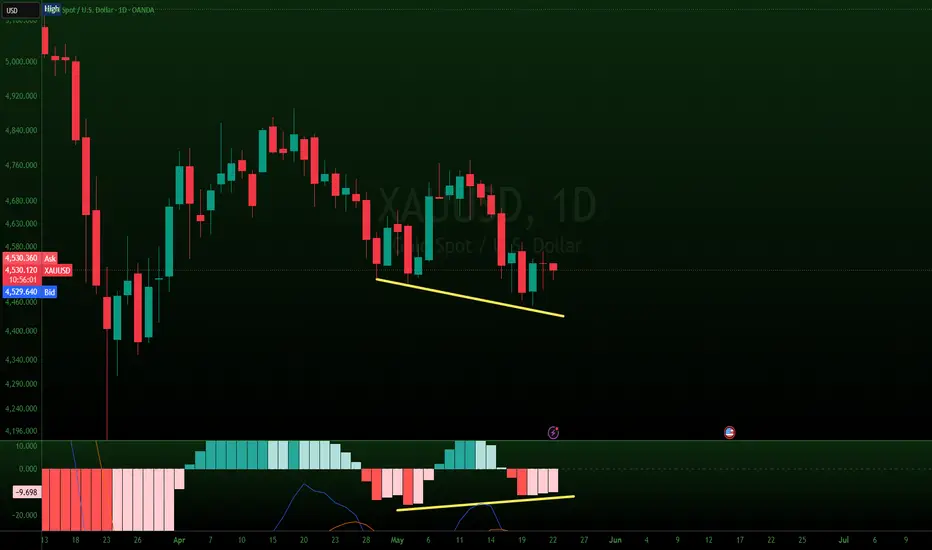
The key question is whether price stabilizes above 207.5 and retests the 220 call wall confluence — or whether the pullback extends into the 200 dual-OI cluster . Gold – Feeling the Strain of Higher Inflation ExpectationsDespite headlines to the contrary at varying times over the last month, the US and Iran have currently failed to reach a draft peace agreement. This has kept the Strait of Hormuz closed to crucial energy shipments from the Middle East region for 13 weeks, which has ensured oil prices remain at elevated levels, far beyond what was envisioned when the conflict started in late February.
This situation has helped to fuel a rising belief amongst investors that global central banks led by the Federal Reserve could be forced to keep interest rates higher for a longer period to contain surging energy costs that are only just starting to feed into higher consumer prices. The current evolving inflation/interest rate environment contrasts dramatically to the start of 2026 when inflation was seen as largely contained and 3 interest rate cuts were expected from the Fed across the year.
This shift in the macro backdrop may have been a key reason why the Gold rally from the March 23rd low at 4099, stalled at 4889 in April, and then again at 4774 in mid-May, as higher interest rates can have a negative impact on Gold and other precious metals that do not bear interest or pay a dividend.
Now, with both sides exchanging missile strikes this week, threatening the fragile ceasefire that has been in place since the Middle of April, Gold prices have dropped over 4.5% from a high of 4580 on Tuesday down to a low of 4366 earlier this morning, before recovering slightly back to current levels around 4383 (0700 BST).
Looking forward, traders may be waiting for the next series of updates on the status of peace discussions, but they could also be preparing for the latest US PCE Index release, which is due later today at 1330 BST. This is the Fed’s preferred gauge of inflation and could shape decision making amongst policymakers regarding future interest rate moves, starting with next month’s announcement on June 17th.
Technical Update: Can the Latest Downside Extend Further?
Shifting sentiment has seen selling pressure increase for Gold, culminating in a fall from the April 17th high at 4889 to this morning’s low at 4366 (as of 0700 BST), a decline of over 10.5%. With this latest fall marking the lowest trade since March 26th, 2026, certain traders may argue that a pattern of lower highs and lower lows could now be in place, a structure often associated with a downtrend.
While this type of pattern does not guarantee that more price weakness may follow, being aware of key support and resistance levels can help to highlight important points from which the next directional move could materialise.
Potential Support Focus:
The latest decline has seen Gold prices fall below 4391, which is the 61.8% Fibonacci retracement of the March 23rd to April 17th rally. This level may need to be watched closely on a closing basis today, as confirmed breaks lower could open the door to further downside.
As the chart above shows, if 4391 does give way on a closing basis, risks might shift toward tests of support at 4306, which is the March 24th low. Should that level also be broken, focus could then move to 4099, which is the March 23rd low, and could represent a deeper support area.
Potential Resistance Focus:
Upside recovery attempts remain a possibility, but for these to develop, Gold prices may need to achieve a closing break back above the first potential resistance at 4474, which is equal to half this week’s current range. A close above this level could open the way for moves to 4531(38.2% of the May sell-off range), then 4583, the current level of the falling Bollinger mid‑average.
If prices were to close above the 4531/4583 resistance zone, it could open scope toward 4618 (61.8% retracement), and if this were to also give way, it might then lead to tests of 4774 which is the May 12th high.
The material provided here has not been prepared accordance with legal requirements designed to promote the independence of investment research and as such is considered to be a marketing communication. Whilst it is not subject to any prohibition on dealing ahead of the dissemination of investment research, we will not seek to take any advantage before providing it to our clients.
Pepperstone doesn’t represent that the material provided here is accurate, current or complete, and therefore shouldn’t be relied upon as such. The information, whether from a third party or not, isn’t to be considered as a recommendation; or an offer to buy or sell; or the solicitation of an offer to buy or sell any security, financial product or instrument; or to participate in any particular trading strategy. It does not take into account readers’ financial situation or investment objectives. We advise any readers of this content to seek their own advice. Without the approval of Pepperstone, reproduction or redistribution of this information isn’t permitted.
Short