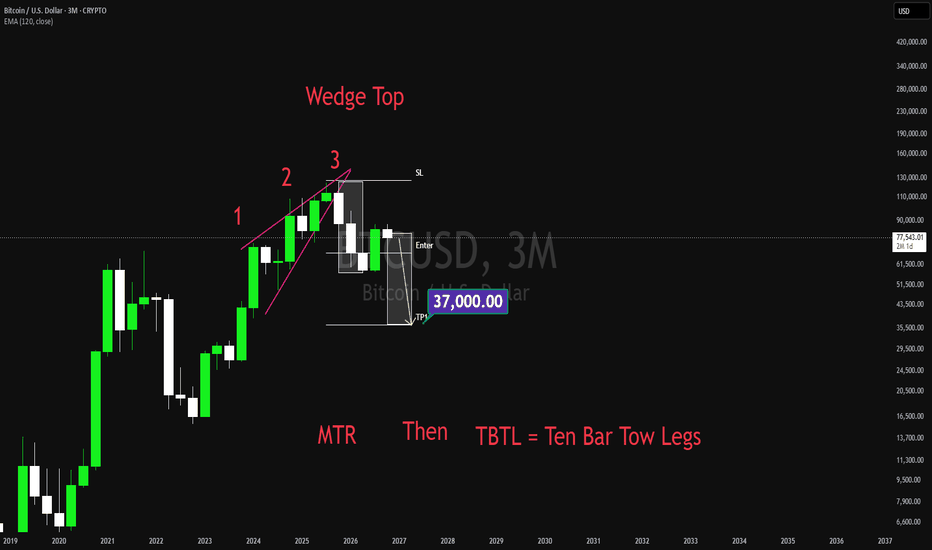
Wedge
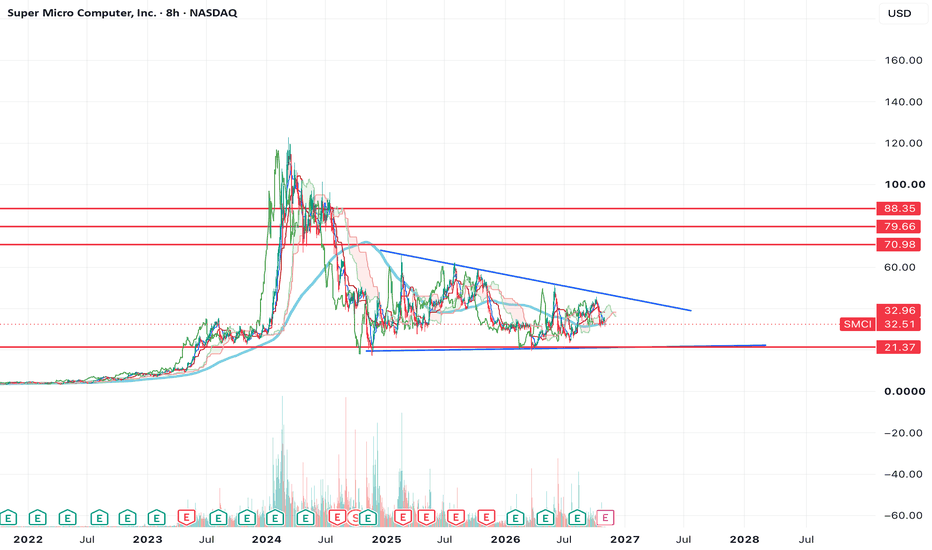
$SMCI positive earnings play?Honestly the SMCI chart isn't as clear as some of the others, but I lean towards seeing a positive move before it gets back to the $21 resistance.
You can see that some of the overhead resistance levels haven't been tested yet, and I think that those likely get tested before we see more downside. You can also see that we've broken below the 200DMA, broke back above it and are now retesting it as support.
If we get a positive reaction to earnings, I think the $70-80 target is the most likely ou
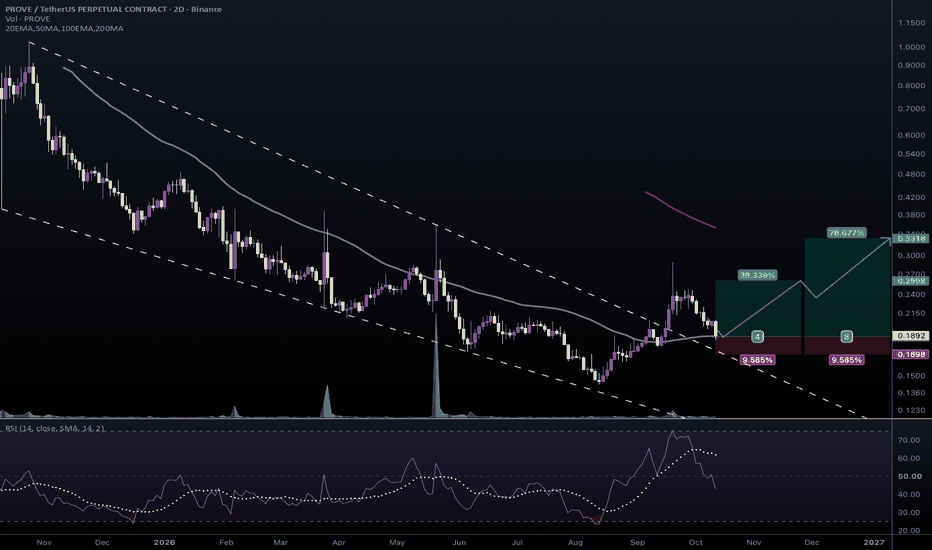
#PROVEUSDT #2D (Binance) Falling wedge break and retest [LONG]PROVE (a.k.a. Succinct) is pulling back to 50MA support, matching Fib 0.618.
A bounce followed by a rally towards 200MA resistance seems likely.
⚡️⚡️ #PROVE/USDT ⚡️⚡️
Exchanges: Binance Futures, Bitget Futures
Signal Type: Regular (LONG)
Leverage: Isolated (4.0X)
Amount: 5.2%
Entry Targets:
1) 0.1878 - 100.0%
Take-Profit Targets:
1) 0.2598 - 50.0%
2) 0.3318 - 50.0%
Stop Targets:
1) 0.1698 - 100.0%
Trailing Configuration:
Stop: Breakeven -
Trigger: Target (1)
Published By: @TradingOn
CRYP
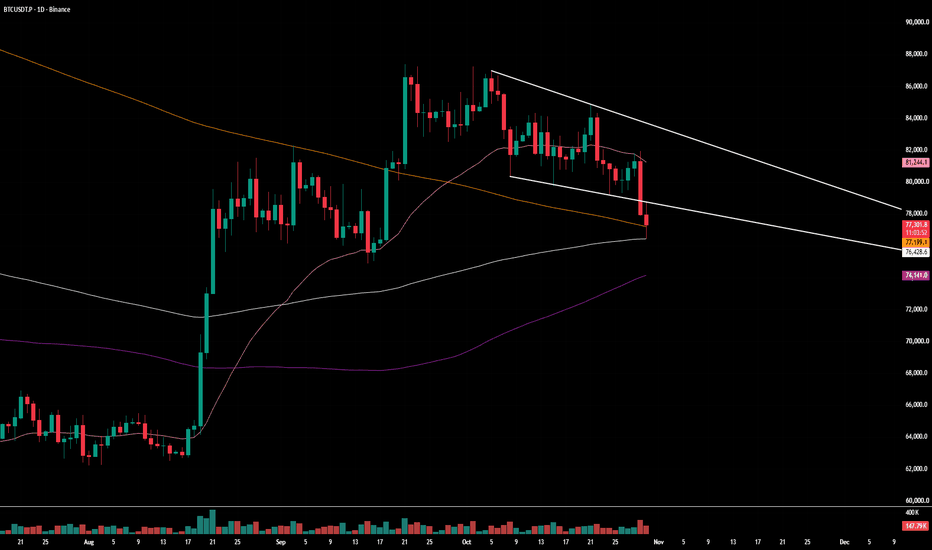
Bitcoin Reached $77K as Predicted — Here's What Must Happen NextYesterday, I identified $77K as a key level Bitcoin might need to test before its next major rally.
As shown in the chart above, Bitcoin has now tested that region and is currently trading back above $77K.
But reaching the target was only the first step.
What happens next is far more important.
1. Understanding Bitcoin's Current Structure
In my approach, market structures can generally be classified into four categories:
Waves
Convergences
Ranges
Channels
Among these st
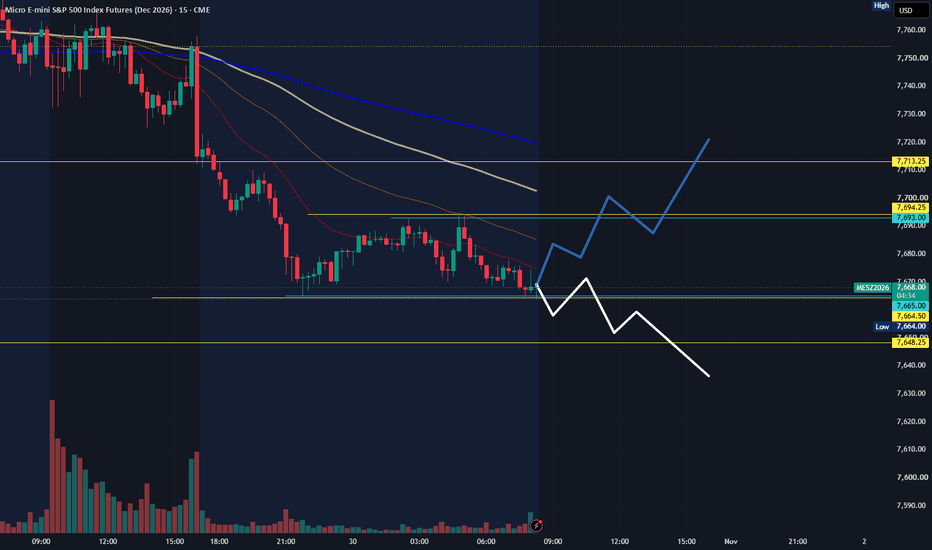
MESZ Oct 30: Breakdown Below 7664 or Reclaim 7694 Toward 7713?MESZ is trading around 7,668 after a significant sell-off, with the short-term structure currently leaning bearish.
The first downside confirmation level I’m watching is around 7,664–7,665.
A confirmed 1-hour or 4-hour close below this area could support continuation toward the next major downside level around 7,648.
However, price is already trading near recent liquidity, so I do not want to chase the downside without confirmation.
On the upside, 7,694 is the main reclaim level.
A confirme
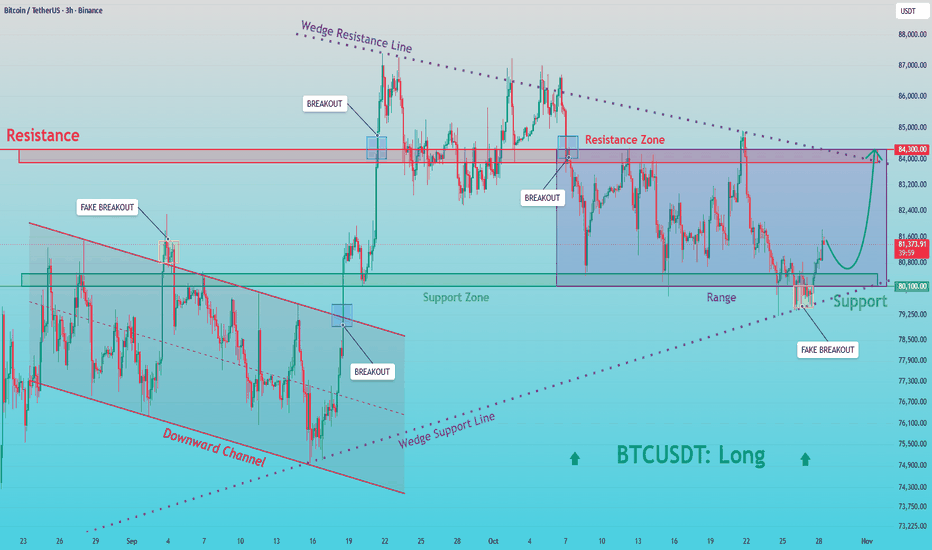
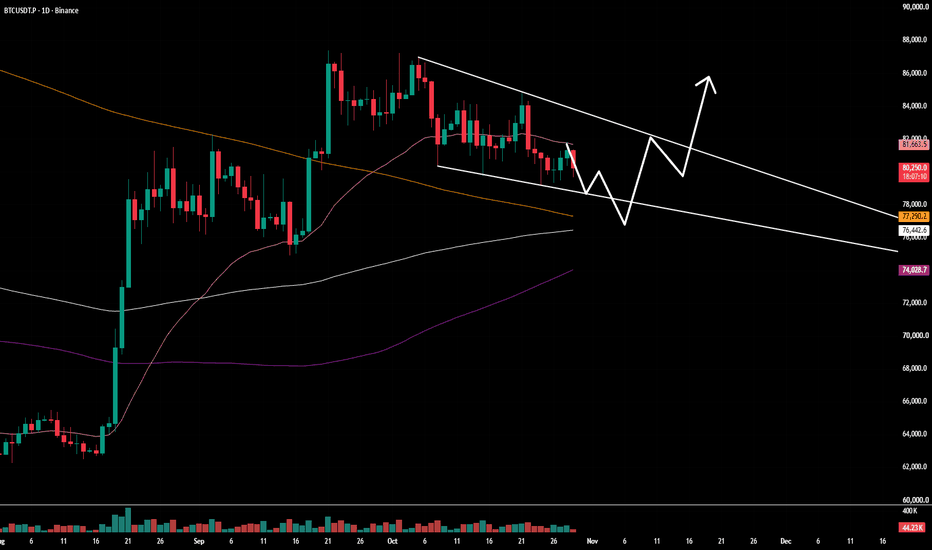
BTCUSDT: Went Below the Line — Then the Market Changed Its MindHello everyone, here is my breakdown of the current BTCUSDT setup.
Market Analysis
BTCUSDT previously traded inside a downward channel and wedge structure before entering a range. Price then tested the Support Zone near 80,100 with a fake breakout and rebounded, showing signs of buyers defending support.
Currently, BTCUSDT is trading below the 84,300 Resistance Zone while holding above the 80,100 Support Zone. The recent rebound from support suggests buyers may attempt another move higher.
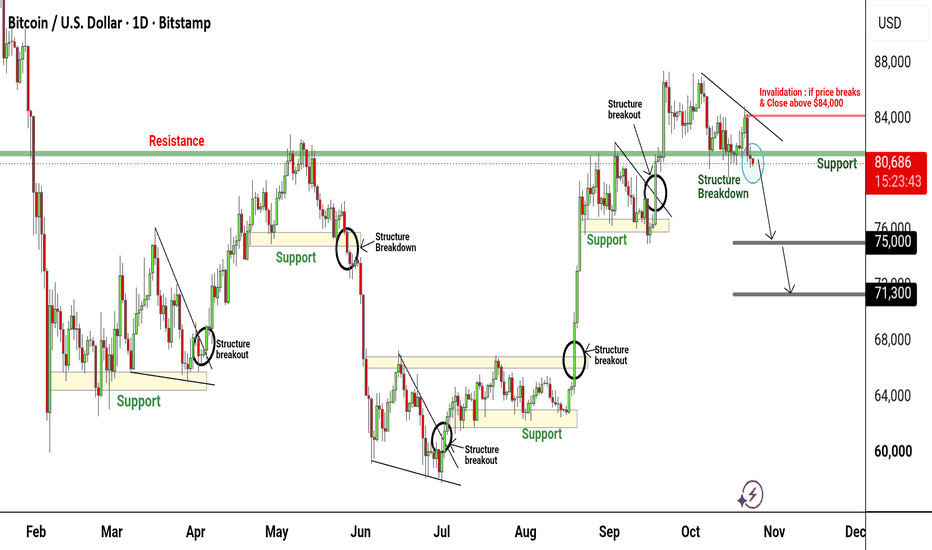
BTCUSD Bearish Structure Breakdown & CorrectionExecutive Summary
Bitcoin (BTCUSD) is currently trading around $80,702 on the daily timeframe, exhibiting a critical market structure breakdown following a failed test of the major $84,000 resistance zone. The core thesis favors a continuation of the corrective pullback toward key lower support liquidity targets near $75,000 and potentially $71,300, presenting a potential downside move of approximately 7.1% to 11.7% from current levels.
Key Technical Confluence:
Market Structure Breakdown:
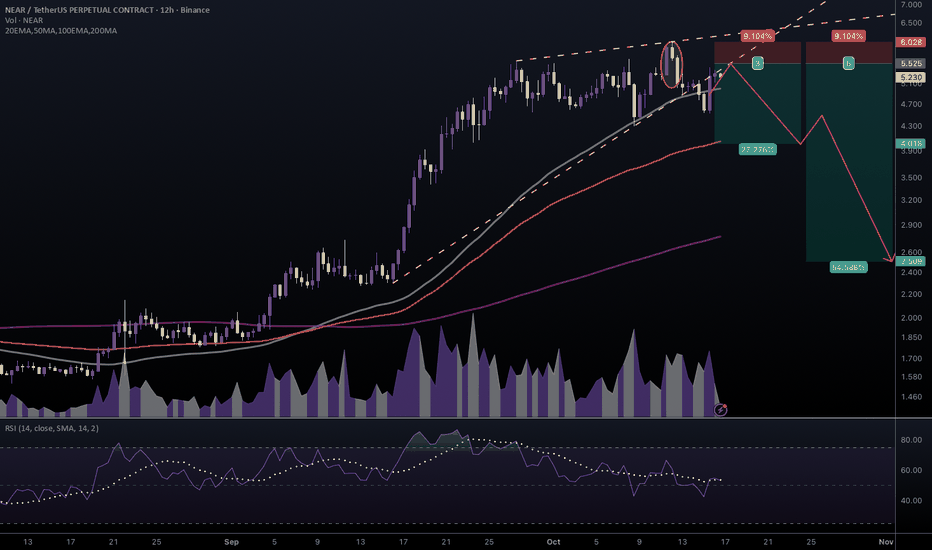
#NEARUSDT #12h (Binance) Rising wedge breakdown [SHORT]NEAR Protocol printed an evening star and a bearish divergence on the RSI.
Seems likely to retrace down to 200MA support if gets rejected here again.
⚡️⚡️ #NEAR/USDT ⚡️⚡️
Exchanges: Binance Futures, Bitget Futures
Signal Type: Regular (SHORT)
Leverage: Isolated (4.0X)
Amount: 5.5%
Entry Targets:
1) 5.525 - 100.0%
Take-Profit Targets:
1) 4.018 - 50.0%
2) 2.509 - 50.0%
Stop Targets:
1) 6.028 - 100.0%
Trailing Configuration:
Stop: Breakeven -
Trigger: Target (1)
Published By: @Zblaba
CRYPTO
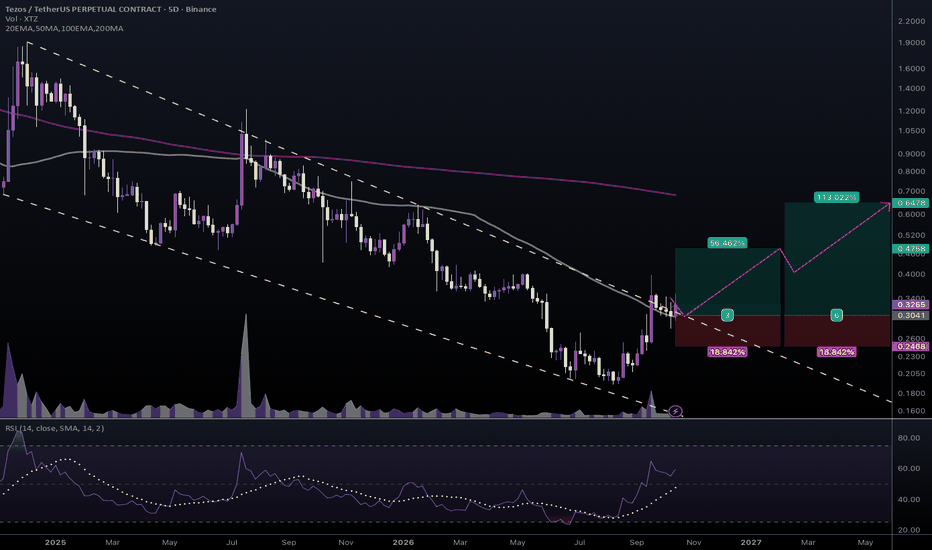
#XTZUSDT #5D (Binance) Falling wedge breakout [LONG]Tezos bounced back on 50MA regained support, looks good for mid-term recovery towards 200MA resistance.
⚡️⚡️ #XTZ/USDT ⚡️⚡️
Exchanges: Binance Futures, Bitget Futures
Signal Type: Regular (LONG)
Leverage: Isolated (2.0X)
Amount: 5.3%
Entry Targets:
1) 0.3041 - 100.0%
Take-Profit Targets:
1) 0.4758 - 50.0%
2) 0.6478 - 50.0%
Stop Targets:
1) 0.2468 - 100.0%
Trailing Configuration:
Stop: Breakeven -
Trigger: Target (1)
Published By: @Zblaba
CRYPTOCAP:XTZ BINANCE:XTZUSDT.P #5D #Tezos #L1
#1000SHIBUSDT #3D (Binance) Falling wedge break & retest [LONG]SHIB (Shiba Inu) regained 50MA support and is pulling back to it, looks ready for mid-term recovery towards 200MA resistance.
⚡️⚡️ #1000SHIB/USDT ⚡️⚡️
Exchanges: Binance Futures
Signal Type: Regular (LONG)
Leverage: Isolated (3.0X)
Amount: 5.7%
Entry Targets:
1) 0.005104 - 100.0%
Take-Profit Targets:
1) 0.006878 - 50.0%
2) 0.008654 - 50.0%
Stop Targets:
1) 0.004512 - 100.0%
Trailing Configuration:
Stop: Breakeven -
Trigger: Target (1)
Published By: @TradingOn
CRYPTOCAP:SHIB OKX:SHIBUSD
1Long
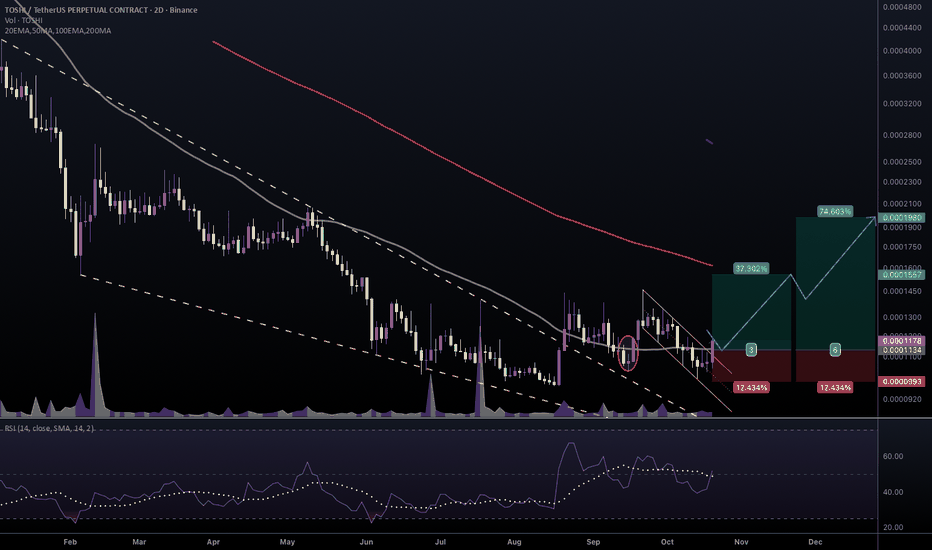
#TOSHIUSDT #2D (Binance) Big falling wedge break & retest [LONG]TOSHI (Toshi The Cat) first printed a morning star then broke-out of the descending channel, looks bullish mid-term.
Now 50MA support is about to be regained, road towards 100EMA resistance seems next.
⚡️⚡️ #TOSHI/USDT ⚡️⚡️
Exchanges: Binance Futures, Bitget Futures
Signal Type: Regular (LONG)
Leverage: Isolated (3.0X)
Amount: 5.4%
Entry Targets:
1) 0.0001134 - 100.0%
Take-Profit Targets:
1) 0.0001557 - 50.0%
2) 0.0001980 - 50.0%
Stop Targets:
1) 0.0000993 - 100.0%
Trailing Configuration:
S
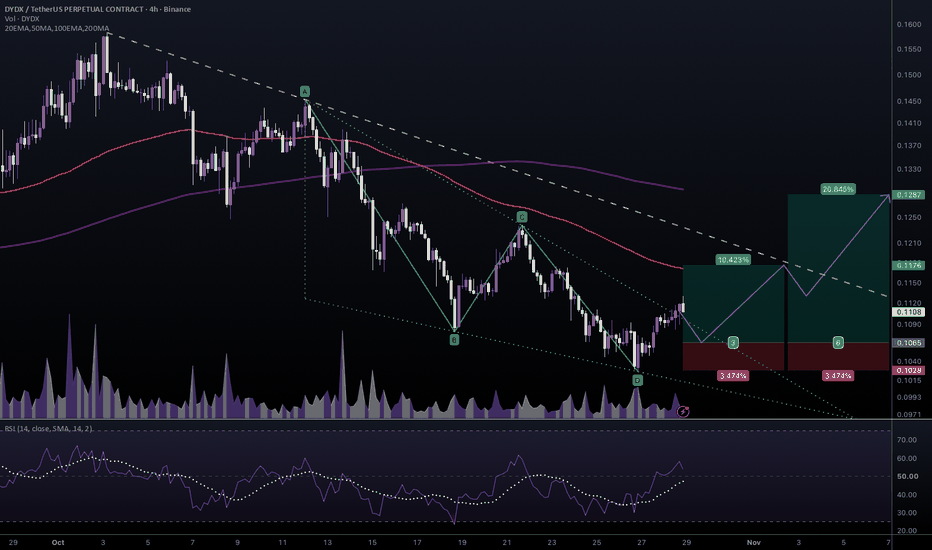
#DYDXUSDT #4h (Binance) Falling wedge breakout [LONG]DYDX (dYdX) broke bullish locally and is now pulling back, targeting 100EMA then 200MA looks legit.
⚡️⚡️ #DYDX/USDT ⚡️⚡️
Exchanges: Binance Futures, Bitget Futures
Signal Type: Regular (LONG)
Leverage: Isolated (11.0X)
Amount: 5.2%
Entry Targets:
1) 0.1065 - 100.0%
Take-Profit Targets:
1) 0.1176 - 50.0%
2) 0.1287 - 50.0%
Stop Targets:
1) 0.1028 - 100.0%
Trailing Configuration:
Stop: Breakeven -
Trigger: Target (1)
Published By: @TradingOn
CRYPTOCAP:DYDX BINANCE:DYDXUSDT.P #4h #dYdX #D
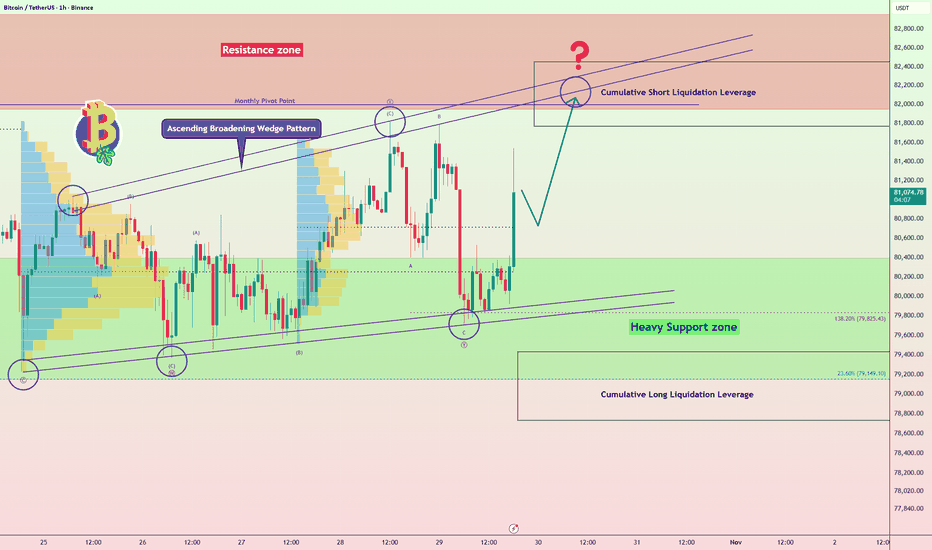
Bitcoin Rebounds Ahead of $11B Options Expiry — Is $82K Next?Bitcoin started moving higher before reaching the Heavy Support Zone($79,150-$80,400), reacting from an area near the key trading level of $81,250.
The short-term recovery is gaining momentum, but tomorrow’s major Bitcoin options expiry could significantly increase volatility.
Can Bitcoin extend this move toward $82,000, or will sellers regain control?
Macro Outlook
More than $11 billion in Bitcoin options are scheduled to expire on October 30, which could increase volatility as traders adju
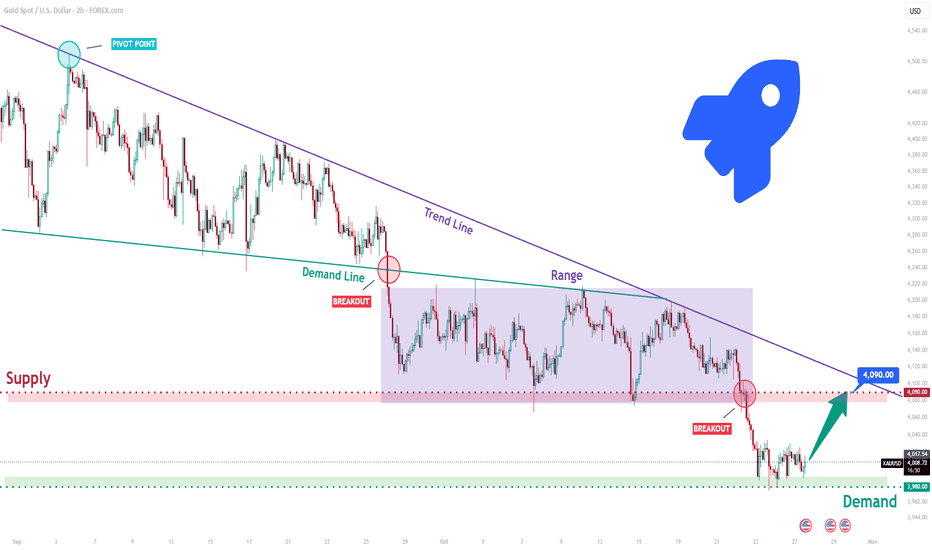
XAUUSD Long: A Shift From Trend Pressure to Range-Based TradingHello traders! Here’s my technical outlook based on the current XAUUSD (2H) chart structure. XAUUSD previously declined under the Trend Line and formed a range near the Demand Zone. Price then bounced from the 3,980 Demand Zone, showing signs of buyers stepping in.
Currently, XAUUSD is trading below the 4,090 Supply Zone while holding above the 3,980 Demand Zone. The recent bounce from support suggests buyers are preparing for another move higher.
As long as XAUUSD remains above 3,980 and resp
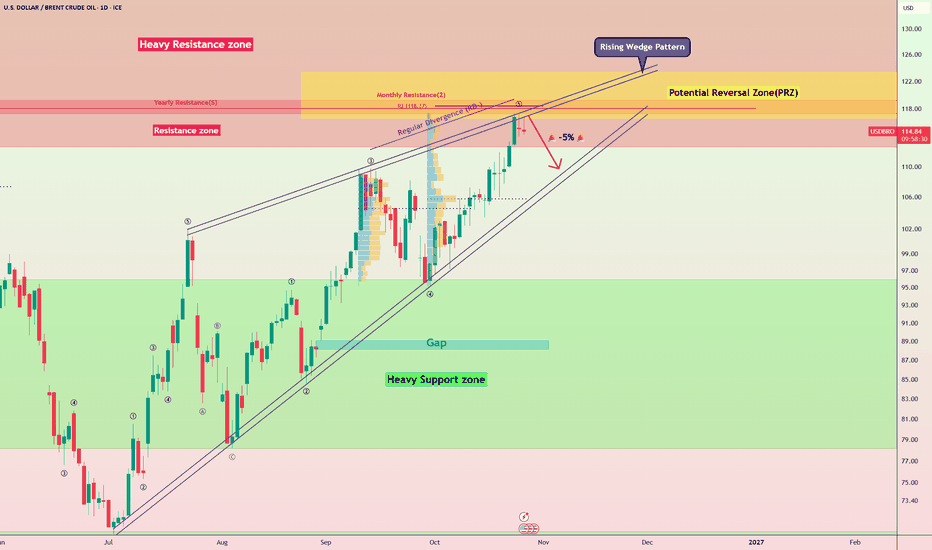
Oil Is Leading Financial Markets — Is a 5% Correction Coming?Oil ( FX_IDC:USDBRO ) has become one of the key drivers of financial markets over the past two weeks as Middle East tensions continue to influence global risk sentiment.
The recent surge in oil contributed to pressure across U.S. equities, gold, silver, Bitcoin , and Ethereum, making oil an important market to monitor even when trading other assets.
Can oil continue above $120, or is a correction toward $110 approaching?
Macro Outlook
The anticipated geopolitical escalation did not material
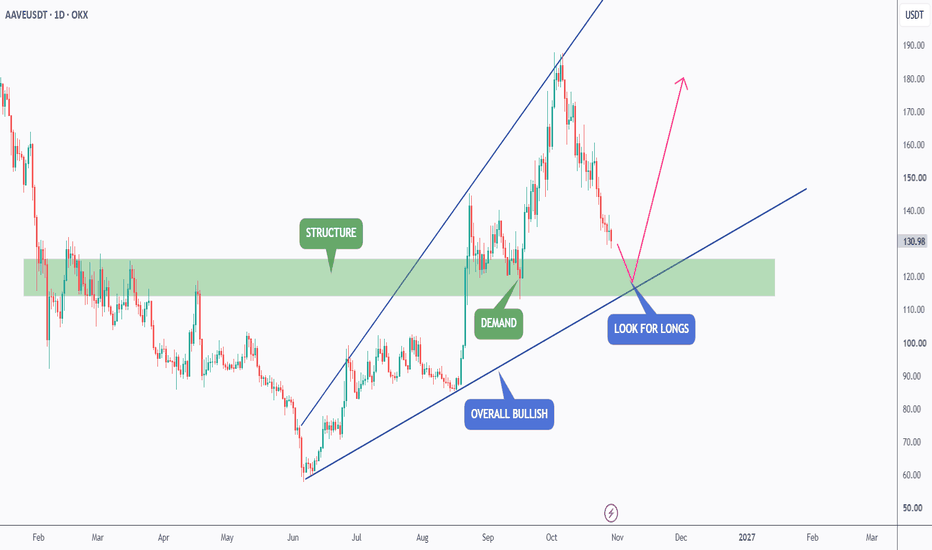
AAVE - Bullish Opportunity at a Strong Intersection?AAVE has been overall bullish, trading within the rising wedge pattern marked in blue, with buyers maintaining control of the broader trend.
However, price is currently undergoing a bearish correction, bringing an important technical area into focus.
📊 Technical Outlook
AAVE is approaching a strong intersection of two technical factors:
🔵 Lower bound of the rising wedge, which has been acting as dynamic support throughout the bullish movement.
🟢 Major demand zone and horizontal structure
What is the Rising Wedge Pattern?What is the Rising Wedge Pattern?
The Rising Wedge is a bearish chart pattern where price continues to make higher highs and higher lows, but the overall range gradually becomes tighter as the two rising trendlines converge.
Although price is moving upward, the structure often shows that bullish momentum is losing strength. A confirmed break below the lower trendline can indicate that sellers are gaining control and a further downside move may follow.
Key Characteristics
Price moves within
Bitcoin Could Drop to $77K Before Its Next Major RallyWhat if Bitcoin's next major rally begins with one final drop?
I believe the market is giving us two different technical structures that point toward a similar bullish scenario.
Let me explain.
1. Understanding the Market Structure
In my approach, most market structures can be classified into four categories:
Waves
Convergences
Ranges
Channels
Right now, Bitcoin is showing a combination of wave structure and convergence .
Understanding how these two structures interact is t
EurAud Technical Outlook - WeeklyWhat I see!
EUR/AUD is currently forming a falling wedge on the weekly timeframe. Price is testing the lower boundary, and the wedge has already completed four legs, meaning the next move could be the final leg that determines the eventual breakout direction.
However, the pattern is not confirmed yet.
Entering at the current level could offer a lower R:R, so I’d rather wait for confirmation. If price breaks above the upper trendline, I’ll consider looking for an entry on the retest/retraceme
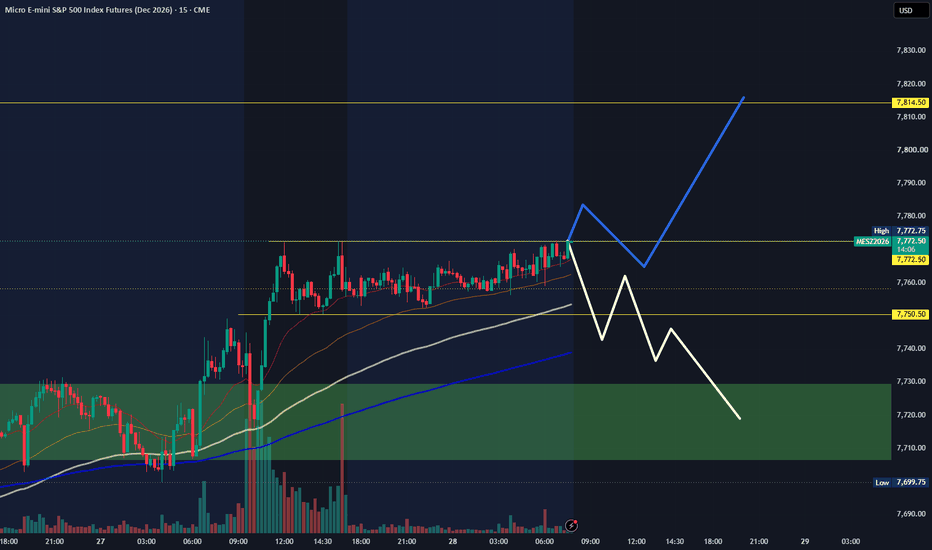
MESZ Oct 28: FOMC Day — Break 7772 Toward 7815 or Lose 7750?MESZ is trading around 7,772 after recovering from the recent lows.
Overnight price has already tested liquidity around 7,772, making this the key short-term upside confirmation level.
A confirmed 1-hour close above 7,772 could support continuation toward the psychological 7,800 level, followed by the higher liquidity area around 7,811–7,815.
On the downside, 7,750 is the main confirmation level. A confirmed break below that area could lead to a deeper retracement into the higher-time-frame o
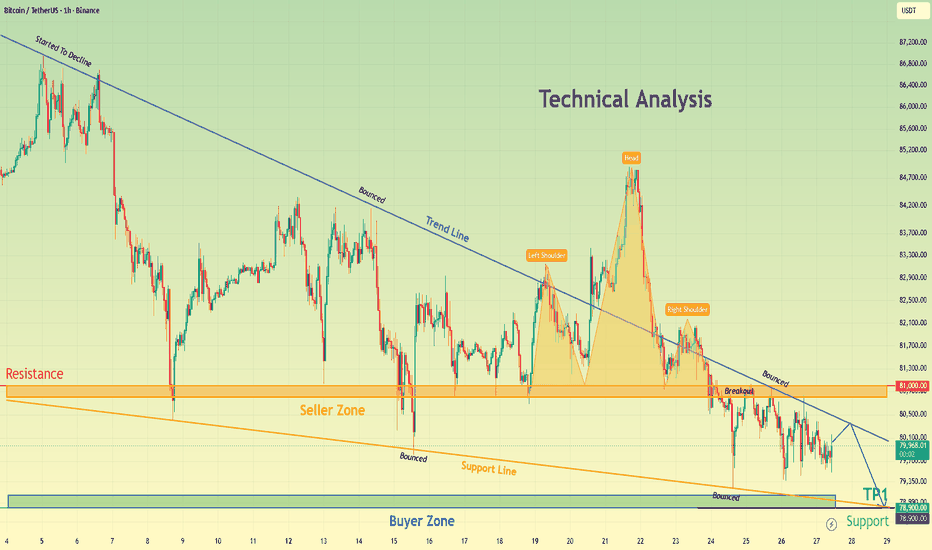
Bitcoin: From Trend-Line Failure to a Potential Support RetestHello traders! Here’s my technical outlook based on the current BTCUSDT (1H) chart structure. BTCUSDT previously started to decline under the Trend Line and formed a clear Head and Shoulders pattern near the Seller Zone. Price then broke lower and tested the Buyer Zone with a bounce.Currently, BTCUSDT is trading below the 81,000 Seller Zone while holding above the 78,900 Buyer Zone. The completed Head and Shoulders and descending structure suggest a possible continuation lower toward support.As