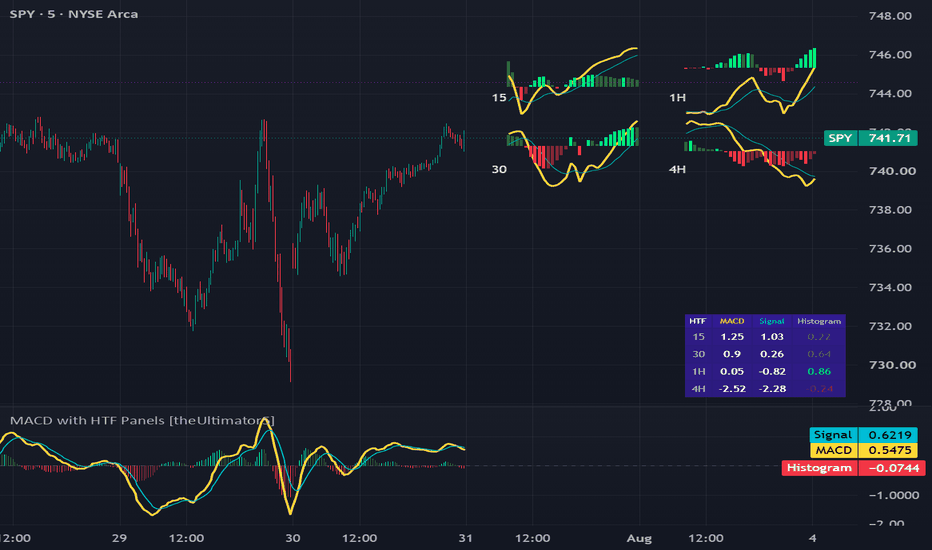
MACD with HTF Panels [theUltimator5]This indicator uses the standard MACD signal and displays it on multiple timeframes off to the side of the chart as separate panels. It allows you to view up to 5 (current + 4) separate timeframes at once without changing the chart timeframe.
The core of this indicator is a normal MACD. Line, signal, and histogram, fully adjustable lengths, four-way histogram coloring based on sign and slope so you can read momentum shifts at a glance.
Alongside it, the indicator draws up to four independen
インジケーター・ストラテジー
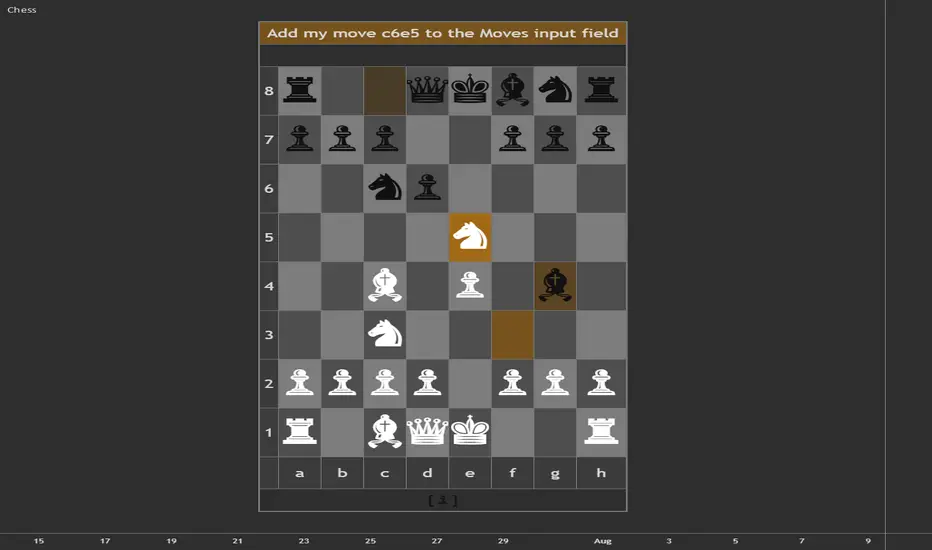
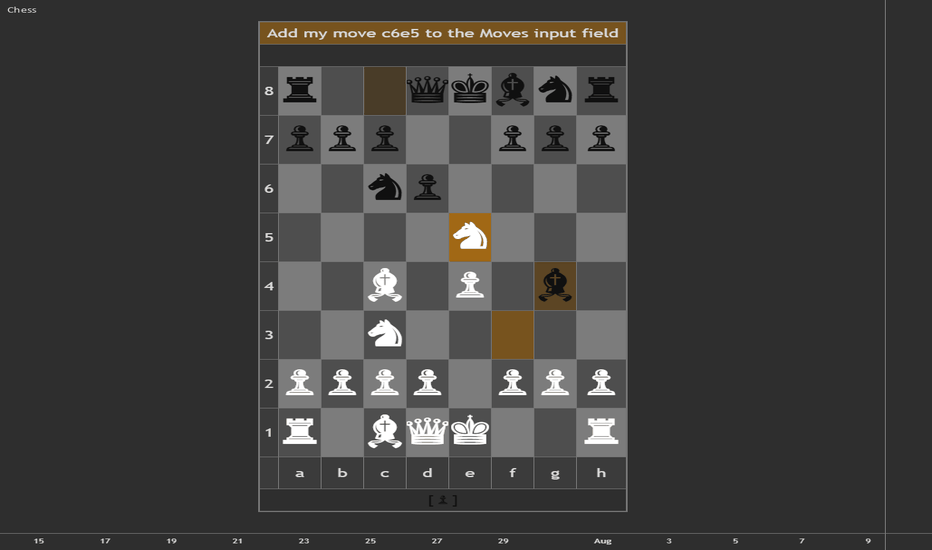
ChessPlay real, full games of Chess against the computer , live on your chart. The first playable chess on TradingView.
🟩 HIGHLIGHTS
⭐ Genuine independent gameplay - infinite different games possible.
⭐ The computer ranked over 1200 at Blitz across 100+ rated games on a popular online chess website.
⭐ Optional trash talk from the computer.
⭐ Play as White or Black, with the board flipped so your pieces sit at the bottom.
⭐ The computer thinks and responds fast.
⭐ Only legal moves are all
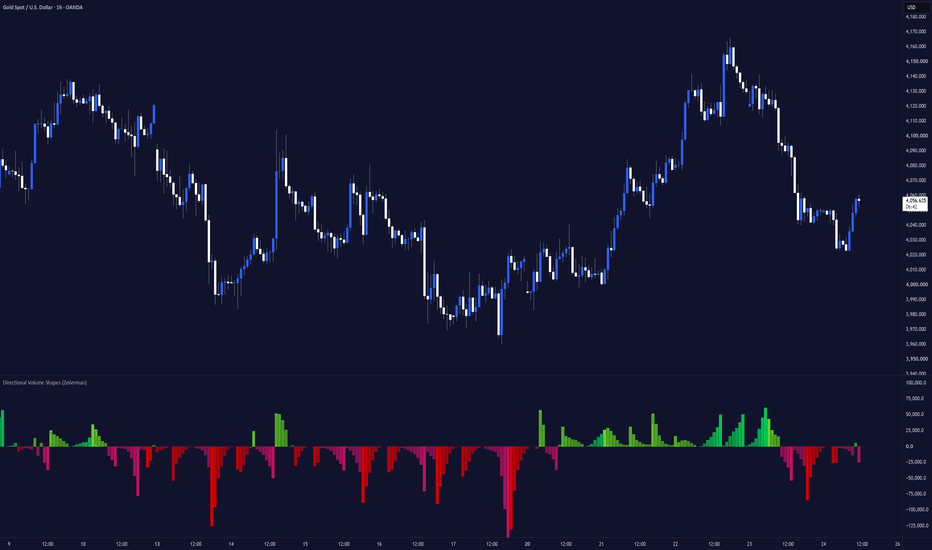
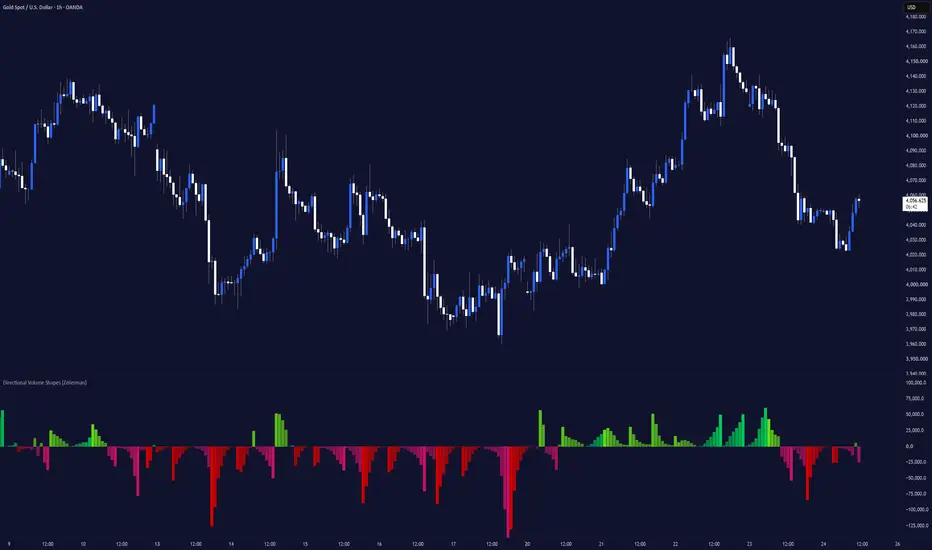
Directional Volume Shapes (Zeiierman)█ Overview
Directional Volume Shapes (Zeiierman) is a regime-classification oscillator that reframes volume analysis around a different question: not simply “how much volume traded,” but “what statistical shape has directional pressure been forming, and which way is it leaning?”
Instead of plotting raw buy and sell volume bar by bar, the indicator scores each candle for directional pressure using a triangular intrabar distribution model. It collects those scores in a rolling window, classif
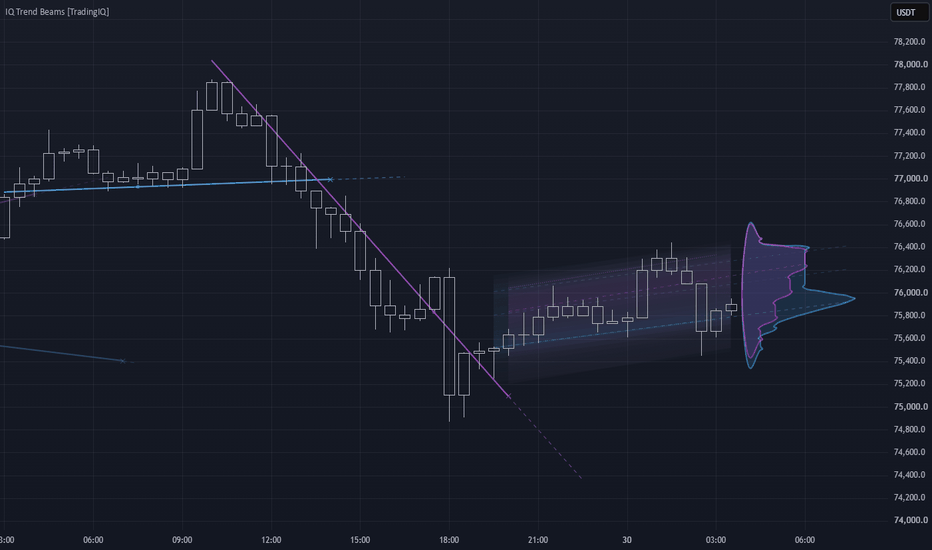
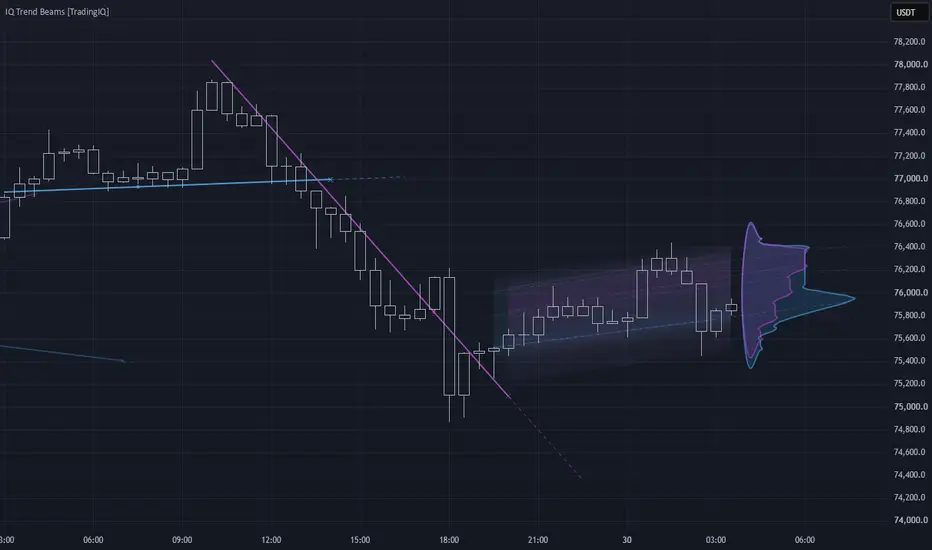
IQ Trend Beams [TradingIQ]🔹 OVERVIEW
IQ Trend Beams is a trend assistant that draws your trendlines the way a disciplined chartist would - and then holds them accountable. It maintains two channels, support and resistance , each always showing one working line. A line is born forming : it moves and re-shapes freely, polished every bar by a perceptual score toward the line a skilled trader would actually draw. When its geometry settles and it has earned enough tangency credit, it locks - and from that moment th
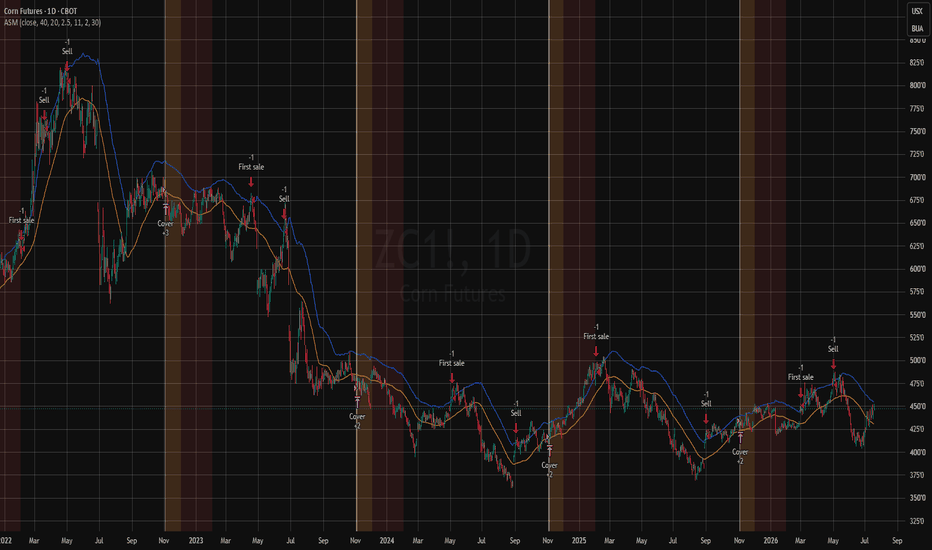
TASC 2026.08 An Ag Selling Model█ OVERVIEW
This strategy implements the "Ag Selling Model" as presented by Perry J. Kaufman in the August 2026 edition of the TASC Traders' Tips "Identifying The Best Price Levels For Selling Commodity Futures". The article describes a long-hold selling strategy for agricultural commodity futures based around the seasonal harvest timing of crops, mainly US grains traded on the CBOT and KCBOT, both which have been acquired by CME.
█ CONCEPTS
This model was originally presented in 1978 by
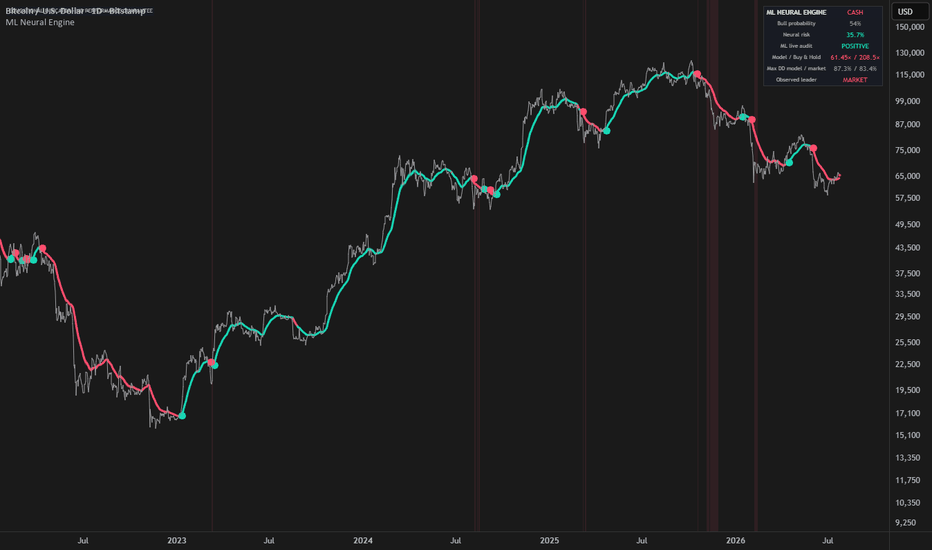
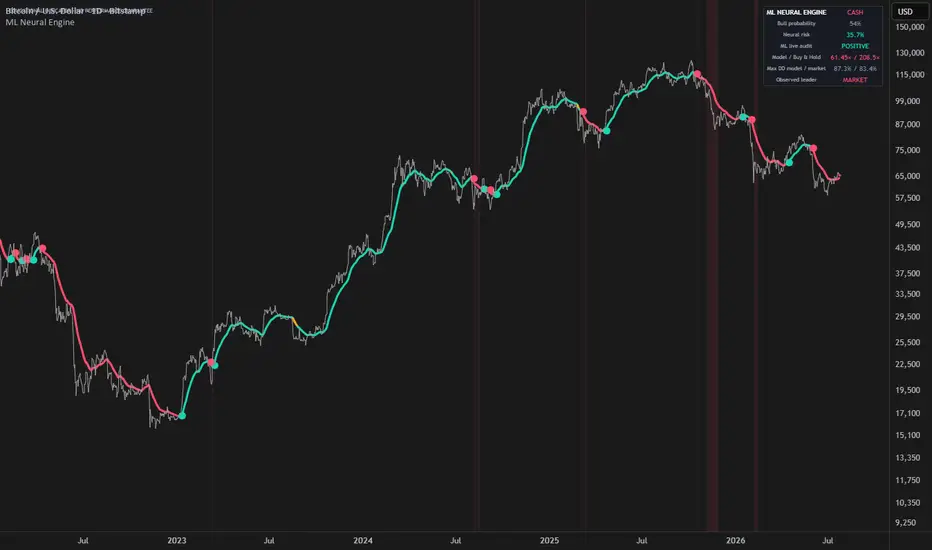
Machine Learning Neural Network EngineMachine Learning Neural Network Engine turns complex Daily market behavior into three clear states: LONG, WATCH and CASH.
Instead of relying on one fixed trend signal, the indicator combines an adaptive neural network, continuous model validation and an independent crisis detector. The result is a simple visual interface backed by a fully causal machine-learning process.
HOW IT WORKS
At its core is a compact 6-5-1 neural network trained directly on the chart.
It analyzes six normalized featu
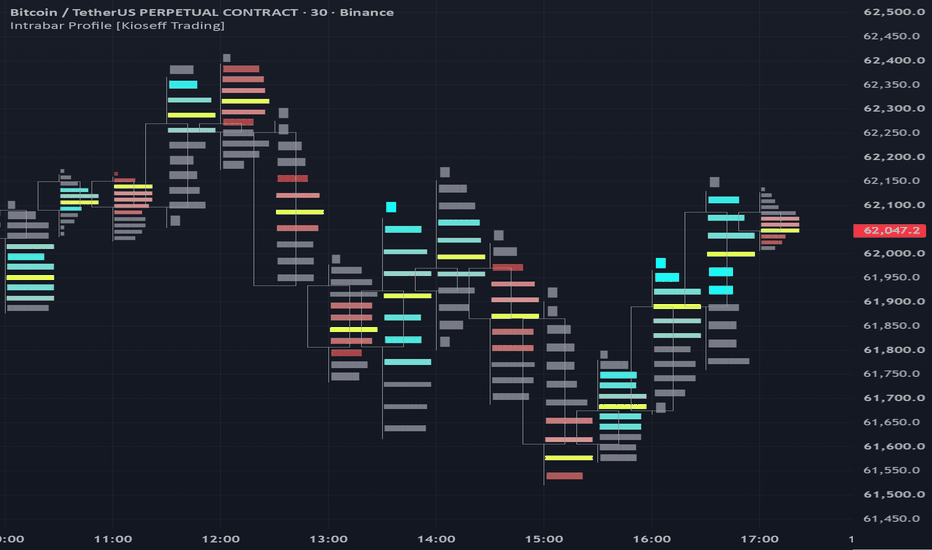
Intrabar Profile [Kioseff Trading]Hello Traders!
🔹 Intrabar Profile
Intrabar Profile is a lower-timeframe profile tool designed to draw a volume profile or delta profile on each individual candle .
Instead of only looking at where a candle opened, closed, wicked, or changed color, this indicator attempts to show:
Where did volume actually trade inside the bar?
It focuses on answering a deeper question:
What happened inside the candle that normal candlesticks do not show?
volume profile on every visible bar
de
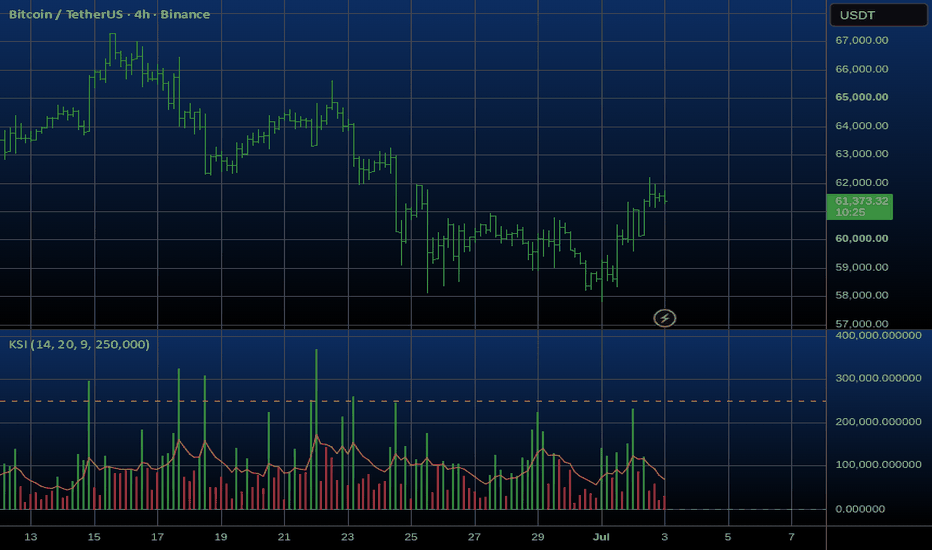
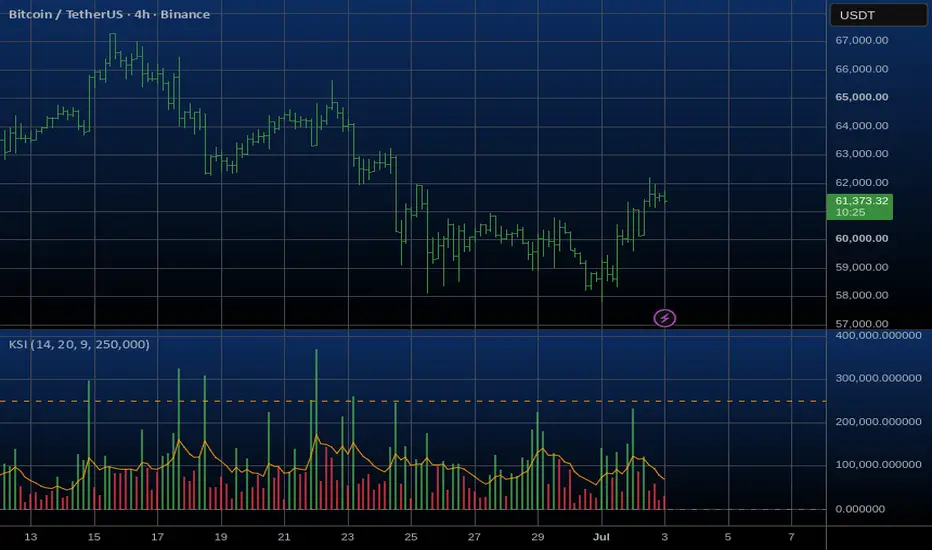
Kinetic Slippage Index (KSI)Overview
The Kinetic Slippage Index (KSI) is an advanced volume-volatility oscillator designed to measure market efficiency—or the lack thereof. Inspired by order book microstructure and liquidity gaps, KSI calculates the "cost of price movement." It helps traders identify hidden institutional distribution, retail exhaustion, and high-probability false breakouts.
Unlike standard momentum oscillators (RSI, Stochastic) that only track price speed, KSI analyzes how much raw volume was required
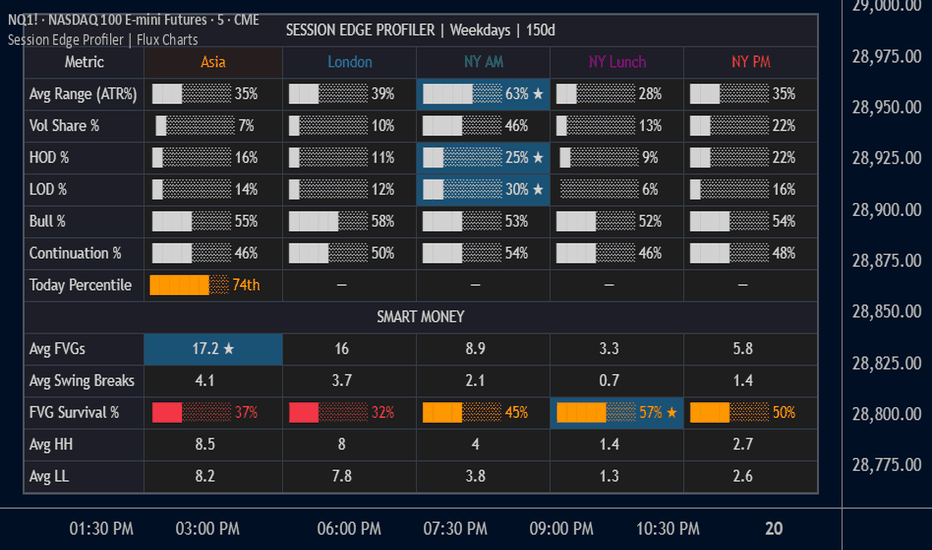
Session Edge Profiler | Flux ChartsGENERAL OVERVIEW:
The Session Edge Profiler is a statistical dashboard indicator that profiles up to five configurable trading sessions (Asia, London, NY AM, NY Lunch, NY PM by default) across the available completed trading days loaded on the chart. The indicator records each session's range, volume, directional outcome, and smart money structure (Fair Value Gaps, swing breaks, higher highs, lower lows) on every completed day, then surfaces the resulting statistics in a configurable on-chart d
Supertrend Parameter Sensitivity 3D [LuxAlgo]The Supertrend Parameter Sensitivity 3D indicator is a powerful optimization tool that executes 100 simultaneous Supertrend backtests bar-by-bar to visualize how different ATR Lengths and Multipliers impact performance across various metrics.
By projecting this data onto a 3D surface and a heatmap dashboard, it allows traders to identify "stable" parameter zones and avoid over-optimized "peaks" that may lead to curve-fitting.
🔶 USAGE
This tool is designed to help traders find the most ro
ExprLibExprLib is a library for parsing and evaluating string expressions. It allows scripts to expose configurable logic by letting users define custom conditions and calculations based on available data.
█ KEY FEATURES
• Rich expression support:
• Built-in constants (e.g., `10`, `2.5`, `5e-2`, `true`, `false`, `na`)
• Custom constants
• Variables
• Arithmetic operators: `+`, `-`, `*`, `/`, `%`
• Comparison operators: `>`, `<`, `>=`, `<=`, `==`, `!=`
• Logical operators:
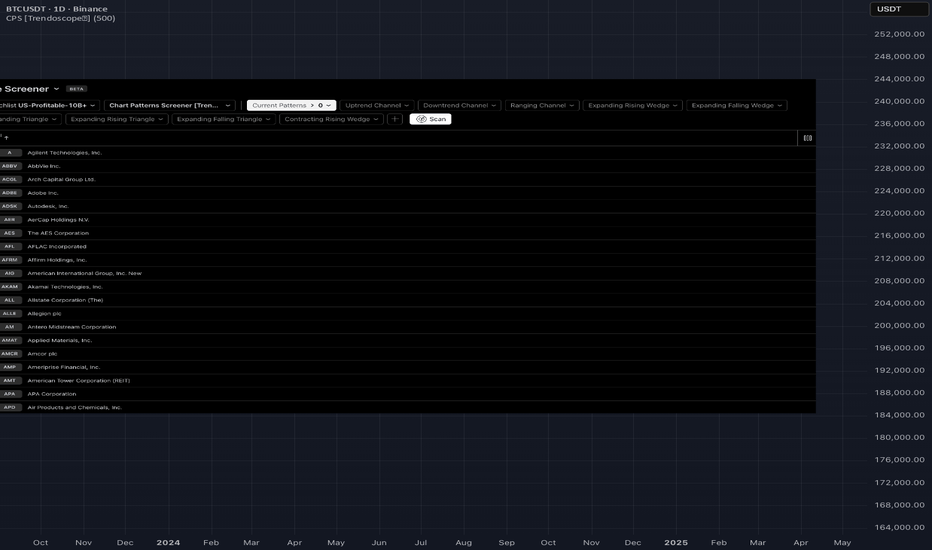
Chart Patterns Screener [Trendoscope]🎲 Overview
Chart Patterns Screener is an advanced Pine Script designed to automatically detect and display classical chart patterns on TradingView. It is a specialized, fine-tuned version of the popular Auto Chart Patterns indicator, optimized specifically for use with the Pine Screener.
🎲 How to Use This Script as Indicator
Since most of the settings are inherited from Auto Chart Patterns, let us first discuss on how to use the indicator before dwelving into the settings.
When you fir
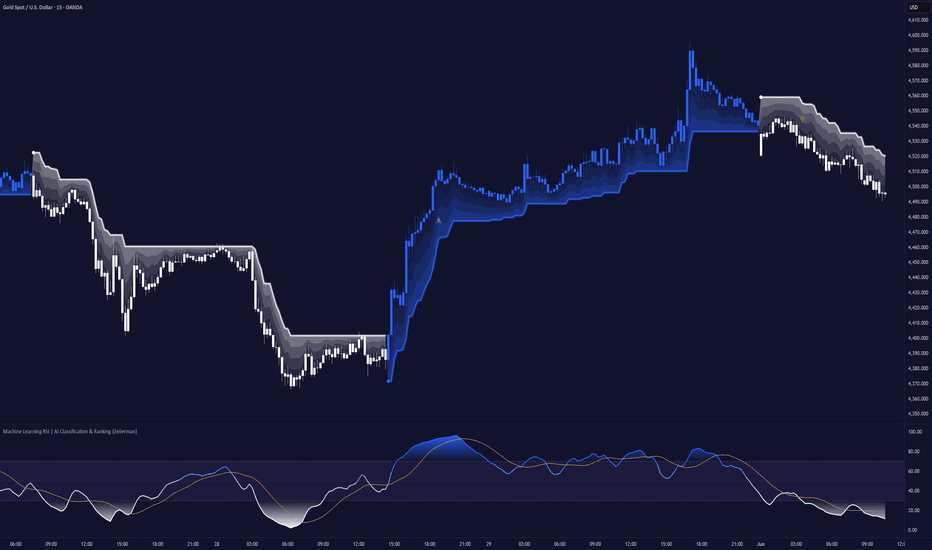
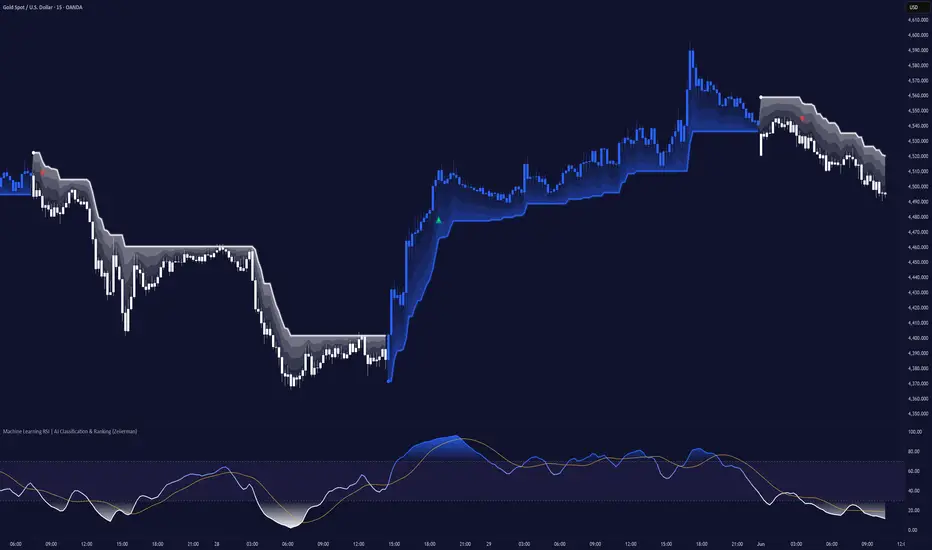
Machine Learning RSI | AI Classification & Ranking (Zeiierman)█ Overview
The Machine Learning RSI | AI Classification & Ranking (Zeiierman) is an adaptive RSI intelligence system that combines momentum analysis, historical analog recognition, machine learning classification, confidence scoring, and dynamic trend management into a single framework.
Rather than interpreting RSI solely through traditional overbought and oversold thresholds, the indicator examines how similar RSI environments have behaved historically and uses those observations to classi
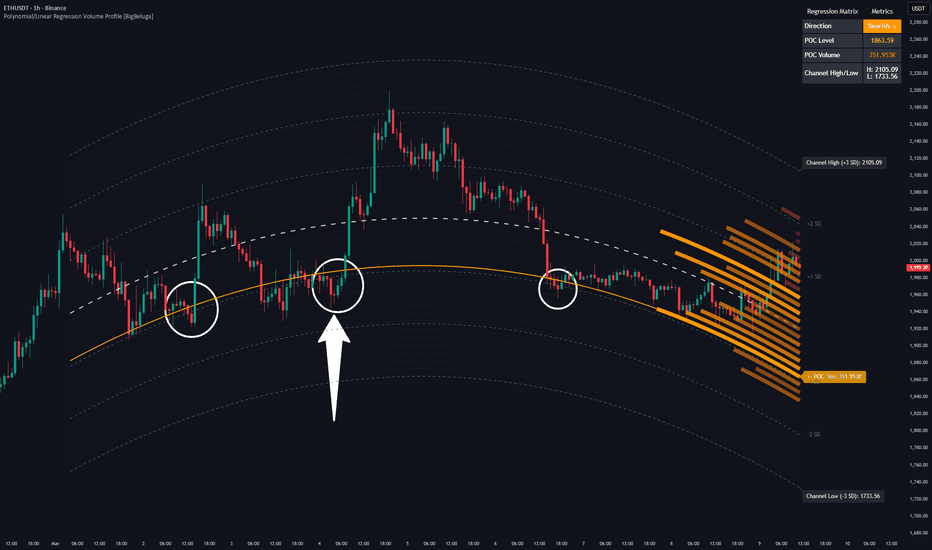
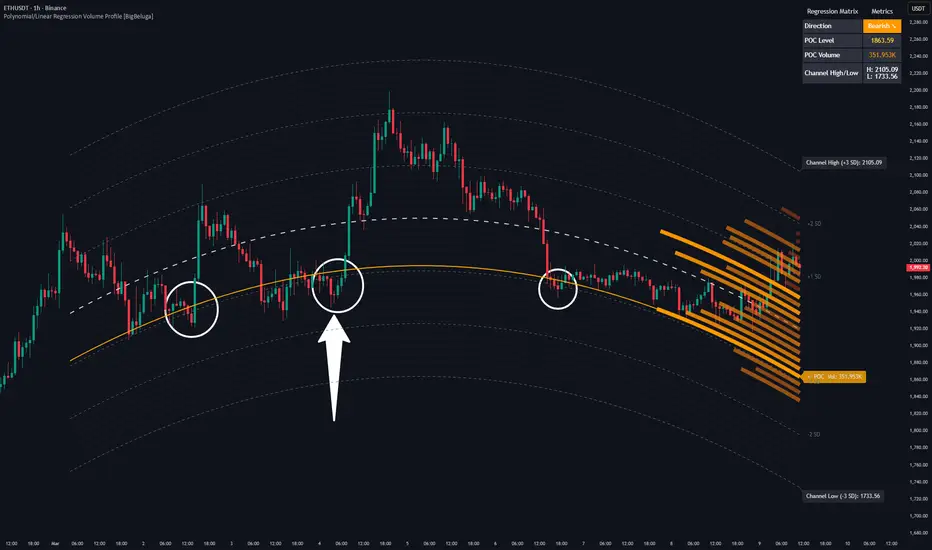
Polynomial/Linear Regression Volume Profile [BigBeluga]Polynomial/Linear Regression Volume Profile is a state-of-the-art charting framework that blends advanced statistical modeling with localized volume distribution analysis. By evolving past traditional, static horizontal volume profiles, this indicator dynamically curves the volume profile matrix around mathematical trend baselines, giving you a hyper-localized view of value zones, support, and resistance across the trend’s lifecycle.
Equipped with a switchable Ordinary Least Squares (OLS) cal
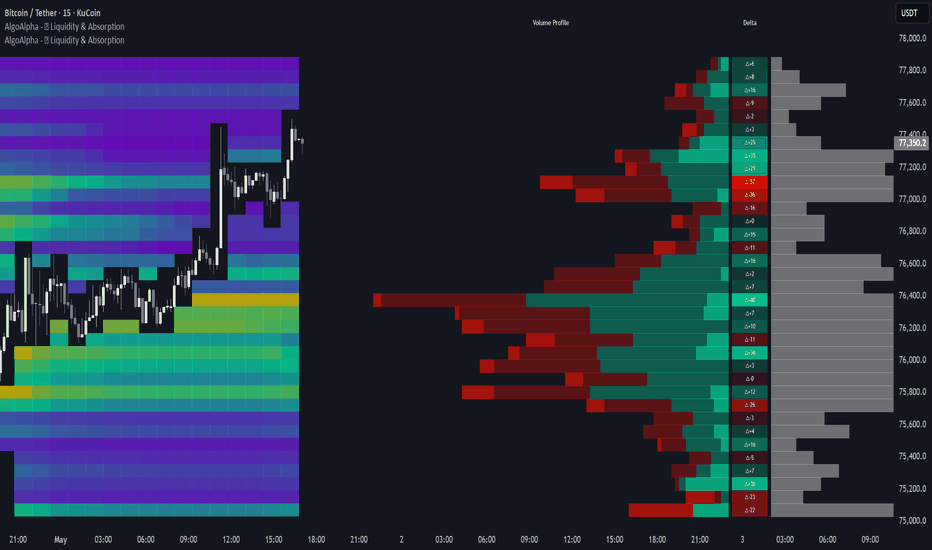
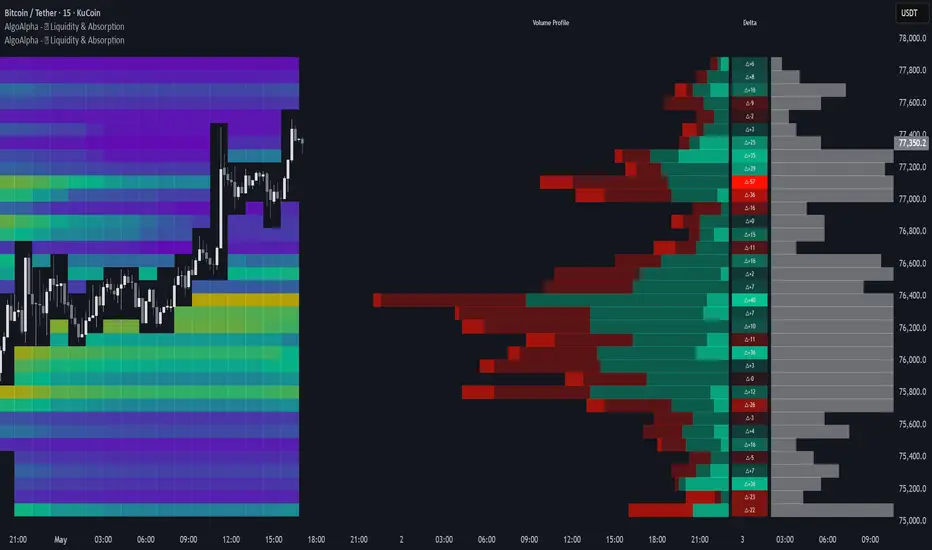
Whale Liquidity and Absorption Profile [AlgoAlpha]🟠 OVERVIEW
The Whale Liquidity and Absorption Profile maps intrabar buying, selling, delta, and absorption activity into stacked horizontal profiles. It samples lower timeframe volume data inside each chart candle, then groups that activity into price bins to show where aggressive participation and absorption occurred across a configurable lookback range.
The script separates strong and weak activity using a percentile-based strength filter. It also builds a delta heatmap, absorption profile,
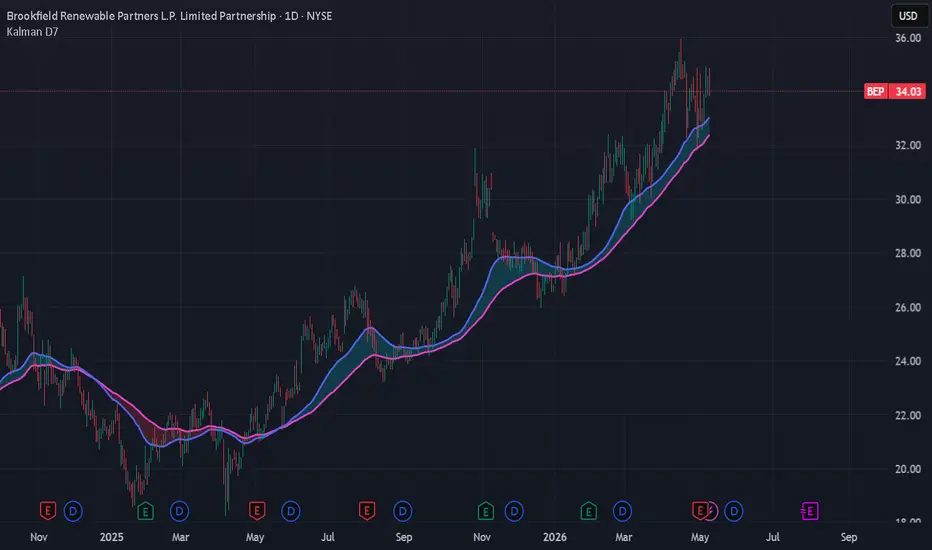
Fractional EMA Kalman Filter [D7]Fractional EMA Kalman Filter
1. Description
Fractional EMA Kalman Filter is an experimental smoothing and state-estimation tool that combines a Kalman filter framework with a fractional EMA input. The objective is to create a filter that remains subdued during ranging conditions while retaining responsiveness when directional structure emerges. By integrating adaptive variance logic and residual-based state control, D7 aims to balance smoothness, reactivity, and structural awareness.
2
Neural Weight Oscillator (Zeiierman)█ Overview
The Neural Weight Oscillator (Zeiierman) is an adaptive multi-factor oscillator that combines structured decision-making with dynamic market learning.
The script analyzes three core market behaviors: Trend, Mean Reversion, and Momentum. Instead of treating these components equally, the oscillator uses the Best-Worst Method (BWM) to determine which market behavior should have the greatest influence under current market conditions.
An adaptive training layer then studies histori
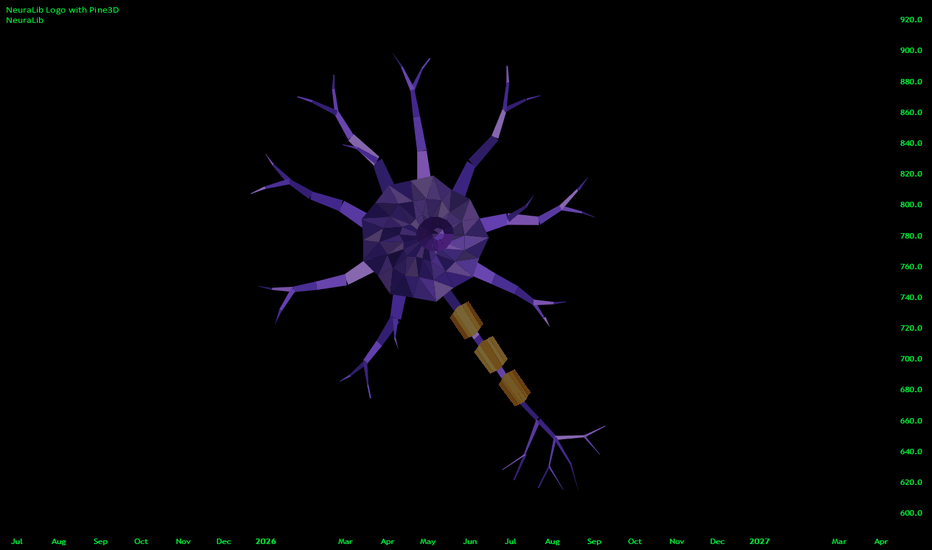
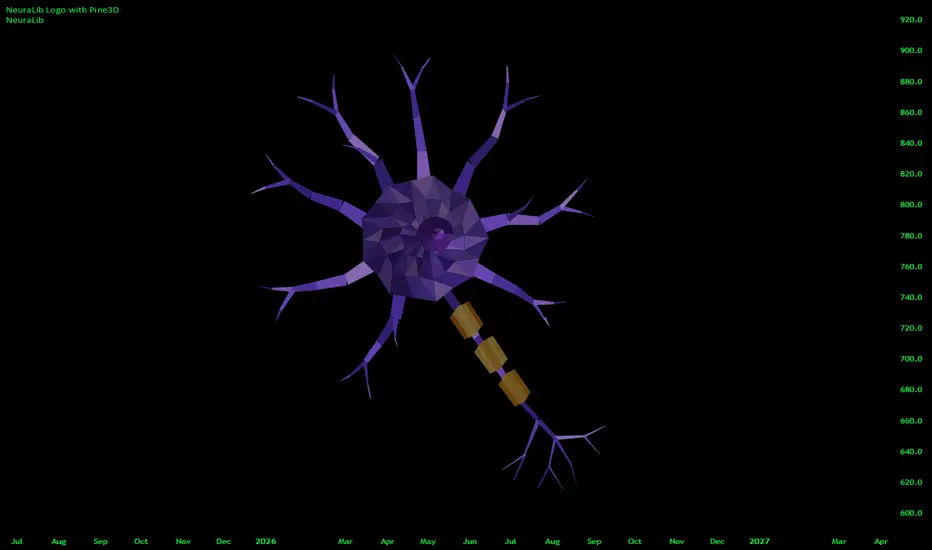
NeuraLib: A Native AI and Deep Learning RuntimeNeuraLib is a tensor-based, auto-differentiating Machine Learning runtime built natively for Pine Script™.
It brings real Deep Learning mechanisms that power modern Artificial Intelligence systems into TradingView. Instead of relying on fixed formulas, static regressions, or rigid structures, NeuraLib gives Pine developers a different tool: a compact neural runtime that can learn from the features you feed it, using the architecture you define.
This means users are no longer limited to classi
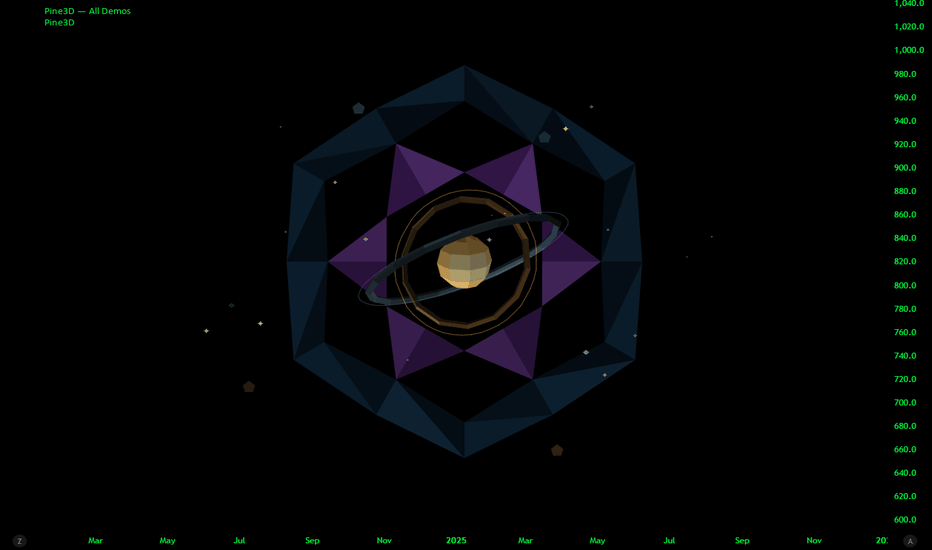
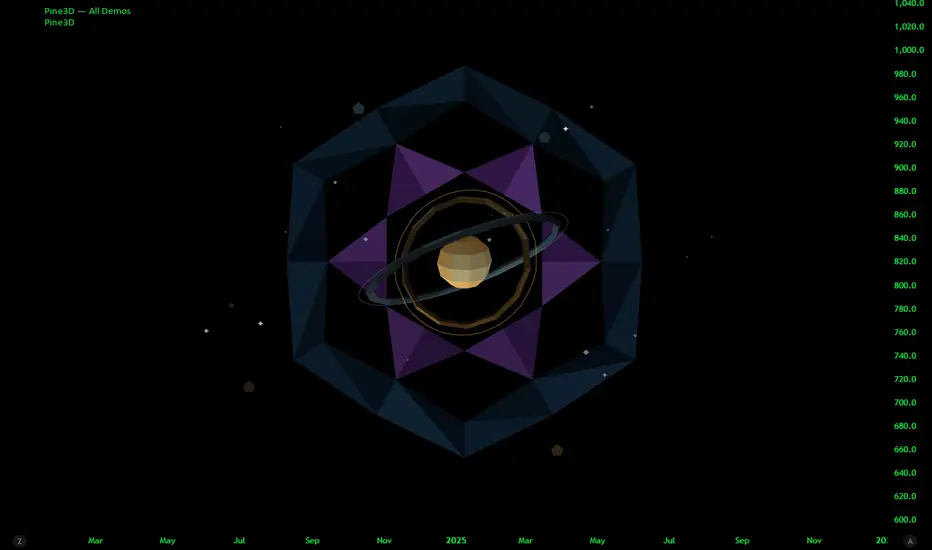
Pine3D: A Native 3D Graphical Rendering EnginePine3D is a full 3D rendering engine for TradingView, powered by Pine Script™ v6.
Pine3D pushes forward the frontier of TradingView 3D rendering capabilities, providing a fully fledged graphical engine under an intuitive, chainable, object oriented API. Build meshes, transform them in world space, light them, cast shadows, project them through a perspective camera, and render the result directly on your chart, all without ever bothering about trigonometry synchronization or optimization.
The
TASC 2026.05 The AutoTune Filter█ OVERVIEW
This script implements the AutoTune Filter described by John F. Ehlers in the article "A Rolling Autocorrelation Function" from the May 2026 edition of the TASC Traders' Tips . The script analyzes rolling autocorrelation in filtered price data to calculate a band-pass filter that dynamically adjusts to apparent dominant cycles.
█ CONCEPTS
Autocorrelation function (ACF)
Autocorrelation measures the correlation of a time series with a lagged version of itself. The autocor
Smart Trader, Episode 06, Isotropic Trend Lines🔷 WHAT IS ST-EP06 — ISOTROPIC TREND LINES?
ST-EP06 is a multi-scale structural trend channel indicator built on a σ-normalized coordinate system. It is designed to solve one of the oldest unaddressed problems in technical analysis:
trend angles that cannot be compared across instruments, timeframes, or volatility regimes.
A trend line drawn on a chart appears to carry a measurable angle — yet that angle is an artifact of the display window, not a property of the market. Resize the chart
AI Predictive Flow (Zeiierman)█ Overview
AI Predictive Flow (Zeiierman) is a pattern-based oscillator that estimates future price direction by comparing the current market state to similar historical conditions.
Instead of relying on traditional indicators like momentum or moving averages alone, the script builds a multi-feature representation of price behavior and uses a k-Nearest Neighbors (kNN) model to identify past patterns that closely resemble the present.
From those matches, it derives an expected forward retur
Focus Bars [Kioseff Trading]Hello Traders!
🔹 Focus Bars
Focus Bars is a lower-timeframe reconstruction tool designed to break each candle into a price-based internal structure .
Instead of viewing a bar as a single OHLC print, this tool redistributes intrabar participation across price levels, showing where activity, delta, and directional pressure concentrated inside the bar itself .
Think of it as a way to look inside the candle .
intrabar participation distributed by price level
buy vs sell pressure mappe
Carrier Volatility [Pumori]Carrier Volatility
This is the foundational Pulse component of the ET Massif Framework research suite.
Description
Pumori is a high-resolution volatility and impulse response tool built around an ultra-short fractional length (0.1 EMA). It is a high-frequency carrier framework that exposes the formation of volatility through controlled instability rather than smoothing. Unlike traditional indicators that smooth or lag volatility, Pumori captures high-frequency energy, allowing volatility to