MGI Walls | Rainbow MatrixGENERAL OVERVIEW
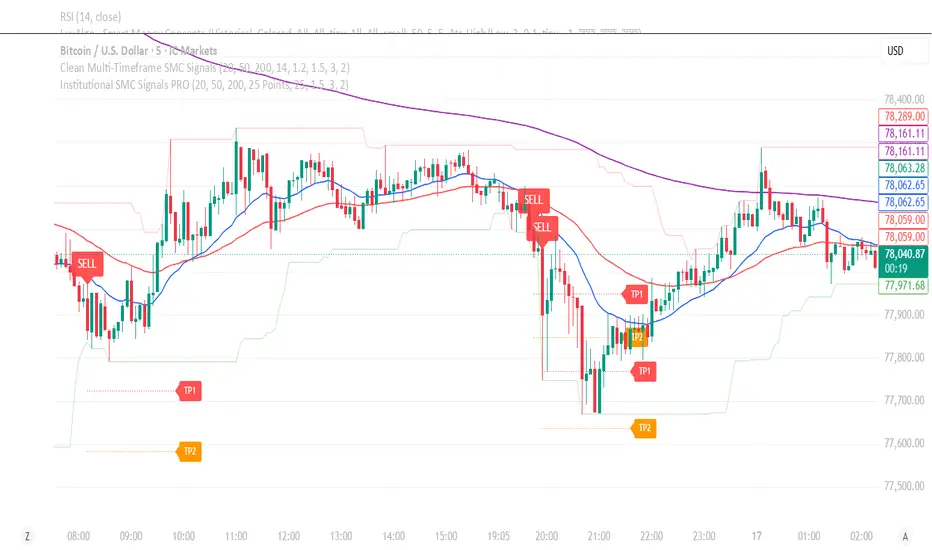
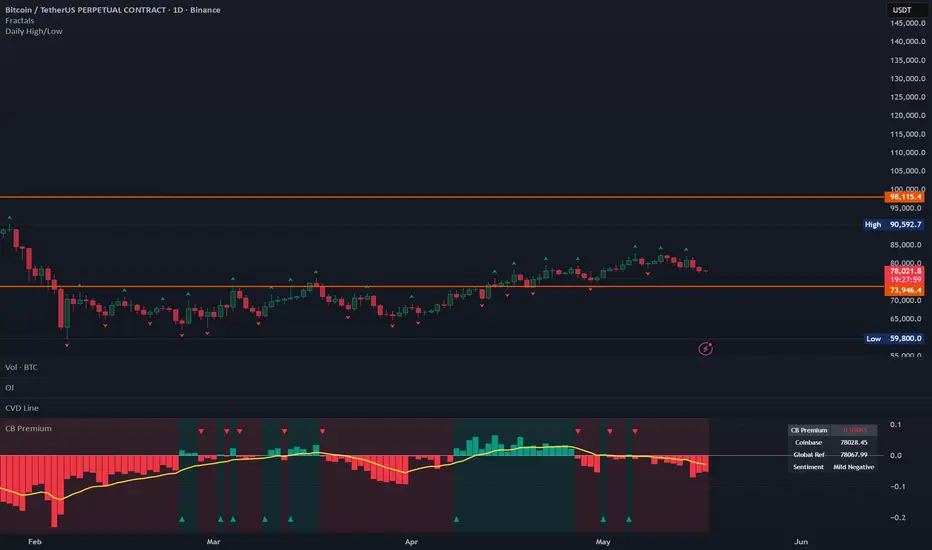
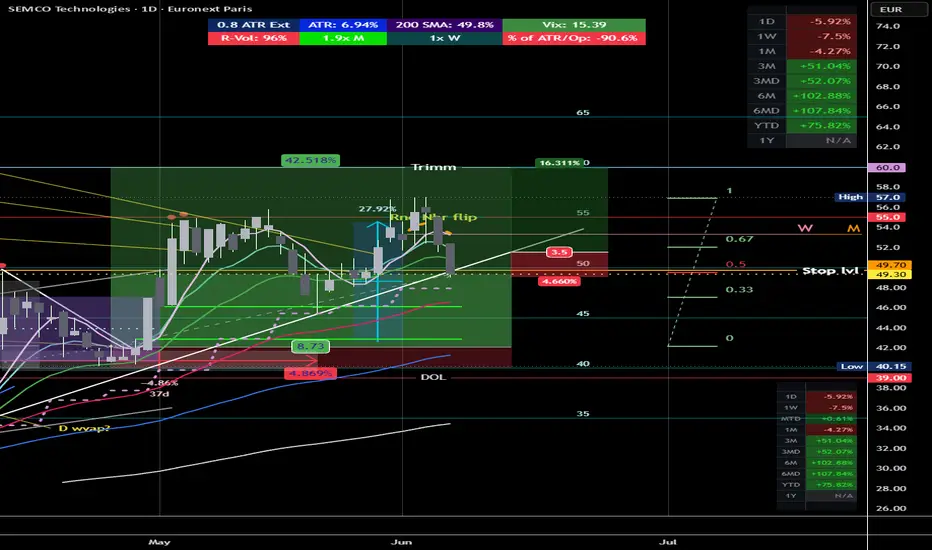
The MGI Walls is a multi-timeframe institutional liquidity radar that extracts and renders the price zones where institutional capital concentrates: Volume Profile blocks (Point of Control, Value Area High, Value Area Low), Anchored VWAPs, and Parabolic SAR levels. Instead of showing these levels for a single chart timeframe, the indicator scans up to five macro timeframes simultaneously and merges overlapping zones into a single intensified block whenever multiple timeframes ag
インジケーター