

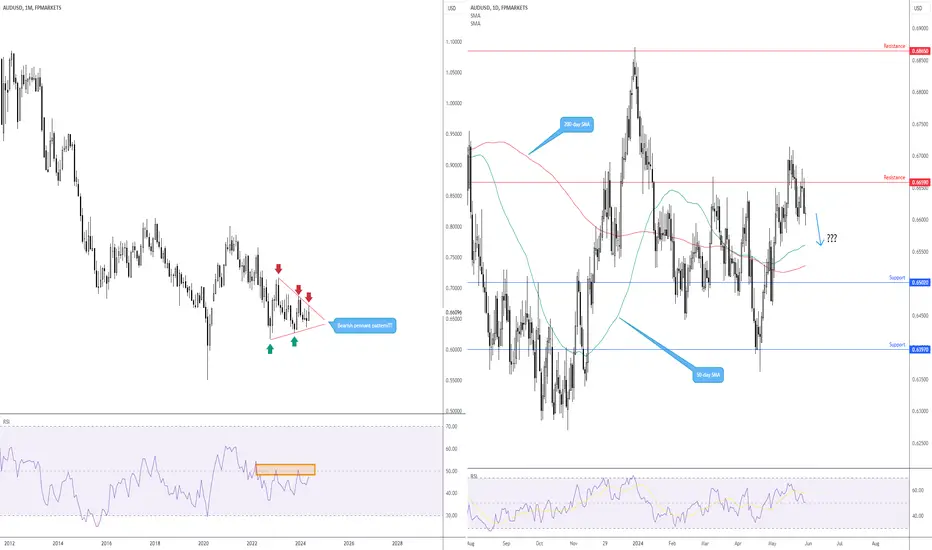
While the AUD/USD shows signs of trending higher on the daily chart – a series of higher highs and higher lows have been seen since $0.6362 – the unit recently connected with resistance at $0.6659, a move bolstered by the monthly chart linking with the upper boundary of a potential bearish pennant formation, drawn from a high of $0.7158 and a low of $0.6170.
Coupled with the above analysis and the Relative Strength Index (RSI) holding south of the 50.00 centreline on the monthly chart and daily flow also poised to break through the 50.00 centreline, this could prompt further selling in the currency pair towards the 200-day and 50-day SMA combination between $0.6528 and $0.6560.
Coupled with the above analysis and the Relative Strength Index (RSI) holding south of the 50.00 centreline on the monthly chart and daily flow also poised to break through the 50.00 centreline, this could prompt further selling in the currency pair towards the 200-day and 50-day SMA combination between $0.6528 and $0.6560.

관련 발행물
면책사항
해당 정보와 게시물은 금융, 투자, 트레이딩 또는 기타 유형의 조언이나 권장 사항으로 간주되지 않으며, 트레이딩뷰에서 제공하거나 보증하는 것이 아닙니다. 자세한 내용은 이용 약관을 참조하세요.
면책사항
해당 정보와 게시물은 금융, 투자, 트레이딩 또는 기타 유형의 조언이나 권장 사항으로 간주되지 않으며, 트레이딩뷰에서 제공하거나 보증하는 것이 아닙니다. 자세한 내용은 이용 약관을 참조하세요.