
H4 :
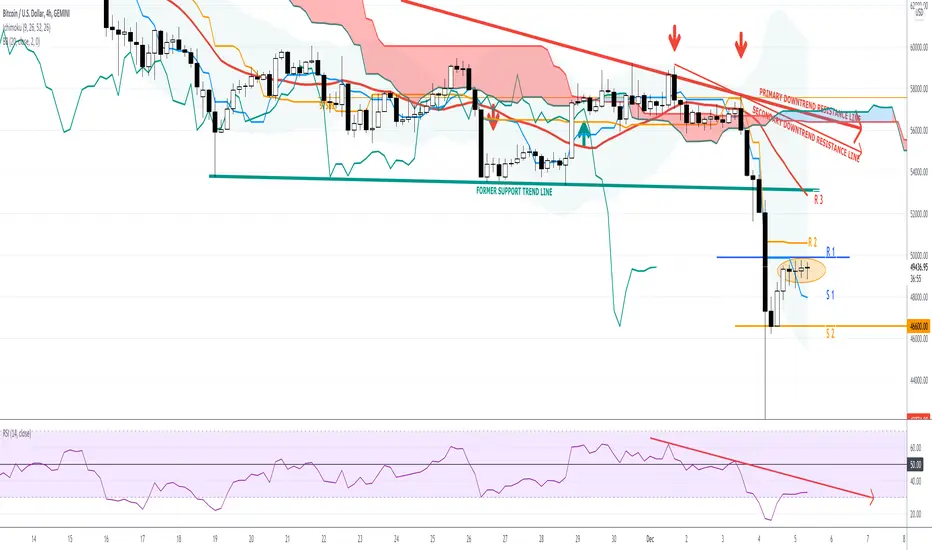
As expected and mentioned in my previous analysis,(see related ideas the corrective recovery move went up so far towards a high of 49'762, nearly filling
the 50% Fibonacci retracement (49'882) of the last downside move from 57673 towards 42'074.
In addition as already said the psychological level of 50'000 has not been broken either and recent and current price action on H4 time frame is
showing successive dojis patterns which should be seen as a growing uncertainty and as a warning of an imminent trend reversal calling for lower levels.
Looking ahead and on both side I would suggest to look carefully at the following levels :
UPSIDE : 50'000 as Resistance 1 (R1)
50'600 as R2
52'878 as R3
DOWNSIDE : 47'975 as Support 1 (S1)
46'600 as S2
42'074 as S3
Globally recent and current price action should still be seen as a corrective move only in a broad bear trend (respectively, below the primary and secondary downtrend line resistance) and below the clouds, which
is confirmed by the Lagging line which is still far away below the clouds !!!
CONCLUSION :
No change in my view,THE ONGOING SELLING PRESSURE IS STILL INTACT, and looking at the weekly picture, a weekly closing below the former uptrend line support (50'900) and below the Mid Bollinger Band (51'673) would add further
selling pressure for the coming trading days !!!
Only a successful recovery above those 2 levels mentioned and this on a weekly closing basis would force to a view reassessment of the expected bearish scenario.
Have a nice Sunday and take care.
All the best
Ironman8848
As expected and mentioned in my previous analysis,(see related ideas the corrective recovery move went up so far towards a high of 49'762, nearly filling
the 50% Fibonacci retracement (49'882) of the last downside move from 57673 towards 42'074.
In addition as already said the psychological level of 50'000 has not been broken either and recent and current price action on H4 time frame is
showing successive dojis patterns which should be seen as a growing uncertainty and as a warning of an imminent trend reversal calling for lower levels.
Looking ahead and on both side I would suggest to look carefully at the following levels :
UPSIDE : 50'000 as Resistance 1 (R1)
50'600 as R2
52'878 as R3
DOWNSIDE : 47'975 as Support 1 (S1)
46'600 as S2
42'074 as S3
Globally recent and current price action should still be seen as a corrective move only in a broad bear trend (respectively, below the primary and secondary downtrend line resistance) and below the clouds, which
is confirmed by the Lagging line which is still far away below the clouds !!!
CONCLUSION :
No change in my view,THE ONGOING SELLING PRESSURE IS STILL INTACT, and looking at the weekly picture, a weekly closing below the former uptrend line support (50'900) and below the Mid Bollinger Band (51'673) would add further
selling pressure for the coming trading days !!!
Only a successful recovery above those 2 levels mentioned and this on a weekly closing basis would force to a view reassessment of the expected bearish scenario.
Have a nice Sunday and take care.
All the best
Ironman8848

관련 발행물
면책사항
해당 정보와 게시물은 금융, 투자, 트레이딩 또는 기타 유형의 조언이나 권장 사항으로 간주되지 않으며, 트레이딩뷰에서 제공하거나 보증하는 것이 아닙니다. 자세한 내용은 이용 약관을 참조하세요.
관련 발행물
면책사항
해당 정보와 게시물은 금융, 투자, 트레이딩 또는 기타 유형의 조언이나 권장 사항으로 간주되지 않으며, 트레이딩뷰에서 제공하거나 보증하는 것이 아닙니다. 자세한 내용은 이용 약관을 참조하세요.