
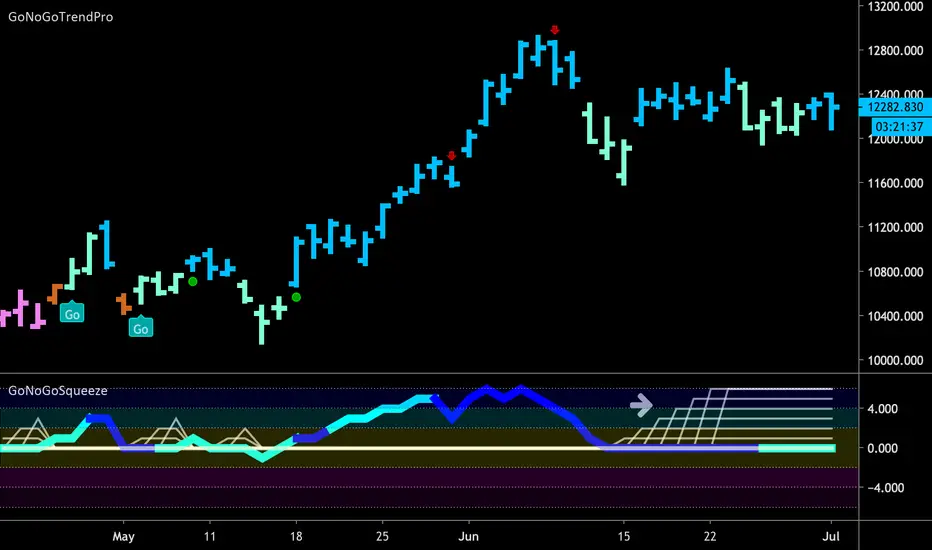
DAX index has been in a “Go” trend since the end of April, rallying strongly for a few months. After hitting a high in early June, GoNoGo Charts displayed a Counter Trend Correction Arrow (red) indicating price had swung too quickly in one direction, and we have been consolidating sideways since. This period of sideways movement has seen smaller price movement leading to the climbing grid of the GoNoGo Squeeze (grey arrow lower panel). After an extended period of reduced *volatility like this, it is typical to see price move quickly out of the squeeze.
If the GoNoGo Oscillator breaks out of the GoNoGo Squeeze into positive territory, we’d expect a leg up to test prior highs. If it breaks out of the squeeze into negative territory, then the “Go” trend is being threatened.
What are the GoNoGo Indicators?
The GoNoGo Trend indicator blends traditional trend concepts to color price action according to the strength of its trend. The colors range from *bright blue (strongly *bullish) to dark *purple (*strongly *bearish)
The GoNoGo Oscillator blends traditional *momentum concepts to demonstrate the velocity of price action. The oscillator ranges from -6 (extremely *oversold) to +6 (extremely *overbought)
If the GoNoGo Oscillator breaks out of the GoNoGo Squeeze into positive territory, we’d expect a leg up to test prior highs. If it breaks out of the squeeze into negative territory, then the “Go” trend is being threatened.
What are the GoNoGo Indicators?
The GoNoGo Trend indicator blends traditional trend concepts to color price action according to the strength of its trend. The colors range from *bright blue (strongly *bullish) to dark *purple (*strongly *bearish)
The GoNoGo Oscillator blends traditional *momentum concepts to demonstrate the velocity of price action. The oscillator ranges from -6 (extremely *oversold) to +6 (extremely *overbought)

면책사항
해당 정보와 게시물은 금융, 투자, 트레이딩 또는 기타 유형의 조언이나 권장 사항으로 간주되지 않으며, 트레이딩뷰에서 제공하거나 보증하는 것이 아닙니다. 자세한 내용은 이용 약관을 참조하세요.
면책사항
해당 정보와 게시물은 금융, 투자, 트레이딩 또는 기타 유형의 조언이나 권장 사항으로 간주되지 않으며, 트레이딩뷰에서 제공하거나 보증하는 것이 아닙니다. 자세한 내용은 이용 약관을 참조하세요.