
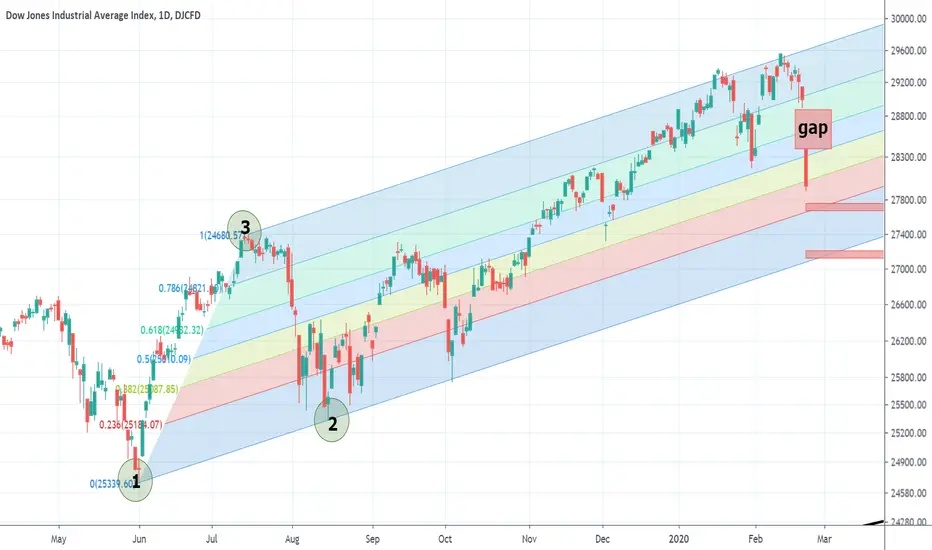
On the chart you can see the fibonacci channel obtained by combining two bottoms (pointed as 1 and 2 on the chart) and the peak between these two bottoms (pointed as 3). This channel should had been drawn and had been started to be followed just after 16th August,2019.
According to the interpretation of this fibonacci channel, it can be expected that dow jones will probably test the next channel line which is the bottom line of the red area in the fibonacci channel. This shows us approximately 27650. If it slides below this level, it can continue to fall toward 27110.
Something must be remembered: These dramatic falls in the indexes worldwide is mainly because of the news about Coronavirus (Covit-19). If the news about treatment comes into the scene, prices can rapidly rise again at least in order to fill up the gap shown on the chart.
According to the interpretation of this fibonacci channel, it can be expected that dow jones will probably test the next channel line which is the bottom line of the red area in the fibonacci channel. This shows us approximately 27650. If it slides below this level, it can continue to fall toward 27110.
Something must be remembered: These dramatic falls in the indexes worldwide is mainly because of the news about Coronavirus (Covit-19). If the news about treatment comes into the scene, prices can rapidly rise again at least in order to fill up the gap shown on the chart.

면책사항
해당 정보와 게시물은 금융, 투자, 트레이딩 또는 기타 유형의 조언이나 권장 사항으로 간주되지 않으며, 트레이딩뷰에서 제공하거나 보증하는 것이 아닙니다. 자세한 내용은 이용 약관을 참조하세요.
면책사항
해당 정보와 게시물은 금융, 투자, 트레이딩 또는 기타 유형의 조언이나 권장 사항으로 간주되지 않으며, 트레이딩뷰에서 제공하거나 보증하는 것이 아닙니다. 자세한 내용은 이용 약관을 참조하세요.