 IREN— HIEQ Model
TQ Analysis | How High Could We Climax on This TS Map Now? 📈
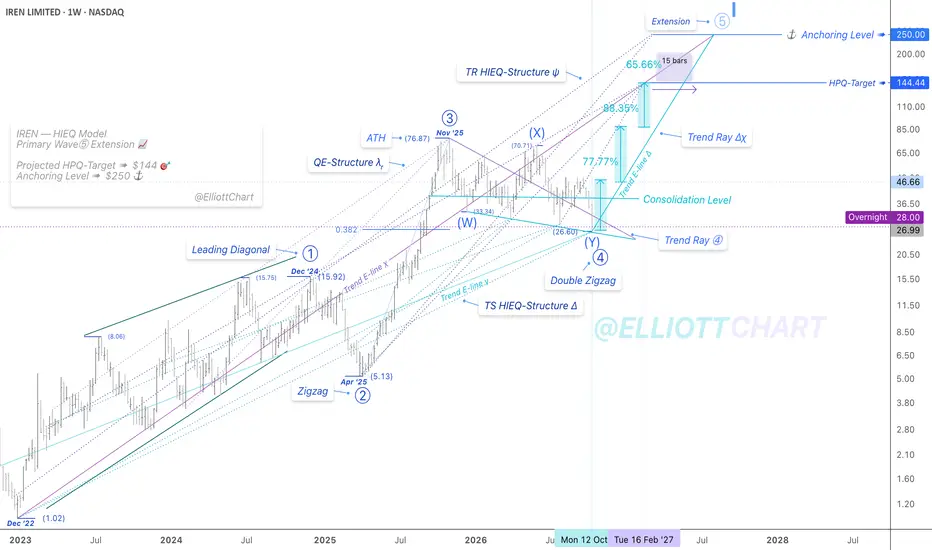
As illustrated on this weekly chart, I’ve refined the evolving HIEQ Model to reflect the recent price reaction, with the pullback now interacting with the Transition-Support Trend Ray ⓸ across the zone of convergence.
The consolidation phase of Primary Wave ⓸ has now unfolded into a Double Zigzag (W)–(X)–(Y), retracing toward the 0.382 Fibonacci level—a common retracement zone for fourth waves within an impulsive sequence.
As you may see on the chart, the Support E-line of the TS Trend Ray ⓸ has now preserved the price structure on four separate occasions, while the broader Cycle-degree Wave I trend remains under evaluation.
I’ve also shifted the Trend Ray Advance to a new timeline to reflect the evolving HIEQ Structures, while the HPQ Target ➤ $144 🎯 remains unchanged.
The projected Primary Wave ⓹ could potentially extend further, with the ultimate climax approaching the defined HP Anchoring Level ➤ $250 ⚓️.
🔖 HIEQ Model ➠ Highly Integrated & Entangling Quantum Model
#StrategicAnalysis #TrendAnalysis #MarketInfrastructures
#FutureVision #TimeSpaceMap #TSMap

관련 발행물
면책사항
해당 정보와 게시물은 금융, 투자, 트레이딩 또는 기타 유형의 조언이나 권장 사항으로 간주되지 않으며, 트레이딩뷰에서 제공하거나 보증하는 것이 아닙니다. 자세한 내용은 이용 약관을 참조하세요.
면책사항
해당 정보와 게시물은 금융, 투자, 트레이딩 또는 기타 유형의 조언이나 권장 사항으로 간주되지 않으며, 트레이딩뷰에서 제공하거나 보증하는 것이 아닙니다. 자세한 내용은 이용 약관을 참조하세요.