
Roku has been one of the top performing growth stocks since going public in late 2017. Now, after a healthy pullback, it may be ready to move again.
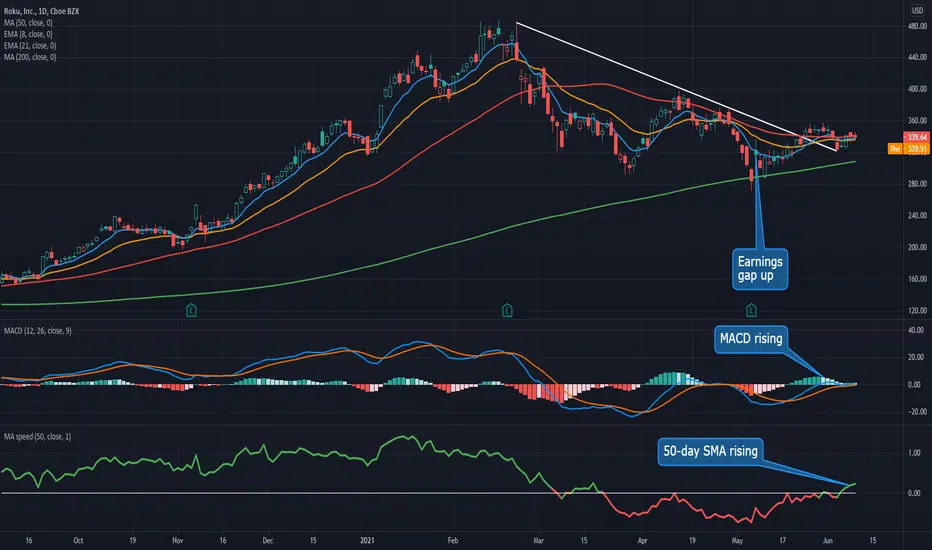
The main pattern on today’s chart is the 50-day simple moving average (SMA). This line was resistance in April and late May. But now ROKU is attempting to break it. Notice how the 50-day SMA is now rising (illustrated by our Moving Average Speed custom script).
ROKU also tested its 200-day SMA last month and quickly bounced after earnings beat estimates. Short-term momentum was still bearish at the time, but now it’s potentially positive because the 8-day exponential moving average (EMA) has risen above the 21-day EMA. MACD is giving a similar signal.
Another interesting feature is the descending trendline that was resistance between February and late April. Prices broke above it in 2-1/2 weeks ago and now it’s become support.

Finally, the weekly chart shows a bullish inside candle forming. That can be a sign of price tightening and preparing for a change of direction.
TradeStation is a pioneer in the trading industry, providing access to stocks, options, futures and cryptocurrencies. See our Overview for more.
The main pattern on today’s chart is the 50-day simple moving average (SMA). This line was resistance in April and late May. But now ROKU is attempting to break it. Notice how the 50-day SMA is now rising (illustrated by our Moving Average Speed custom script).
ROKU also tested its 200-day SMA last month and quickly bounced after earnings beat estimates. Short-term momentum was still bearish at the time, but now it’s potentially positive because the 8-day exponential moving average (EMA) has risen above the 21-day EMA. MACD is giving a similar signal.
Another interesting feature is the descending trendline that was resistance between February and late April. Prices broke above it in 2-1/2 weeks ago and now it’s become support.
Finally, the weekly chart shows a bullish inside candle forming. That can be a sign of price tightening and preparing for a change of direction.
TradeStation is a pioneer in the trading industry, providing access to stocks, options, futures and cryptocurrencies. See our Overview for more.

관련 발행물
면책사항
해당 정보와 게시물은 금융, 투자, 트레이딩 또는 기타 유형의 조언이나 권장 사항으로 간주되지 않으며, 트레이딩뷰에서 제공하거나 보증하는 것이 아닙니다. 자세한 내용은 이용 약관을 참조하세요.
관련 발행물
면책사항
해당 정보와 게시물은 금융, 투자, 트레이딩 또는 기타 유형의 조언이나 권장 사항으로 간주되지 않으며, 트레이딩뷰에서 제공하거나 보증하는 것이 아닙니다. 자세한 내용은 이용 약관을 참조하세요.