
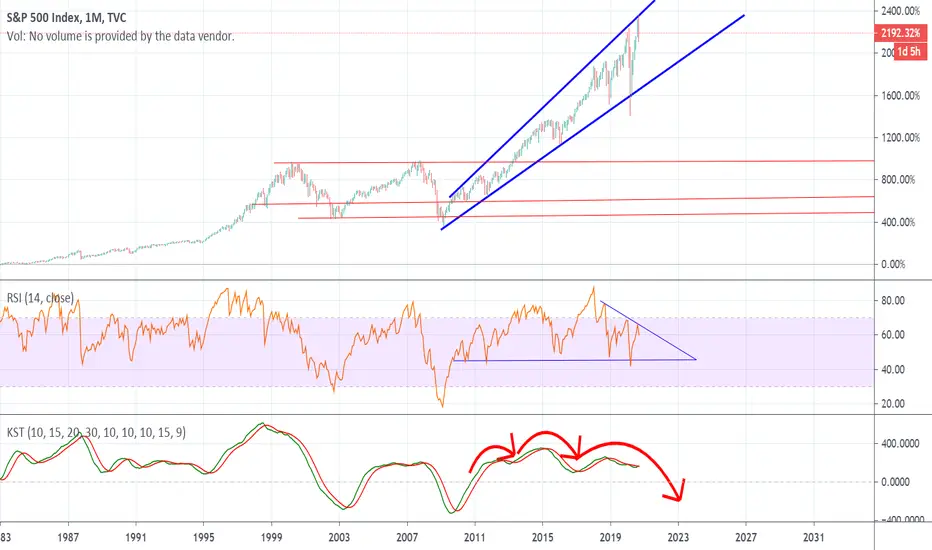
The S&P 500 is forming a rising channel or ascending channel marked by two blue parallel uptrend lines.
Most stocks typically continue to channel until either trend line is broken.
An upside break is a signal that buying intensity has increased, while a downside break indicates an end to the short-term uptrend.
On the RSI there's a noticeable divergence, the blue downward sloping line of resistance will need to be purged to the upside before the pattern finishes or there's likely going to be a heinous correction if the pattern finishes bearishly.
The KST is trying to cross bullishly over the red line but has been rejected multiple times upon close observation, I've outlined a possible H&S pattern that will occur unless we see a bullish cross on the KST.
Most stocks typically continue to channel until either trend line is broken.
An upside break is a signal that buying intensity has increased, while a downside break indicates an end to the short-term uptrend.
On the RSI there's a noticeable divergence, the blue downward sloping line of resistance will need to be purged to the upside before the pattern finishes or there's likely going to be a heinous correction if the pattern finishes bearishly.
The KST is trying to cross bullishly over the red line but has been rejected multiple times upon close observation, I've outlined a possible H&S pattern that will occur unless we see a bullish cross on the KST.

면책사항
해당 정보와 게시물은 금융, 투자, 트레이딩 또는 기타 유형의 조언이나 권장 사항으로 간주되지 않으며, 트레이딩뷰에서 제공하거나 보증하는 것이 아닙니다. 자세한 내용은 이용 약관을 참조하세요.
면책사항
해당 정보와 게시물은 금융, 투자, 트레이딩 또는 기타 유형의 조언이나 권장 사항으로 간주되지 않으며, 트레이딩뷰에서 제공하거나 보증하는 것이 아닙니다. 자세한 내용은 이용 약관을 참조하세요.