
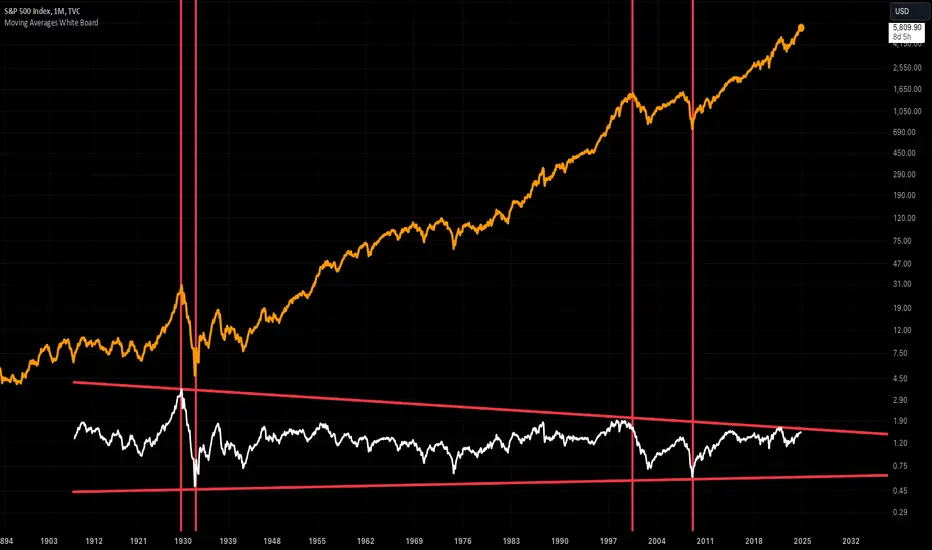
Current deviation from long term mathematical model at the top of trend only reached twice in the last 100 years; once during the Great Depression and once during the top of the Dot-Com bubble.
Mathematical model = Ratio of Close to smoothed 300 Week SMA (SMA 10 of SMA 10 of SMA 70 Week Close)
Mathematical model = Ratio of Close to smoothed 300 Week SMA (SMA 10 of SMA 10 of SMA 70 Week Close)

관련 발행물
면책사항
해당 정보와 게시물은 금융, 투자, 트레이딩 또는 기타 유형의 조언이나 권장 사항으로 간주되지 않으며, 트레이딩뷰에서 제공하거나 보증하는 것이 아닙니다. 자세한 내용은 이용 약관을 참조하세요.
면책사항
해당 정보와 게시물은 금융, 투자, 트레이딩 또는 기타 유형의 조언이나 권장 사항으로 간주되지 않으며, 트레이딩뷰에서 제공하거나 보증하는 것이 아닙니다. 자세한 내용은 이용 약관을 참조하세요.