
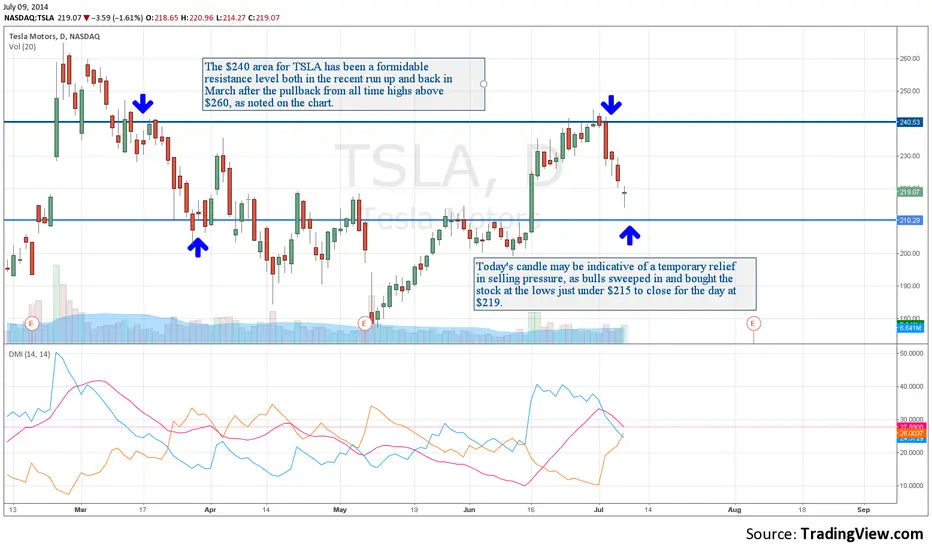
The $240 area for TSLA has been a formidable resistance level both in the recent run up as well as back in March after the pullback from all time highs above $260, as noted on the chart.
Today's candle may be indicative of a temporary relief in selling pressure, as bulls swept in and bought the stock at the lows just under $215 to close for the day at $219.
If the overall markets continue to pullback, it will be interesting to see if the stock can hold the $210 area, as this was the breakout level for June run up.
Blog post dated: 07/08/2014: syncubate.com/blog/2014/7/8/tsla-resistance-overhead
Today's candle may be indicative of a temporary relief in selling pressure, as bulls swept in and bought the stock at the lows just under $215 to close for the day at $219.
If the overall markets continue to pullback, it will be interesting to see if the stock can hold the $210 area, as this was the breakout level for June run up.
Blog post dated: 07/08/2014: syncubate.com/blog/2014/7/8/tsla-resistance-overhead

면책사항
해당 정보와 게시물은 금융, 투자, 트레이딩 또는 기타 유형의 조언이나 권장 사항으로 간주되지 않으며, 트레이딩뷰에서 제공하거나 보증하는 것이 아닙니다. 자세한 내용은 이용 약관을 참조하세요.
면책사항
해당 정보와 게시물은 금융, 투자, 트레이딩 또는 기타 유형의 조언이나 권장 사항으로 간주되지 않으며, 트레이딩뷰에서 제공하거나 보증하는 것이 아닙니다. 자세한 내용은 이용 약관을 참조하세요.