
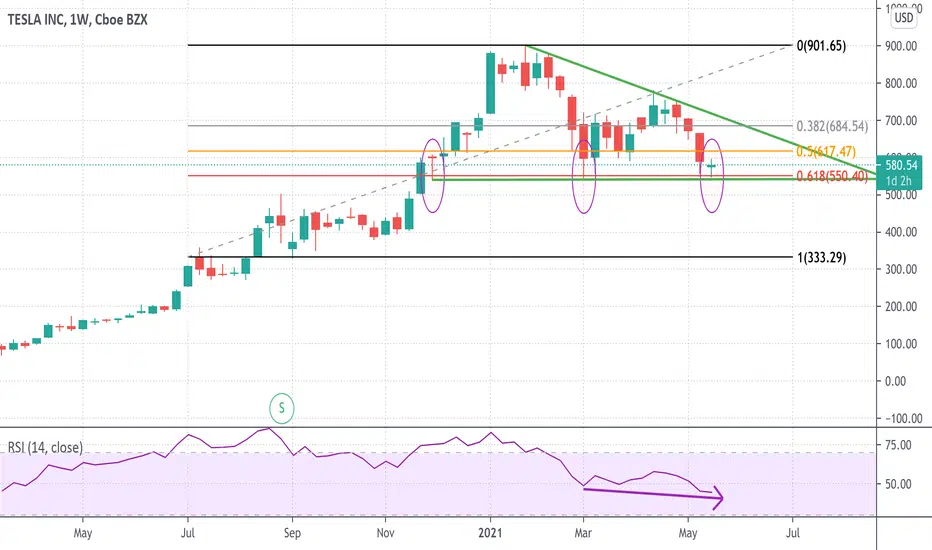
A weekly chart of TSLA will show us the longer term trend, which fate could be tested at the $550 level, which is coincidental with the 61.8% Fibonacci Retracement, a break below this level suggests the next target on the downside is $330 approximately.
There is a slight divergence with the RSI, when you take a look at the last bottom. (Bearish)
I will be keeping this on a close watch.
There is a slight divergence with the RSI, when you take a look at the last bottom. (Bearish)
I will be keeping this on a close watch.

면책사항
해당 정보와 게시물은 금융, 투자, 트레이딩 또는 기타 유형의 조언이나 권장 사항으로 간주되지 않으며, 트레이딩뷰에서 제공하거나 보증하는 것이 아닙니다. 자세한 내용은 이용 약관을 참조하세요.
면책사항
해당 정보와 게시물은 금융, 투자, 트레이딩 또는 기타 유형의 조언이나 권장 사항으로 간주되지 않으며, 트레이딩뷰에서 제공하거나 보증하는 것이 아닙니다. 자세한 내용은 이용 약관을 참조하세요.