
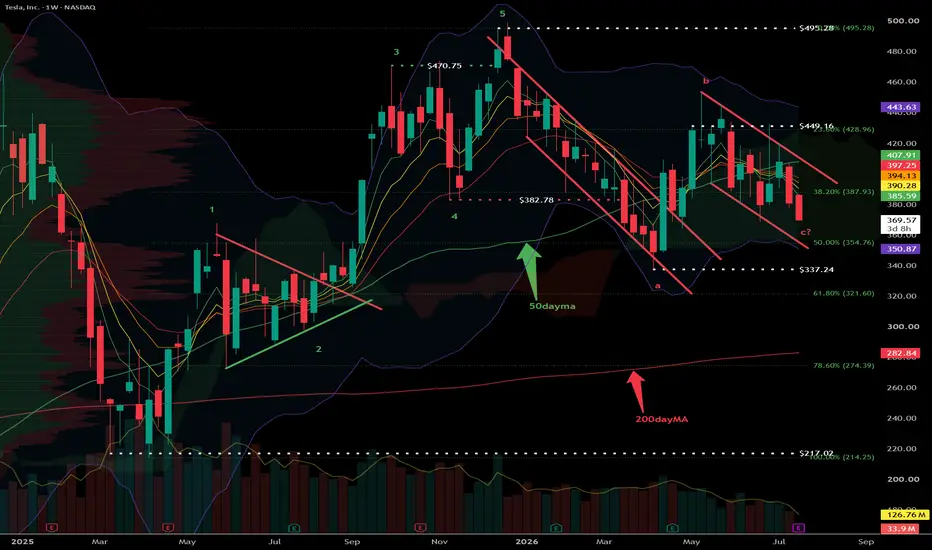
From the April ’25 lows, I’ve mapped out one possible eight-wave Elliott Wave structure: a five-wave impulse higher, followed by an A-B-C correction, with wave C potentially still in progress.
The impulsive move topped around $495 in December, completing the fifth wave before price entered the current corrective phase. Since then, Tesla has continued printing lower highs and remains inside a descending channel.
I’ve kept the main channels, consolidation patterns, moving averages and key levels on the chart. Green lines show the important bullish structures, while red lines highlight those that have already broken.
The Fibonacci retracement is measured across the entire five-wave advance. The April low reached the 50%–61.8% retracement zone, which still leaves the broader structure constructive from a Fibonacci perspective.
The main support levels now sit around:
• $355 — 50% retracement and 50-week MA area
• $337 — previous corrective low
• $322 — 61.8% retracement
For the bullish structure to begin rebuilding, price needs to reclaim the shorter-term moving averages and break above the current descending channel. The first major resistance sits around $449, followed by the December high near $495.
With earnings due, it may take a clear beat or miss to push price decisively out of this correction. Until then, the wider structure remains bullish, but the shorter-term trend is still corrective.
NFA. DYOR.
The impulsive move topped around $495 in December, completing the fifth wave before price entered the current corrective phase. Since then, Tesla has continued printing lower highs and remains inside a descending channel.
I’ve kept the main channels, consolidation patterns, moving averages and key levels on the chart. Green lines show the important bullish structures, while red lines highlight those that have already broken.
The Fibonacci retracement is measured across the entire five-wave advance. The April low reached the 50%–61.8% retracement zone, which still leaves the broader structure constructive from a Fibonacci perspective.
The main support levels now sit around:
• $355 — 50% retracement and 50-week MA area
• $337 — previous corrective low
• $322 — 61.8% retracement
For the bullish structure to begin rebuilding, price needs to reclaim the shorter-term moving averages and break above the current descending channel. The first major resistance sits around $449, followed by the December high near $495.
With earnings due, it may take a clear beat or miss to push price decisively out of this correction. Until then, the wider structure remains bullish, but the shorter-term trend is still corrective.
NFA. DYOR.

면책사항
해당 정보와 게시물은 금융, 투자, 트레이딩 또는 기타 유형의 조언이나 권장 사항으로 간주되지 않으며, 트레이딩뷰에서 제공하거나 보증하는 것이 아닙니다. 자세한 내용은 이용 약관을 참조하세요.
면책사항
해당 정보와 게시물은 금융, 투자, 트레이딩 또는 기타 유형의 조언이나 권장 사항으로 간주되지 않으며, 트레이딩뷰에서 제공하거나 보증하는 것이 아닙니다. 자세한 내용은 이용 약관을 참조하세요.