📊 Technical Analysis:  TSLA (Tesla)
🗓️ Updated: March 24, 2025
🚨 Critical Zone Being Tested
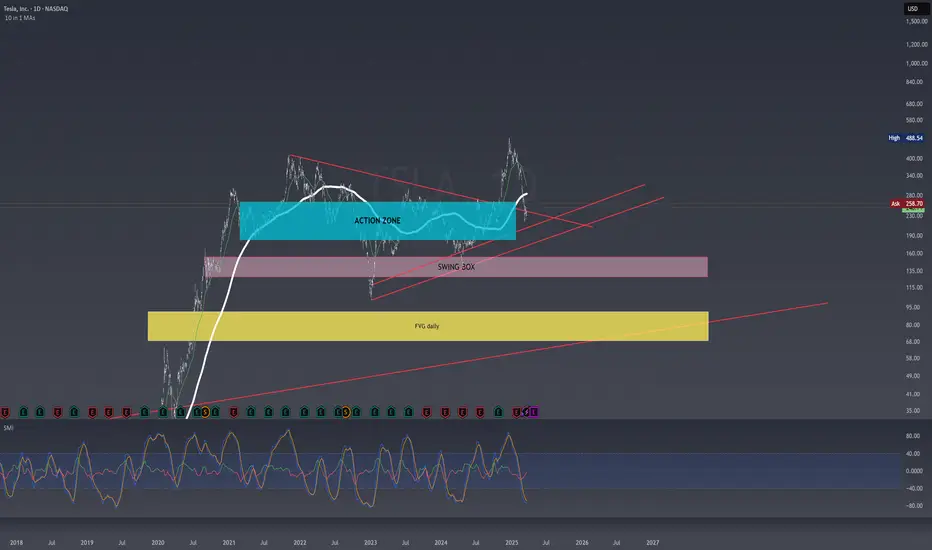
After breaking out of a multi-year symmetrical triangle,TSLA is now retesting the upper boundary of the pattern — perfectly aligned with the key ACTION ZONE (liquidity zone + long-term MAs).
🔵 ACTION ZONE ($245–265):
High-probability decision area. Holding this level could trigger a fresh bullish leg.
🟣 SWING BOX ($180–210):
If support fails, this is the next logical area for a potential bullish reaction.
🟡 FVG Daily ($75–115):
Unmitigated Fair Value Gap. Only relevant in case of a major breakdown.
📉 SMI (Stochastic Momentum Index):
Currently in negative territory, but nearing oversold — watch for a potential reversal.
🎯 Scenarios:
Bullish: Strong rejection from the Action Zone → potential move to $350–400 ✅
Bearish: Breakdown below the blue zone → eyes on Swing Box or FVG for reentry ⚠️
📌 Reminder: This is not financial advice. Always manage risk and wait for confirmation before entering a trade.
💬 What do you think? Is Tesla preparing for a bounce or heading lower?
👇 Share your thoughts in the comments!
TSLA (Tesla)🗓️ Updated: March 24, 2025
🚨 Critical Zone Being Tested
After breaking out of a multi-year symmetrical triangle,
TSLA is now retesting the upper boundary of the pattern — perfectly aligned with the key ACTION ZONE (liquidity zone + long-term MAs).🔵 ACTION ZONE ($245–265):
High-probability decision area. Holding this level could trigger a fresh bullish leg.
🟣 SWING BOX ($180–210):
If support fails, this is the next logical area for a potential bullish reaction.
🟡 FVG Daily ($75–115):
Unmitigated Fair Value Gap. Only relevant in case of a major breakdown.
📉 SMI (Stochastic Momentum Index):
Currently in negative territory, but nearing oversold — watch for a potential reversal.
🎯 Scenarios:
Bullish: Strong rejection from the Action Zone → potential move to $350–400 ✅
Bearish: Breakdown below the blue zone → eyes on Swing Box or FVG for reentry ⚠️
📌 Reminder: This is not financial advice. Always manage risk and wait for confirmation before entering a trade.
💬 What do you think? Is Tesla preparing for a bounce or heading lower?
👇 Share your thoughts in the comments!

면책사항
해당 정보와 게시물은 금융, 투자, 트레이딩 또는 기타 유형의 조언이나 권장 사항으로 간주되지 않으며, 트레이딩뷰에서 제공하거나 보증하는 것이 아닙니다. 자세한 내용은 이용 약관을 참조하세요.
면책사항
해당 정보와 게시물은 금융, 투자, 트레이딩 또는 기타 유형의 조언이나 권장 사항으로 간주되지 않으며, 트레이딩뷰에서 제공하거나 보증하는 것이 아닙니다. 자세한 내용은 이용 약관을 참조하세요.