
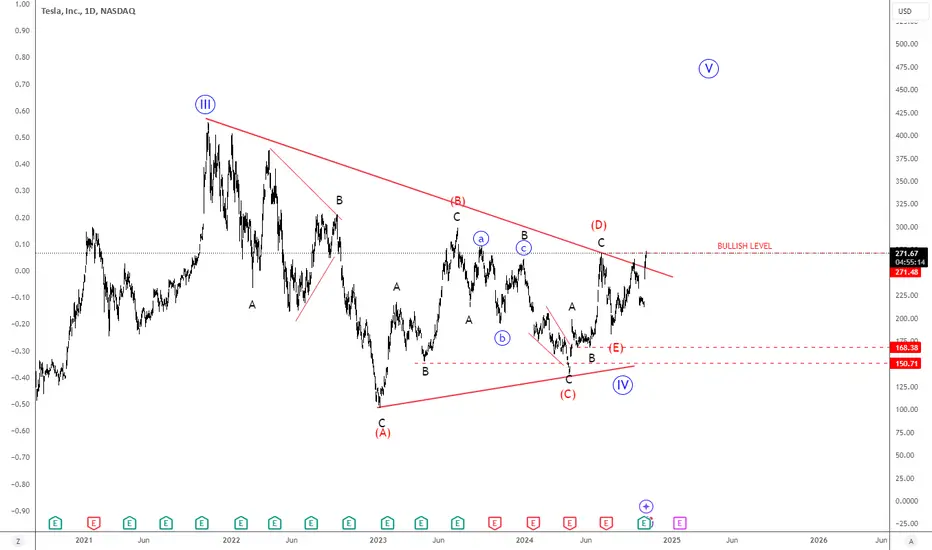
Tesla has been trading sideways since 2021, which we see it as a consolidation within bullish trend, ideally as a larger bullish triangle pattern in wave IV that can send the price higher for wave V
Tesla is now breaking important 270 area after recent strong earnings. Considering it's breaking above upper triangle line, then bullish ABCDE triangle in wave IV can finally be completed. Is Wave V now underway back to all-time highs?
A triangle appears to reflect a balance of forces, causing a sideways movement that is usually associated with decreasing volume and volatility. The triangle pattern contains five overlapping waves that subdivide 3-3-3-3-3 and are labeled A-B-C-D-E. The triangle is a region of horizontal price movement, a consolidation of a prior move, and it is composed of “threes.” That means each of the A-B-C-D-E waves have three subwaves. The triangle pattern is generally categorized as a continuation pattern, meaning that after the pattern completes, it’s assumed that the price will continue in the trend direction it was moving before the pattern appeared. However, triangles also indicate that the final leg is coming before a reversal and that’s why triangles are labeled in wave B, wave X or wave 4.
Tesla is now breaking important 270 area after recent strong earnings. Considering it's breaking above upper triangle line, then bullish ABCDE triangle in wave IV can finally be completed. Is Wave V now underway back to all-time highs?
A triangle appears to reflect a balance of forces, causing a sideways movement that is usually associated with decreasing volume and volatility. The triangle pattern contains five overlapping waves that subdivide 3-3-3-3-3 and are labeled A-B-C-D-E. The triangle is a region of horizontal price movement, a consolidation of a prior move, and it is composed of “threes.” That means each of the A-B-C-D-E waves have three subwaves. The triangle pattern is generally categorized as a continuation pattern, meaning that after the pattern completes, it’s assumed that the price will continue in the trend direction it was moving before the pattern appeared. However, triangles also indicate that the final leg is coming before a reversal and that’s why triangles are labeled in wave B, wave X or wave 4.

Download my free Elliott Wave guide (PDF): wavetraders.com/free-elliott-wave-guide/?utm_source=tradingview
Get the full Elliott Wave counts at WaveTraders, €1 14-day trial: wavetraders.com/elliott-wave-plans/?utm_source=tradingview
Get the full Elliott Wave counts at WaveTraders, €1 14-day trial: wavetraders.com/elliott-wave-plans/?utm_source=tradingview
관련 발행물
면책사항
해당 정보와 게시물은 금융, 투자, 트레이딩 또는 기타 유형의 조언이나 권장 사항으로 간주되지 않으며, 트레이딩뷰에서 제공하거나 보증하는 것이 아닙니다. 자세한 내용은 이용 약관을 참조하세요.
Download my free Elliott Wave guide (PDF): wavetraders.com/free-elliott-wave-guide/?utm_source=tradingview
Get the full Elliott Wave counts at WaveTraders, €1 14-day trial: wavetraders.com/elliott-wave-plans/?utm_source=tradingview
Get the full Elliott Wave counts at WaveTraders, €1 14-day trial: wavetraders.com/elliott-wave-plans/?utm_source=tradingview
관련 발행물
면책사항
해당 정보와 게시물은 금융, 투자, 트레이딩 또는 기타 유형의 조언이나 권장 사항으로 간주되지 않으며, 트레이딩뷰에서 제공하거나 보증하는 것이 아닙니다. 자세한 내용은 이용 약관을 참조하세요.