
Welcome to Excavo's professional analysis of the stock prices of Tesla Inc.
Tesla is up more than 91% year to date.
Fundamental Analysis and News:
Morgan Stanley raised its base case price target on Tesla (NASDAQ:TSLA) to $500 from $360 and the bull case target to $1,200 from $650.
The company has "significant addition optionality" through the truck, self-driving, battery technology, and solar markets.
Technical Analysis:
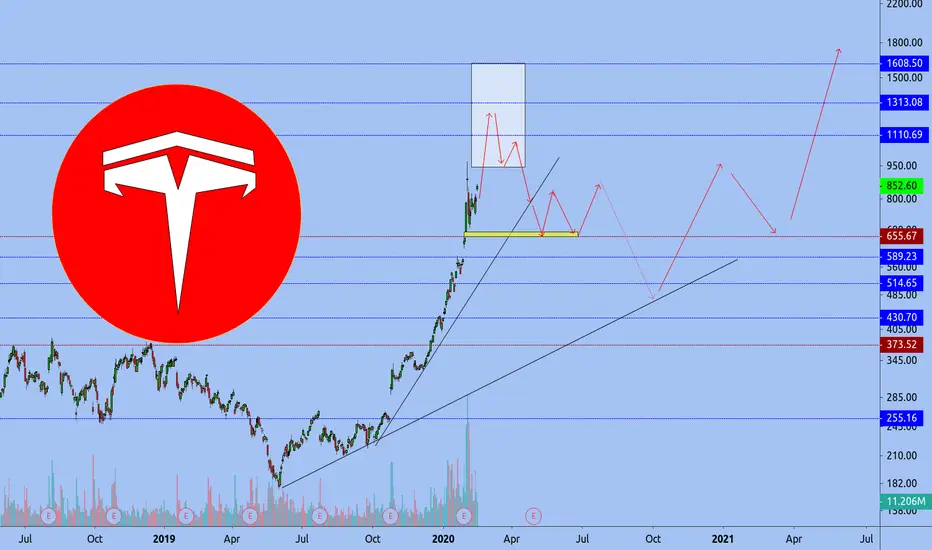
Currently, TSLA is approaching an important all-time psychological resistance level of $1000.
It should be noted that the price action flashes a bearish signal - the gaps that are in areas of the chart where a security's price either rises or falls from the previous day’s close, with no trading occurring in between. Gaps like these tend to get filled and indicates that a trend reversal is forming from bullish to bearish, and a downtrend could follow.
On the flip side, many stop-loses hold on in a $1000-1100 trading range and in case of achieve these points there will be a closing of sell positions at market prices, which opens up the gates for a further rally to target the next resistances up to $1600.
Remember to be cautious and to use proper risk management tactics to prevent any losses from unexpected market movements.
Resistance Levels: $1000, 1100, 1300, 1600
Gap levels: $655, 589, 514, 430, 255
Day's Range: 41.61 — 45.73
Market Cap: 154.068B
Stay tuned for future technical analysis, news, updates, and more from EXCAVO
Tesla is up more than 91% year to date.
Fundamental Analysis and News:
Morgan Stanley raised its base case price target on Tesla (NASDAQ:TSLA) to $500 from $360 and the bull case target to $1,200 from $650.
The company has "significant addition optionality" through the truck, self-driving, battery technology, and solar markets.
Technical Analysis:
Currently, TSLA is approaching an important all-time psychological resistance level of $1000.
It should be noted that the price action flashes a bearish signal - the gaps that are in areas of the chart where a security's price either rises or falls from the previous day’s close, with no trading occurring in between. Gaps like these tend to get filled and indicates that a trend reversal is forming from bullish to bearish, and a downtrend could follow.
On the flip side, many stop-loses hold on in a $1000-1100 trading range and in case of achieve these points there will be a closing of sell positions at market prices, which opens up the gates for a further rally to target the next resistances up to $1600.
Remember to be cautious and to use proper risk management tactics to prevent any losses from unexpected market movements.
Resistance Levels: $1000, 1100, 1300, 1600
Gap levels: $655, 589, 514, 430, 255
Day's Range: 41.61 — 45.73
Market Cap: 154.068B
Stay tuned for future technical analysis, news, updates, and more from EXCAVO
노트
+60$
bitunix.com/register?vipCode=Ri1J7239
trading-tournaments.com/tournaments
Free analysis→ t.me/+Qm96gDz3qdyNOs8t
Indicators → excavo.com/
Strategies t.me/ExcavoPulseBot
🎓 → t.me/EXCAVOREFF_bot
trading-tournaments.com/tournaments
Free analysis→ t.me/+Qm96gDz3qdyNOs8t
Indicators → excavo.com/
Strategies t.me/ExcavoPulseBot
🎓 → t.me/EXCAVOREFF_bot
면책사항
해당 정보와 게시물은 금융, 투자, 트레이딩 또는 기타 유형의 조언이나 권장 사항으로 간주되지 않으며, 트레이딩뷰에서 제공하거나 보증하는 것이 아닙니다. 자세한 내용은 이용 약관을 참조하세요.
bitunix.com/register?vipCode=Ri1J7239
trading-tournaments.com/tournaments
Free analysis→ t.me/+Qm96gDz3qdyNOs8t
Indicators → excavo.com/
Strategies t.me/ExcavoPulseBot
🎓 → t.me/EXCAVOREFF_bot
trading-tournaments.com/tournaments
Free analysis→ t.me/+Qm96gDz3qdyNOs8t
Indicators → excavo.com/
Strategies t.me/ExcavoPulseBot
🎓 → t.me/EXCAVOREFF_bot
면책사항
해당 정보와 게시물은 금융, 투자, 트레이딩 또는 기타 유형의 조언이나 권장 사항으로 간주되지 않으며, 트레이딩뷰에서 제공하거나 보증하는 것이 아닙니다. 자세한 내용은 이용 약관을 참조하세요.