
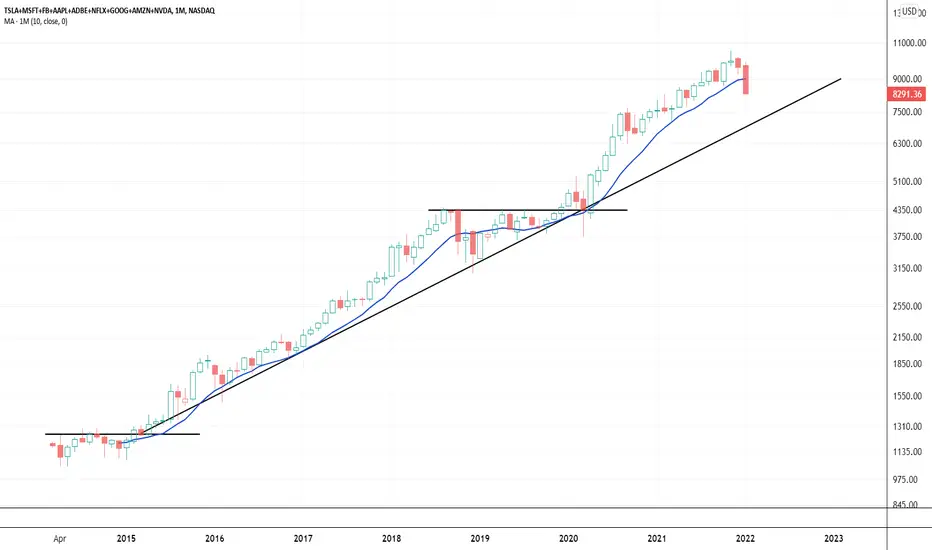
This is a monthly candle chart of the FANG complex. The last time the group had a monthly close below it's 10 Month moving average it traded back down towards its trend line. The stocks traded down for about 5 months and consolidated for another 8 months, when looking at them as a group. If you have a 401K, IRA, and 529 plans consider how much exposure you have to this mix. The complex could fall quite a bit and not break the long term up trend. Considering the month isn't over quite yet this chart is premature. I figured it was an interesting look none the less.
Thoughts, feelings, ideas?
Here's the link to the watch list:
tradingview.com/watchlists/62522214/
Thoughts, feelings, ideas?
Here's the link to the watch list:
tradingview.com/watchlists/62522214/

면책사항
해당 정보와 게시물은 금융, 투자, 트레이딩 또는 기타 유형의 조언이나 권장 사항으로 간주되지 않으며, 트레이딩뷰에서 제공하거나 보증하는 것이 아닙니다. 자세한 내용은 이용 약관을 참조하세요.
면책사항
해당 정보와 게시물은 금융, 투자, 트레이딩 또는 기타 유형의 조언이나 권장 사항으로 간주되지 않으며, 트레이딩뷰에서 제공하거나 보증하는 것이 아닙니다. 자세한 내용은 이용 약관을 참조하세요.