
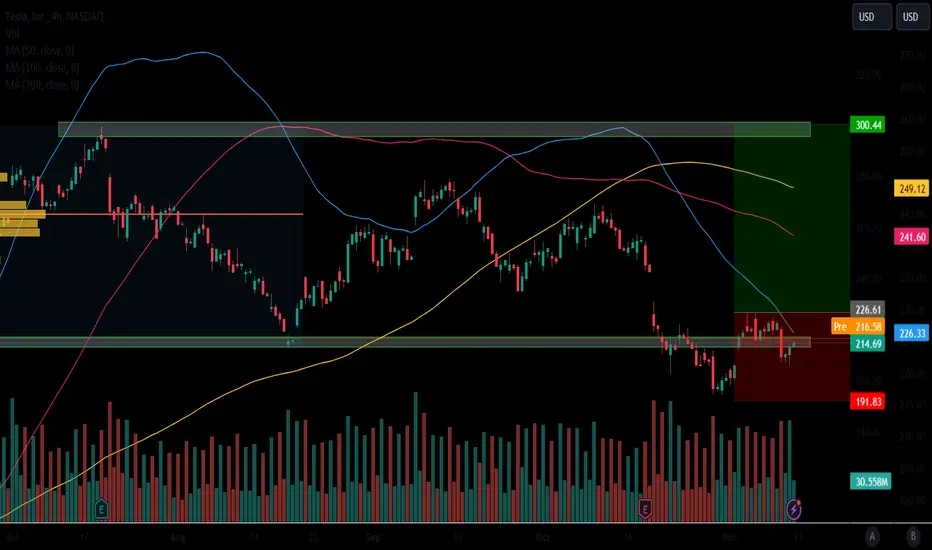
Tesla is in a falling trend channel in the medium long term. This signals increasing pessimism among investors and indicates further decline for Tesla. The stock gave a negative signal from the double top formation by the break down through the support at 215. Further fall to 163 or lower is signaled. The stock is testing support at dollar 214. This could give a positive reaction, but a downward breakthrough of dollar 214 means a negative signal. The volume balance is negative and weakens the stock in the short term. The RSI curve shows a falling trend, which supports the negative trend.
Price Momentum
TSLA is trading in the middle of its 52-week range and below its 200-day simple moving average.
What does this mean?
Investors are still evaluating the share price, but the stock still appears to have some downward momentum.
Price Momentum
TSLA is trading in the middle of its 52-week range and below its 200-day simple moving average.
What does this mean?
Investors are still evaluating the share price, but the stock still appears to have some downward momentum.

면책사항
해당 정보와 게시물은 금융, 투자, 트레이딩 또는 기타 유형의 조언이나 권장 사항으로 간주되지 않으며, 트레이딩뷰에서 제공하거나 보증하는 것이 아닙니다. 자세한 내용은 이용 약관을 참조하세요.
면책사항
해당 정보와 게시물은 금융, 투자, 트레이딩 또는 기타 유형의 조언이나 권장 사항으로 간주되지 않으며, 트레이딩뷰에서 제공하거나 보증하는 것이 아닙니다. 자세한 내용은 이용 약관을 참조하세요.