
Short-term rates are one of the clearest liquidity gauges in the market.
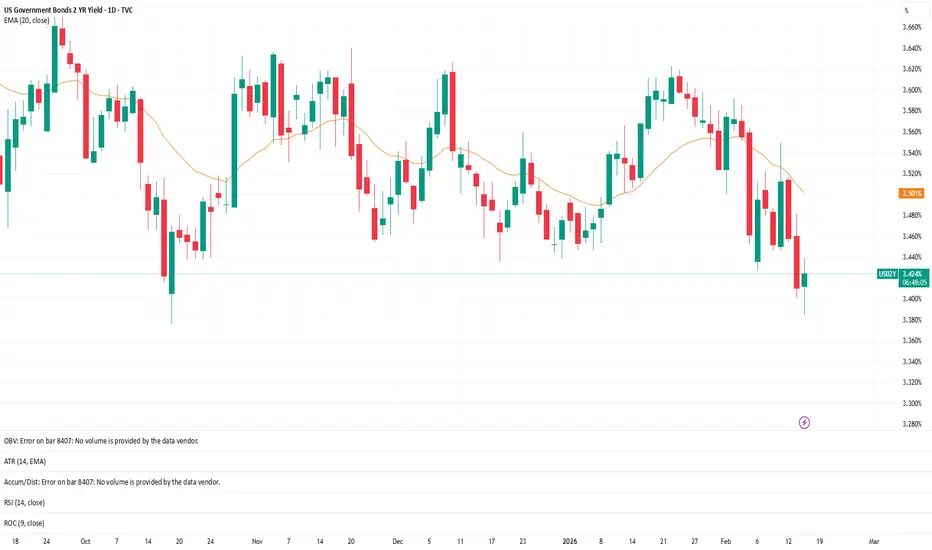
This chart shows the U.S. 2-Year Yield on the daily timeframe, using the 20 EMA as a structural guide.
Rather than predicting direction, the goal is to understand behavior.
What the 20 EMA Represents
• When price holds above the 20 EMA, short-term rate pressure is building
• When price loses the 20 EMA and fails to reclaim it, liquidity conditions begin easing
• Repeated rejection at the 20 often signals momentum exhaustion
• Sustained closes back above it can reflect renewed tightening pressure
Notice how structure shifts before equities fully react.
Short-term yields tend to move first.
Risk assets respond after.
This is not about trading rates directly.
It’s about understanding the backdrop.
When short-term yields trend higher:
→ Growth assets often face pressure
When short-term yields trend lower:
→ Liquidity conditions typically improve
Current Structure
Right now the daily structure is showing:
• Recent loss of the 20 EMA
• Lower highs forming
• Momentum cooling relative to prior swings
That reflects digestion rather than renewed tightening acceleration.
As always, this is structural observation — not a forecast.
The 20 EMA simply helps define whether liquidity pressure is expanding or compressing.
⭐ Final Clarity Note ⭐
Short-term yields reflect policy sensitivity and liquidity pressure in real time.
Long-term yields reflect growth and inflation expectations.
When both move in alignment, macro conditions tend to be stable and directional.
When they diverge, market character often shifts — volatility, rotation, or regime transition can emerge.
I’ll break down long-term structure separately.
This chart shows the U.S. 2-Year Yield on the daily timeframe, using the 20 EMA as a structural guide.
Rather than predicting direction, the goal is to understand behavior.
What the 20 EMA Represents
• When price holds above the 20 EMA, short-term rate pressure is building
• When price loses the 20 EMA and fails to reclaim it, liquidity conditions begin easing
• Repeated rejection at the 20 often signals momentum exhaustion
• Sustained closes back above it can reflect renewed tightening pressure
Notice how structure shifts before equities fully react.
Short-term yields tend to move first.
Risk assets respond after.
This is not about trading rates directly.
It’s about understanding the backdrop.
When short-term yields trend higher:
→ Growth assets often face pressure
When short-term yields trend lower:
→ Liquidity conditions typically improve
Current Structure
Right now the daily structure is showing:
• Recent loss of the 20 EMA
• Lower highs forming
• Momentum cooling relative to prior swings
That reflects digestion rather than renewed tightening acceleration.
As always, this is structural observation — not a forecast.
The 20 EMA simply helps define whether liquidity pressure is expanding or compressing.
⭐ Final Clarity Note ⭐
Short-term yields reflect policy sensitivity and liquidity pressure in real time.
Long-term yields reflect growth and inflation expectations.
When both move in alignment, macro conditions tend to be stable and directional.
When they diverge, market character often shifts — volatility, rotation, or regime transition can emerge.
I’ll break down long-term structure separately.

면책사항
해당 정보와 게시물은 금융, 투자, 트레이딩 또는 기타 유형의 조언이나 권장 사항으로 간주되지 않으며, 트레이딩뷰에서 제공하거나 보증하는 것이 아닙니다. 자세한 내용은 이용 약관을 참조하세요.
면책사항
해당 정보와 게시물은 금융, 투자, 트레이딩 또는 기타 유형의 조언이나 권장 사항으로 간주되지 않으며, 트레이딩뷰에서 제공하거나 보증하는 것이 아닙니다. 자세한 내용은 이용 약관을 참조하세요.