
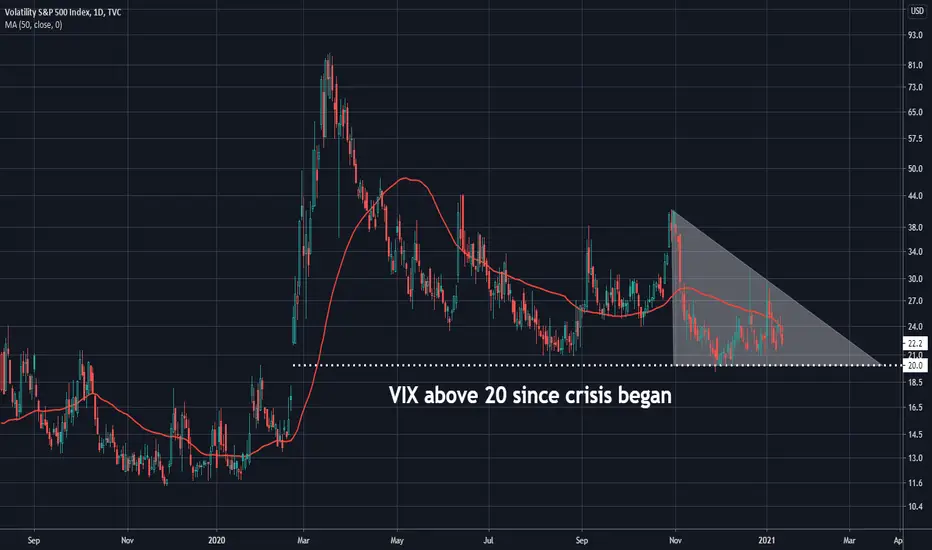
The volatility index has been falling all year, and now may be preparing for a push below the key 20 level.
This chart highlights the descending triangle on VIX. It began when the market slumped in late October, with another spike on December 21. There were additional lower highs on January 4 and 12.
VIX has also dropped in six of the last seven sessions and has remained consistently under its 50-day simple moving average (SMA).
Next is an important thing that never happened: The bears never followed up the S&P 500’s selloff on January 4. Instead, buyers stepped in below 3700 and quickly sent the index above 3800. The result? A bearish outside day morphed into a bullish outside week.
Last is the upcoming calendar of events. Earnings season officially starts on Friday, likely followed by significant stimulus from Congress. On top of that, we could also see things returning to normal as vaccinations continue to spread.
All those trends suggest that more positive catalysts may be coming. VIX could be under pressure as the news trickles in.
TradeStation is a pioneer in the trading industry, providing access to stocks, options, futures and cryptocurrencies. See our Overview for more.
This chart highlights the descending triangle on VIX. It began when the market slumped in late October, with another spike on December 21. There were additional lower highs on January 4 and 12.
VIX has also dropped in six of the last seven sessions and has remained consistently under its 50-day simple moving average (SMA).
Next is an important thing that never happened: The bears never followed up the S&P 500’s selloff on January 4. Instead, buyers stepped in below 3700 and quickly sent the index above 3800. The result? A bearish outside day morphed into a bullish outside week.
Last is the upcoming calendar of events. Earnings season officially starts on Friday, likely followed by significant stimulus from Congress. On top of that, we could also see things returning to normal as vaccinations continue to spread.
All those trends suggest that more positive catalysts may be coming. VIX could be under pressure as the news trickles in.
TradeStation is a pioneer in the trading industry, providing access to stocks, options, futures and cryptocurrencies. See our Overview for more.

관련 발행물
면책사항
해당 정보와 게시물은 금융, 투자, 트레이딩 또는 기타 유형의 조언이나 권장 사항으로 간주되지 않으며, 트레이딩뷰에서 제공하거나 보증하는 것이 아닙니다. 자세한 내용은 이용 약관을 참조하세요.
면책사항
해당 정보와 게시물은 금융, 투자, 트레이딩 또는 기타 유형의 조언이나 권장 사항으로 간주되지 않으며, 트레이딩뷰에서 제공하거나 보증하는 것이 아닙니다. 자세한 내용은 이용 약관을 참조하세요.