
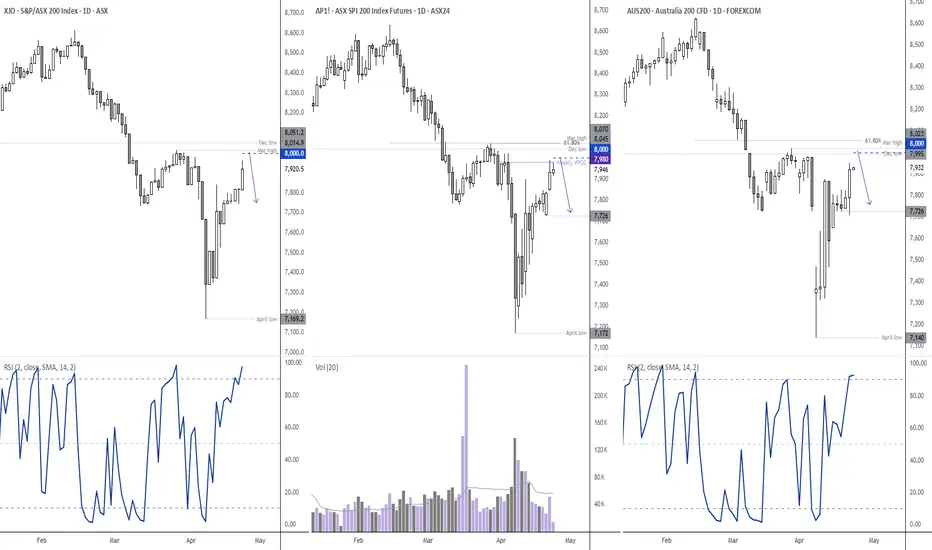
It can be useful to monitor several renditions of the same market, in order to identify higher probability support and resistance levels. And I would personally argue this becomes the more important if one trades CFDs exclusively.
Today I am comparing the ASX 200 cash market (XJO) and ASX 200 futures market (SPI 200, or AP1!) alongside the forem.com AUS200 CFD.
All three markets are approaching a key resistance cluster around 8,000. Neither the cash market nor futures market has broken above 8,000 yet and have several resistance levels (including a 61.8% Fibonacci ratio while the March low and December high) remain unbreached. Also note that futures volumes have been declining while prices rise, which shows a lack of bullish initiation (and also points to a short-covering rally).
Therefore, my bias is to fade into moves on the AUS200 should it breach its own 8,000, with the short bias becoming invalidated with a break above the 61.8% Fib level.
Matt Simpson, Market Analyst at City Index and Forex.com

관련 발행물
면책사항
해당 정보와 게시물은 금융, 투자, 트레이딩 또는 기타 유형의 조언이나 권장 사항으로 간주되지 않으며, 트레이딩뷰에서 제공하거나 보증하는 것이 아닙니다. 자세한 내용은 이용 약관을 참조하세요.
관련 발행물
면책사항
해당 정보와 게시물은 금융, 투자, 트레이딩 또는 기타 유형의 조언이나 권장 사항으로 간주되지 않으며, 트레이딩뷰에서 제공하거나 보증하는 것이 아닙니다. 자세한 내용은 이용 약관을 참조하세요.