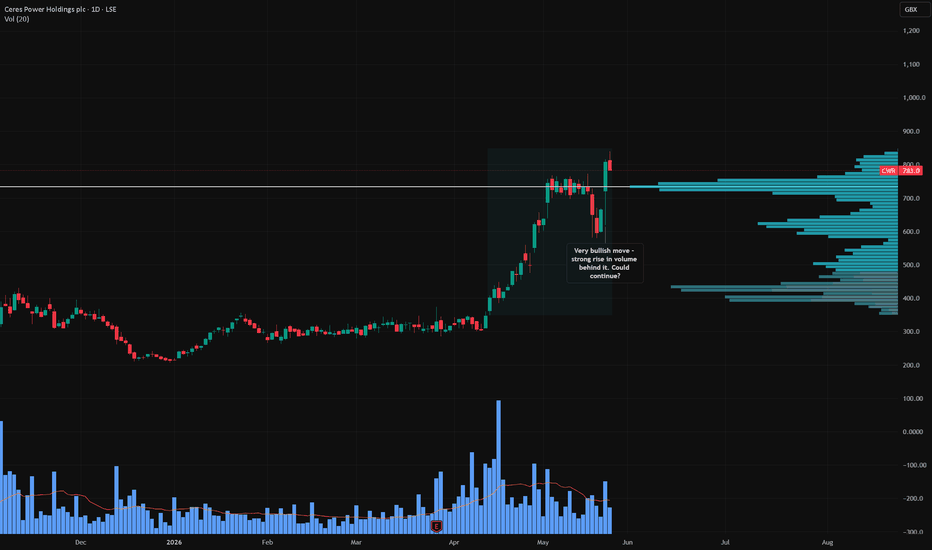
CWR is the 21% gap up a signal of a fresh hydrogen momentum run?Incredibly my screener has never picked up on this one this year, which is a shame because I have missed out on some impressive gains. I participated in a similar hydrogen name, ITM Power, a little while ago. Both experience wild swings driven by pure speculation in green energy. They offer great trading opportunities if you can get on the right side of the momentum.
Zooming out for detail, the stock has spent a week in a tight compression phase.
Friday shattered that ceiling. We saw a powerful gap up at the opening bell, with the price closing right at the dead high of the daily range. The effort from the buyers was validated by a credible spike in volume, showing a clear imbalance of demand over supply.
When a stock breaks out of a flag pattern on expanding volume, the path of least resistance is heavily skewed to the upside. It could easily continue further into this clean air. One to watch.
Candlestick Analysis
EURJPY AND GBPUSD ANALYSISHey Traders
in this quick video we did a break down of 2 pairs, EURJPY has been in a bullish type move for a while ow and with the pair trading above and retesting a resistance zone we could be expecting further push to the upside; While on GBPUSD we can see that price traded into one o the reversal/ confluence zone and we saw a sharp sell of breaking below the trendline area of support and also the daily closing as an engulfing which is a sign that sellers are now present in the market
BTCUSD Weekly Price Action OutlookThe weekly time frame momentum has shifted from bullish to bearish. However, looking at the three bearish candles, the bearish hammer candle shows that buyers stepped in and attempted to push price higher. The following week’s candle is bearish, but it still does not show clear signs of strong bearish momentum yet.
Based on my analysis, I believe price may simply be correcting before another bullish run. The next confirmation I would be looking for is price holding above the bottom gap and forming green weekly candles in the coming weeks. That would be the first sign that this move was potentially just a correction before price trends back upward again.
Price action is the first thing I am analyzing.
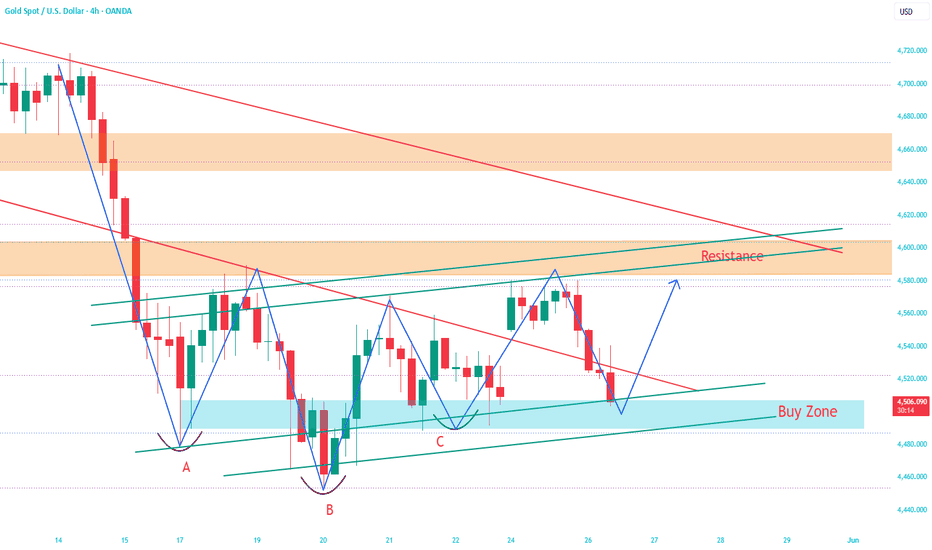
Gold bulls aren’t done yet , another rally may be loading!Gold has pulled back to the 4505-4485 range for the second time today, which I believe presents a second opportunity for us to go long on gold.
Gold prices fell back after touching around 4580 during the day, reaching a low of around 4500 before rebounding to around 4531. Unfortunately, the rebound did not continue, and prices fell back to around 4500 again. Clearly, there is significant upward pressure, which is why gold has encountered resistance multiple times around 4580, and the rebound highs are gradually decreasing. However, it cannot be ignored that although gold is generally weak, the support below still shows remarkable resilience, and the strength of the support below is also strong.
From a technical perspective, gold retraced to around 4500, and the gap was technically repaired, completely closing the gap left below in the technical structure. In addition, the recently formed inverted head and shoulders support pattern has not been effectively broken, and it has not even fallen below the second low of the right shoulder. The support provided by this structure remains significant in the short term, and gold may still rebound to the 4530-4550 area, or even the 4580-4600 area, thanks to this structural support.
Short-term technical support levels: 4500-4480 / 4460-4440
Short-term technical resistance levels: 4540-4560 / 4580-4600
Therefore, regarding short-term trading, as I mentioned, since gold has retraced to the 4505-4485 area for the second time, I still maintain my stance of going long on gold again within this area.
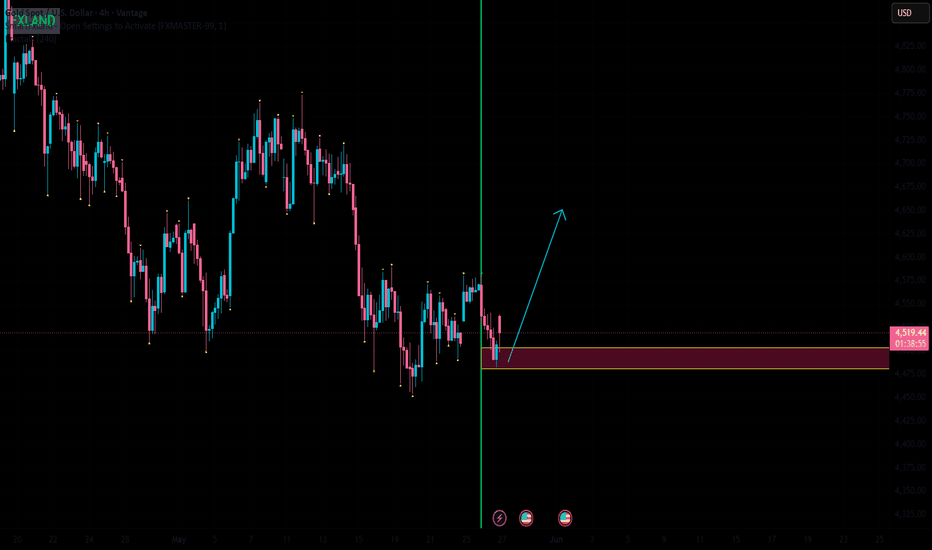
SmartFxland New Analysis on XAUUSD H4Hey Traders! On the H4 timeframe, price is currently holding above the highlighted support zone after failing to achieve a confirmed breakdown below the box area.
The lack of continuation to the downside suggests that selling pressure may be weakening within the current higher timeframe structure.
As long as price continues to hold above the highlighted zone, the possibility of a longer-term bullish recovery and movement toward higher levels remains valid based on the current market reaction and structural behavior visible on the chart.
The projection is based on higher timeframe price structure, support reaction, and market timing observations directly shown on the chart.
Shared for educational purposes only. Not financial advice.
THE 3-SECOND TRADE CHECKLIST✅ THE 3-SECOND TRADE CHECKLIST
Not because of strategy.
Not because of indicators.
But because traders skip structure, confirmation, and risk checks.
Before every live trade, ask yourself:
1️⃣ Is the structure clear?
• HH/HL or LH/LL?
• Trend aligned?
2️⃣ Is there confirmation?
• EMA rejection?
• Momentum candle?
• Pullback entry?
3️⃣ Is the risk controlled?
• Correct lot size?
• Stop loss defined?
• Minimum 1:2 RR?
If one is missing:
❌ No trade.
Discipline protects capital.
Patience protects consistency.
🛡️ Structure first → Confirmation second → Execution last
#Trading #Forex #XAUUSD #Gold #TradingMindset #Discipline #SentinelCore #PriceAction
Day 64 of 90 — Bearish Continuation Into Recovery Attempt🛡️ Day 64 of 90 — Bearish Continuation Into Recovery Attempt
XAUUSD | M15 | Sentinel Core | Sentinel Structure | Sentinel Companion
Situation
• Price rejected aggressively from premium liquidity near 4,578–4,580 after failing to sustain bullish continuation
• Sellers reclaimed short-term EMA control and delivered sustained bearish expansion throughout the session
• The market later reacted from discount liquidity near 4,485–4,490, producing a short-term recovery attempt
👉 Higher timeframe structure remains bearish while price trades below the 200 EMA near 4,535
What This Chart Shows
• Clear transition from bullish continuation into bearish market structure failure
• Shift from HH/HL continuation into sustained LL/LH bearish continuation
• The 21 EMA and 50 EMA acted as dynamic resistance throughout the selloff
• Current price is attempting recovery into short-term resistance near 4,508–4,512
👉 Recovery rallies inside bearish structure remain vulnerable until resistance breaks and holds
🟦 Phase 1 — Premium Rejection & Structural Breakdown
The session began with exhaustion near premium liquidity:
• Price failed to sustain continuation above 4,578 highs
• Buyers lost momentum after multiple failed HH attempts
• Sellers reclaimed short-term EMA control and triggered structural breakdown
• Bearish expansion accelerated once price lost the 21 EMA
👉 Bullish structure invalidated once HL protection failed during premium rejection
🟩 Phase 2 — Bearish Continuation Delivery
Bearish momentum strengthened progressively:
• Multiple LH formations developed during intraday continuation
• The 21 EMA consistently rejected recovery attempts
• Momentum expanded aggressively as liquidity continued rotating lower
• Sell-side delivery extended into discount liquidity near 4,485–4,490
👉 Strong bearish trends suppress recovery attempts through repeated LH formation
🟨 Phase 3 — Current Market Condition
Current market condition shows short-term recovery inside bearish structure:
• Buyers reacted from discount liquidity after downside exhaustion
• Price reclaimed the 21 EMA during late-session recovery
• Recovery is now approaching resistance between 4,508–4,512
• Bearish structure remains valid while price trades below the 200 EMA near 4,535
👉 Recovery inside bearish structure is not automatic reversal confirmation
Key Lesson
Do not confuse recovery momentum with confirmed reversal.
Do not buy directly into bearish resistance zones.
Wait for structure to reclaim and hold above key resistance before assuming continuation.
Momentum without structural confirmation creates emotional entries.
Execution Note (Sentinel Core)
• Respect bearish resistance near 4,508–4,512
• Watch whether HL protection can develop above 4,500
• Structure first → confirmation second → execution last
🛡️ No confirmation = No trade
Sentinel Principle
You do not trade emotional reactions.
You trade confirmed market structure.
🛡️ Patience > Excitement
Series Note
Building consistency through structure recognition, not prediction.
TradingView Tags
#XAUUSD #Gold #PriceAction #MarketStructure #SentinelCore #Intraday #Scalping #TradingView
NZDCHF SHORTsMarket structure bearish on HTFs 3
Entry at Both Weekly and Daily AOi
Weekly Rejection At AOi
Daily Rejection at AOi
Previous Daily Structure Point
Daily EMA retest
Around Psych Level 0.46000
Touching EMA H4
H4 Candlestick rejection
Rejection from Previous structure
TP: WHO KNOWS!
Entry 115% TPT 120%
REMEMBER : Trading is a Game Of Probability
: Manage Your Risk
: Be Patient
: Every Moment Is Unique
: Rinse, Wash, Repeat!
: Christ is King.
OKB: local squeeze with $108 destinationThe Macro Picture 🗺️
After a deep flush to the $60 macro floor in February and a violent reclaim spike toward $125, OKB has spent nearly three months coiling inside an $80–$92 accumulation box. This kind of prolonged structural reset typically clears out over-leveraged shorts and rebuilds liquidity at both edges of the range — a textbook playground for the next directional impulse. Price is now breaking the upper boundary with conviction, and the path of least resistance is opening toward the next macro level.
The Setup ⚙️
The Squeeze: The $80–$92 box compressed volatility for nearly three months while the structure quietly absorbed sell pressure. The latest impulse cleared $92 on expanded range, signaling that bulls are no longer defending — they are advancing.
The Trigger: The breakout candle pushed price to ~$96 with RSI snapping to the overbought side near 75. As indicated by the white projection, a pullback to retest $92 as the new support flip is the high-confluence continuation scenario.
The Support Flip: The former range ceiling at $92 now converts into the immediate defense line. Bulls desperately need this level to hold on the first retest — a clean reclaim is what unlocks the path toward the macro ceiling.
The Roadmap: Primary target sits at $108 — the macro ceiling that has capped every rally since January and the next high-confluence resistance above the box. Invalidation: a sustained 1D close back below $85 would invalidate this bullish thesis and signal the breakout was a trap, dragging price back into the accumulation range.
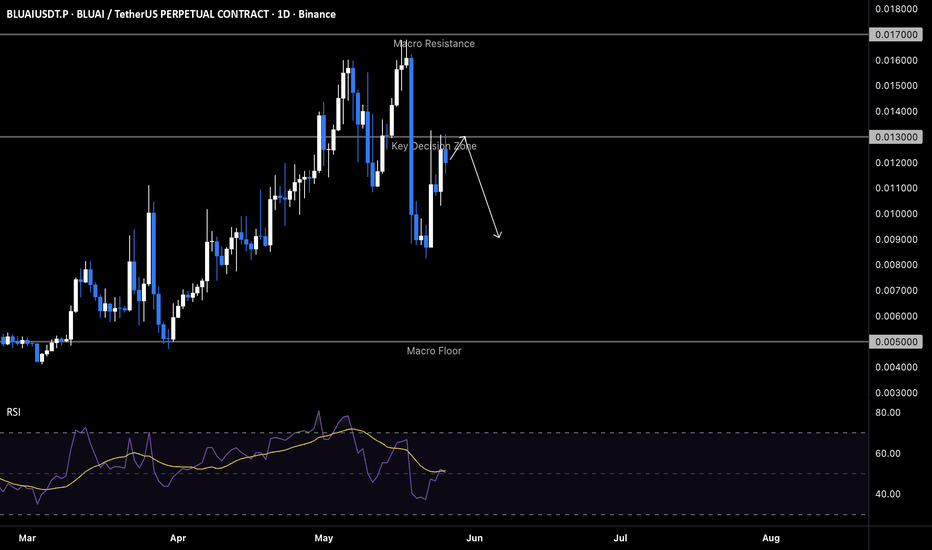
BLUAIUSDT: Bearish spike toward $0.0090The Macro Picture 🗺️
BLUAI just printed a textbook structural reset after the parabolic Jan-to-May expansion from the $0.0050 macro floor to the $0.01700 macro ceiling. That kind of vertical run desperately needs to be tested before any new leg can develop — the late-May flush into $0.0086 cleared out the most over-leveraged longs and harvested the obvious liquidity, but the structural damage at the highs remains unresolved. Price is now lifting back into the prior break zone, and this is exactly where bears tend to defend the path of least resistance with the highest conviction. The descending structure off the May peak makes the current recovery a candidate for a lower high, not a fresh trend continuation.
The Setup ⚙️
The Ceiling: The $0.01300 decision zone has flipped into structural resistance, capping the relief bounce and lining up with the macro lower-high carved out after the May rejection. This is the high-confluence zone where short pressure is most likely to load.
The Rejection: As indicated by the white projection, price is fading off the underside of $0.01300 while the RSI MA rolls down through 50 — momentum is bleeding before the bulls can reclaim trend control, and the most recent candles already show wick rejection inside this band.
The Trigger: A sustained 4H acceptance below $0.01100 confirms the rollover and opens the door for the impulse leg, trapping breakout buyers who chased the bounce off the sweep.
The Roadmap: Primary target sits at $0.0090 — a retest of the late-May liquidity sweep low where buy stops were already triggered and resting demand sits clearly defined. Invalidation: a clean 1D close above $0.01300 would invalidate this bearish thesis and re-open the path toward the $0.01600–$0.01700 supply.
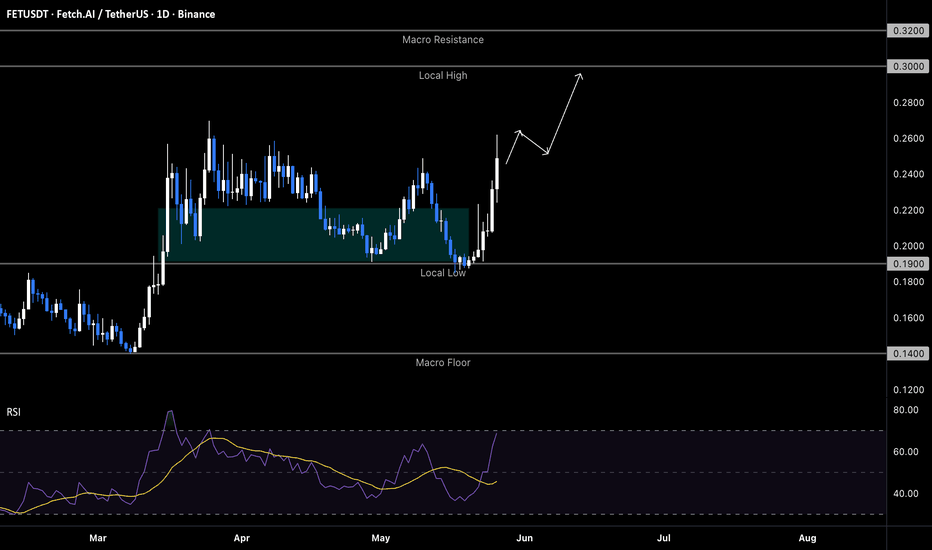
FETUSDT: local squeeze with $0.30 destinationThe Macro Picture 🗺️
FETUSDT has spent the last two months carving out a structural reset between the $0.14 macro floor and the $0.30 local high. The teal pocket between $0.19 and $0.22 became a high-confluence accumulation zone — exactly the kind of base-building that desperately needs to be tested before a directional move resolves. With price now closing decisively above the upper edge of that pocket and RSI pushing above 70, the path of least resistance has flipped upward.
The Setup ⚙️
The Accumulation Zone: The structural pocket between $0.19 and $0.22 absorbed weeks of supply, creating a textbook foundation for staggered, averaging-based entries during the build-up phase. Bulls successfully defended the $0.19 local low on two separate liquidity sweeps before momentum flipped.
The Trigger: The clean break above $0.22 with expanding daily range is the structural confirmation — over-leveraged shorts that stacked positions inside the range are now being squeezed out, fueling the impulse toward $0.26.
The Reaction: As indicated by the white projection, the roadmap points toward an initial pullback into the $0.22–0.24 area to test the broken ceiling as new support. This retracement is where bears will attempt one last defense before $0.30 comes into play.
The Roadmap: Primary target sits at $0.30 — the local high cluster from January, which acts as the next structural ceiling and a natural magnet for buy stops resting above the range. Invalidation: a clean daily close below $0.19 would invalidate this bullish thesis and re-open the path back toward the $0.14 macro floor.
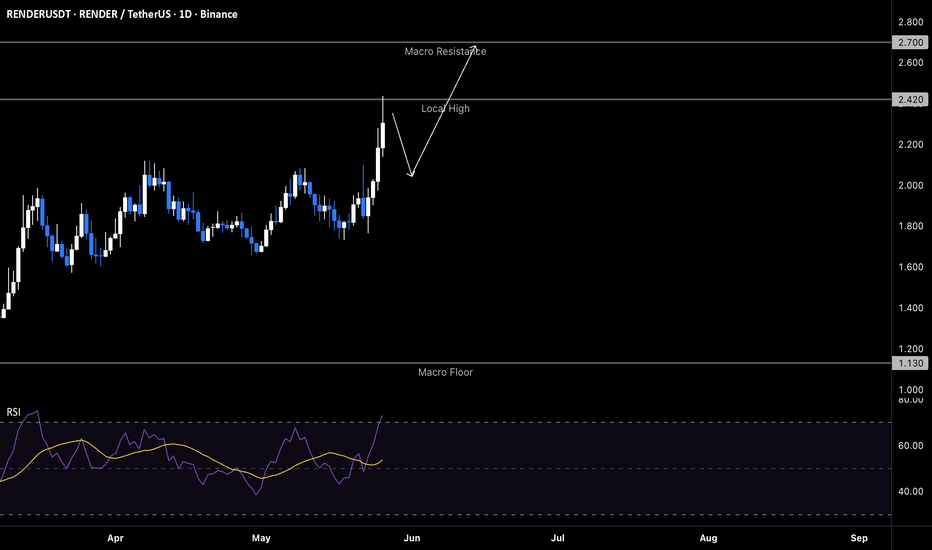
RENDER at macro ceiling: bullish continuation toward $2.70The Macro Picture 🗺️
RENDER has completed a textbook structural reset on the daily. The February capitulation flush to $1.13 cleared out over-leveraged longs, and what followed was three months of patient accumulation between $1.65 and $2.05 — the kind of base that desperately needs to be tested by a real impulse before larger players commit. That impulse is now in motion. Price has reclaimed the $2.05 ceiling and tagged $2.42 in a single push, with daily RSI rotating sharply through 70 — momentum is engaged but not yet exhausted. The roadmap points toward the macro ceiling at $2.70, the January structural peak that still stands as the last untested resistance on this leg.
The Setup ⚙️
The Support Flip: The $2.05 region that capped every rally from March through April has flipped into demand. A controlled pullback into this zone is the path of least resistance before the next leg — bulls are defending it, and the bears who faded the prior ceiling are now trapped on the wrong side of structure.
The Reaction: Price tagged $2.42 and pulled back into the $2.20 pocket — a healthy reaction, not a rejection. This local high is the immediate gate that needs to be reclaimed for the macro thesis to stay intact.
The Ceiling: The $2.70 macro resistance marks the January structural peak and a high-confluence zone where the last cycle of supply still sits unfilled. As indicated by the white projection, this is where the structural move resolves — either as a clean breakout opening fresh discovery, or as a rejection that resets the broader range.
The Roadmap: Primary target sits at $2.70 — a measured retest of the $2.05 support flip followed by continuation through $2.42 unlocks the macro ceiling. Invalidation: a sustained daily close below $1.95 would invalidate this bullish thesis and signal the breakout was a liquidity sweep rather than a genuine structural reset.
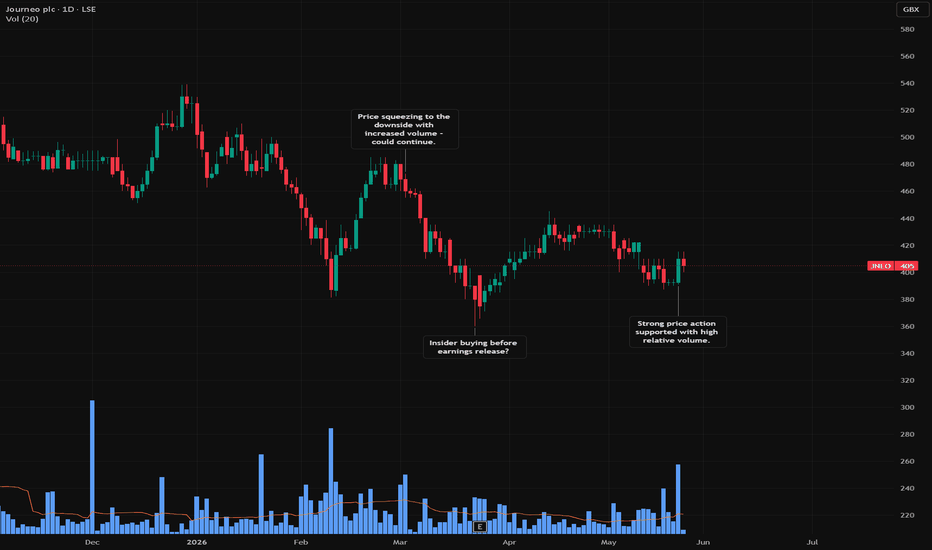
JNEO is the 3.5x volume surge a sign of strong hands stepping inQuite a few rotations with Journeo recently, creating multiple opportunities for astute traders out there.
We saw an interesting and strong move up around 4.4% on Friday. This was the direct result of a massive effort behind the move, with the volume print coming in at 3.5x the average.
Zooming out for context, the previous steep drop in March found a firm floor on high volume, suggesting structural buying. This recent price push confirms someone is aggressively finding value at these lows.
Could it retrace back up to the highs of the most recent consolidation zone? The current momentum says yes. The immediate overhead resistance is the line in the sand, but with volume validating the move, the buyers look like they are in control.
Price target: 480p
Potential reward: 17%
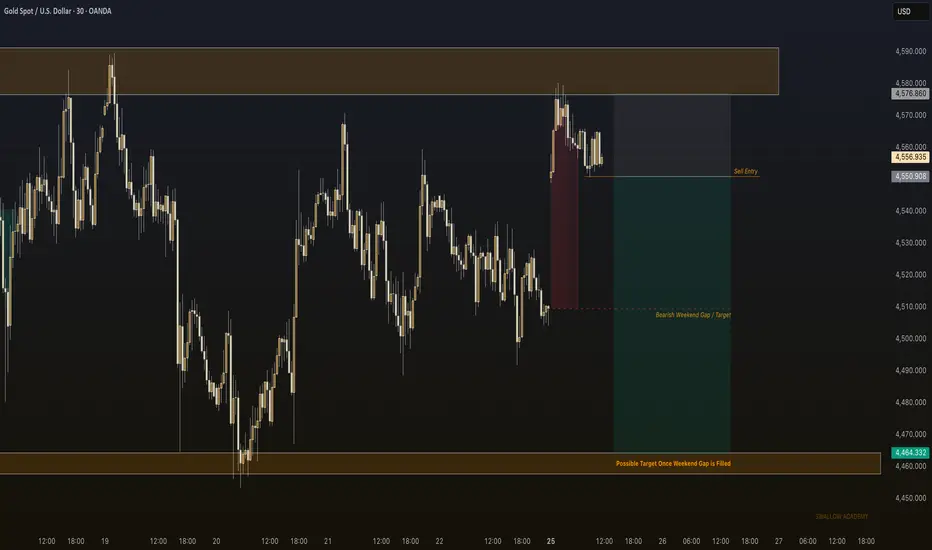
XAUUSD – Bearish Weekend Gap Open, Eyes on 4464 Gold has formed a bearish weekend gap, which we are looking to be filled.
Why This Level Matters:
Since the market opened, price has had a small decline that might turn into a proper market structure break.
Gameplan / Primary Scenario:
This would give us a good entry for the short trade we are looking for. Let’s see how it develops.
If this added value, boost it forward. What are your thoughts?
Swallow Academy
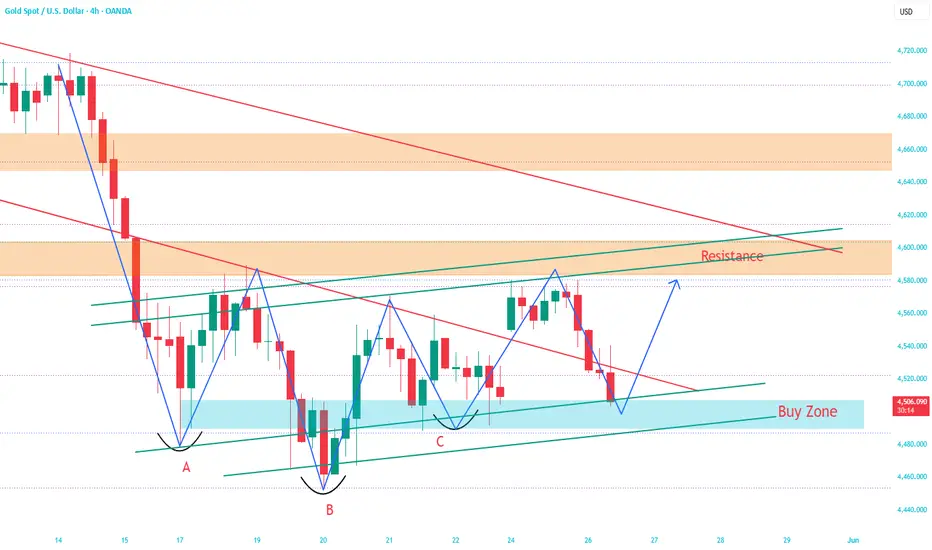
Buy gold: The gap has been filled, and a rebound is expected!As expected, gold retreated after touching around 4580, and our short position ultimately closed at the TP (transaction price) level. Gold prices have continued to fall below 4510, indicating significant upward pressure. It is unlikely that gold will have any outstanding performance in the short term. However, overall, gold is still in a range-bound market, and there are no conditions for a one-sided trend to emerge in the short term.
As gold's center of gravity gradually shifts downward, short-term resistance has moved down to the 4540-4560 area. It's worth noting, however, that although gold is trending downwards in the short term, the inverted head and shoulders technical support structure has not been broken, and there is still some buying support below, with short-term support in the 4500-4480 area. Furthermore, the short-term gap has been completely filled, and gold may see a rebound based on this support.
Short-term technical support levels: 4500-4480 / 4460-4440
Short-term technical resistance levels: 4540-4560 / 4580-4600
Therefore, in terms of short-term trading, I would first consider going long on gold in the 4505-4485 range; if gold rebounds as expected, the first resistance level to watch is the 4640-4660 range, which may be a potential entry point for short positions.
SmartFxland New Analysis on XAUUSD M15Hey Traders! On the M15 timeframe, price reacted below the highlighted resistance zone and failed to achieve a confirmed breakout above the box area.
The inability to break and hold above the upper boundary suggests that bearish pressure remains active in the current short-term structure.
As long as price continues trading below the highlighted zone, further downside movement becomes the more likely scenario based on the current reaction behavior and market structure visible on the chart.
The projection is based on short-term price action, resistance reaction, and timing observations directly shown on the chart.
Shared for educational purposes only. Not financial advice.
Gold — Dead Cat Bounce Into $$$$$ Supply | Short Targeting $4488Gold broke down from $4,720+ and bounced from the $4,488 demand base back into the $$$$$ liquidity cluster at $4,590–$4,598 — a classic dead cat bounce into resting sell orders. The oscillator panel confirms bearish divergence: price recovered but momentum is rolling over (signal fading, bear line ticking up). The red projected arrow on the chart seals the continuation lower thesis.
Entry: 4,563–$4,598 — $
$$$ liquidity cluster / short zone
Stop Loss: $4,648 — above supply zone base
TP1: $4,520 — structural midpoint
TP2: $4,488 — demand base retest
TP3: $4,440 — macro green demand block
Risk/Reward: ~3.3R to TP2 | ~4.5R+ to TP3
Confluences:
$$$$$ liquidity cluster = institutional short fill zone
Bearish oscillator divergence at rejection point
4H downtrend fully intact from $4,720 peak
Geopolitical bounce (US–Iran) being faded by structure — classic institutional behaviour
Red arrow projection aligns with measured move to demand
Trade management: 40% off at TP1, stop to breakeven, add on break below $4,488 targeting $4,440.
Invalidation: 4H close above $4,648 = supply reclaimed, exit immediately.
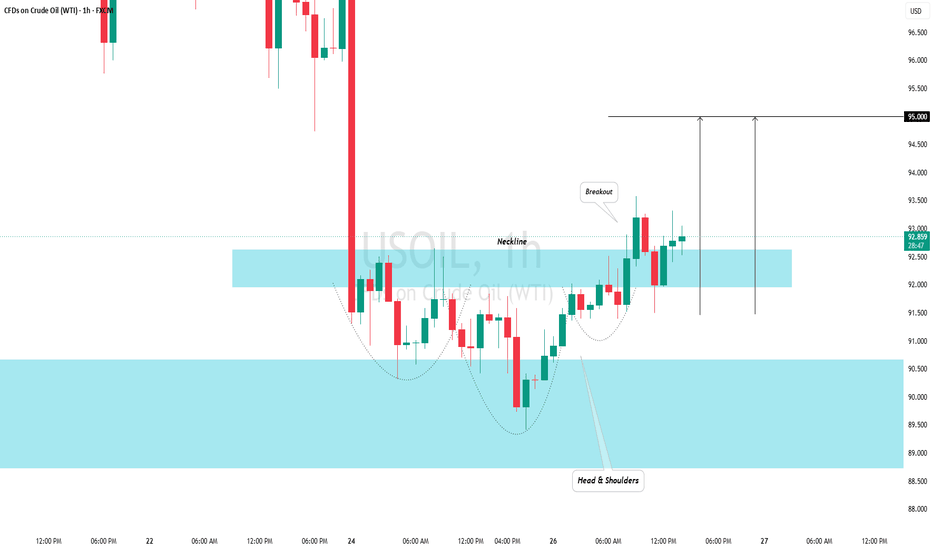
CRUDE OIL(USOIL): Bullish Reversal Confirmed?!Crude Oil formed an inverted head and shoulders pattern on an hourly timeframe following a test of a significant intraday support level.
The price successfully violate the neckline of this pattern earlier today and closed above it.
There is a high probability that the price will continue its upward trajectory and soon reach the 95.00 level.
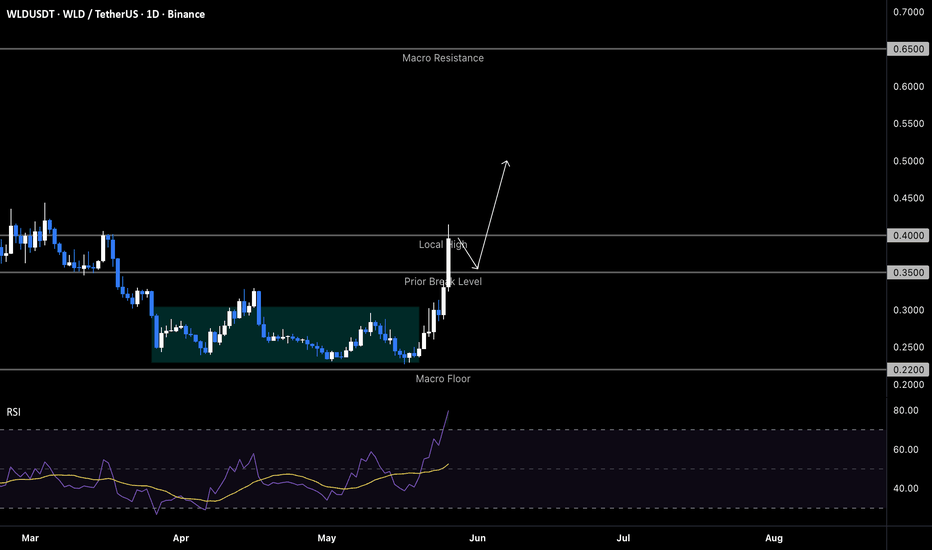
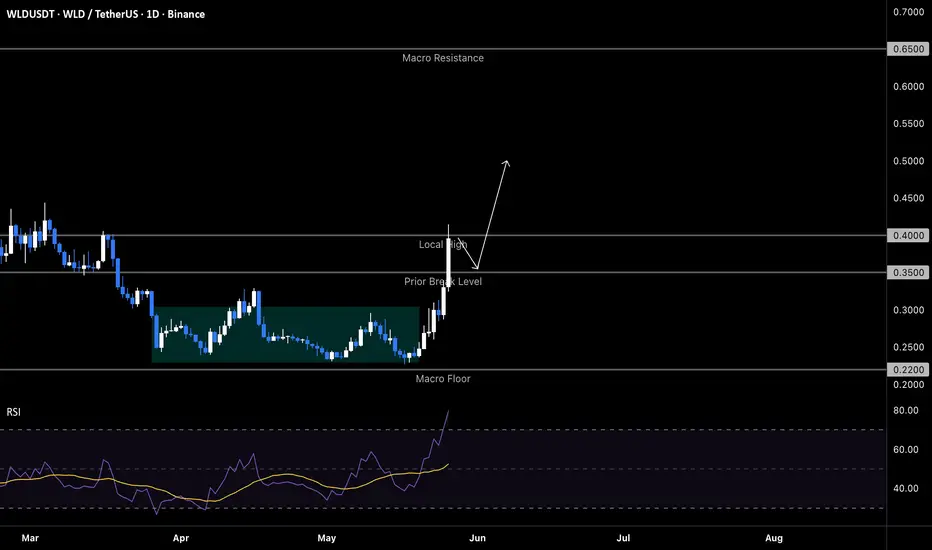
WLD: local squeeze with $0.50 destinationThe Macro Picture 🗺️
World had spent the better part of 2026 grinding lower inside a clean descending structure, bleeding from the $0.65 macro ceiling all the way down to the $0.22 macro floor. That kind of structural reset desperately needs to be tested from the other side — these are the conditions that spark powerful reversals once buyers reclaim control. The reclaim of the $0.22–$0.30 accumulation base marks the first higher-low confluence in months, and price has now pierced the $0.40 local high with a high-volume thrust candle, signalling that bulls are finally pressing the path of least resistance.
The Setup ⚙️
The Floor: The $0.22 macro floor held cleanly through April, absorbing the last round of late-cycle selling and clearing out over-leveraged shorts. This zone is now structural support — anything below it invalidates the entire bullish read.
The Trigger: The $0.35 prior break level was reclaimed with conviction, flipping months of overhead supply into a launchpad. The thrust through this zone arrived on a full-body candle, not a wick — confirmation that participation is real.
The Reaction: Price has tagged the $0.40 local high, the same level that capped the February consolidation. With RSI sitting near 80, a structural retest of $0.35 is the natural mechanic before any continuation move.
The Roadmap: Primary target sits at $0.50 — as indicated by the white projection, the roadmap points toward the untested supply pocket left behind during the January–February breakdown. Invalidation: a clean 1D close below $0.30 would invalidate this bullish thesis and signal a return into the accumulation base.
NVDAXUSDT at macro ceiling: bearish flush aheadThe Macro Picture 🗺️
NVDAXUSDT has just printed a structural peak at $240 after a near-vertical leg from the April flush at $165. This kind of acceleration into a macro ceiling rarely resolves cleanly — it desperately needs to be tested with a deeper structural reset before bulls can credibly attempt a breakout. Price now hovers near $220, caught between the freshly minted ceiling above and a long stretch of unfilled inefficiency below. The path of least resistance points lower, toward the prior breakout shelf where the leg up was born.
The Setup ⚙️
The Ceiling: The macro resistance at $240 is defended by aggressive rejection wicks and an exhausted RSI that cooled from 80 into the mid-50s. Bears are sitting heavy on every push back toward the highs, and the structure no longer has the energy to lift cleanly.
The Trap: As indicated by the white projection, a shallow relief move toward $230 looks engineered to trigger buy stops and trap breakout traders chasing continuation. This local high is a high-confluence liquidity pocket that the market desperately needs to clear out before the next directional leg can begin.
The Rejection: Once the $230 sweep is complete, the structure flips. A clean rejection from the local high opens the door to a faster unwind through the $215 shelf, where bulls have nothing left to defend and over-leveraged longs from the rally start unwinding into thin air.
The Roadmap: Primary target sits at $200 — the prior breakout shelf must be retested to validate the leg up and rebuild a credible floor underneath the structure. Invalidation: a sustained 1D close above $240 would invalidate this bearish thesis and clear the runway toward fresh structural highs.
EURJY ANALYSISHey Traders
After seeing the previous day break and retest our trendline area of resistance and also 185.00 key level. we can confirm that more buying orders are coming into the market and we could see a push to new highs. we still have a few areas of resistance to be traded above before we could expect our target area to be reached. the best thing to do is to be patient and wait