EUR Futures (6E) | H4 Bearish CypherPrice has rallied straight into a major confluence resistance zone on the 4H chart.
The current area around 1.1815–1.1860 stands out for three reasons:
completion of a harmonic PRZ
retest of a bearish order block
RSI pressing into overbought territory
That makes this region technically attractive for a bearish reaction.
Bearish scenario
As long as price stays below 1.1940–1.1950, I see room for a pullback. A rejection from the current PRZ could open the way toward 1.1690 first. If momentum ac
Cypher
CIFR Short-term analysis | Trading and expectationsNASDAQ:CIFR has completed the Elliott wave complex correction WXYXZ for wave 4 at the daily 200EMA, reclaiming the daily pivot. Bulls are back in control, but wave X $21.50 must be overcome for confidence.
📈 Daily RSI is nearing overbought with no divergences, so continuation of the uptrend is expected for now
👉 Analysis is invalidated below wave 4 and the trend line
Safe trading
CIFR Macro analysis | The bigger picture | Long-term holdersNASDAQ:CIFR wave 4 appears complete at the triple support: weekly pivot, HVN and 0.382 Fibs, popping above the trend line resistance and challenging the ATH. Price has yet to make a higher high on the macro structure, so it is still bearish until it gets above $21.50. Wave 5 has a target of the R2 weekly pivot at $37.71. Bulls are still in control with price above the weekly 200EMA and pivot.
📈 Weekly RSI is trending down from overbought, but has flipped bullish with no divergences
👉 Analysis
BTCUSD: Bullish Gartley Support Confirmed Targeting $155,627.72This is a follow-up to the previous bullish entry idea from 2 months ago at the bottom of the channel.
Over the last several weeks BTC has been putting in a bottom at the bottom of this channel both in terms of putting in a Double Bottom on the weekly timeframe and confirming a Bullish Inverted Hammer on last month's Monthly Close; in this time BTC has been taking back the 200-week moving average and given that BTC rarely stays below the 200-week Moving Average for long it is statistically li
Cypher pattern in makingSetup
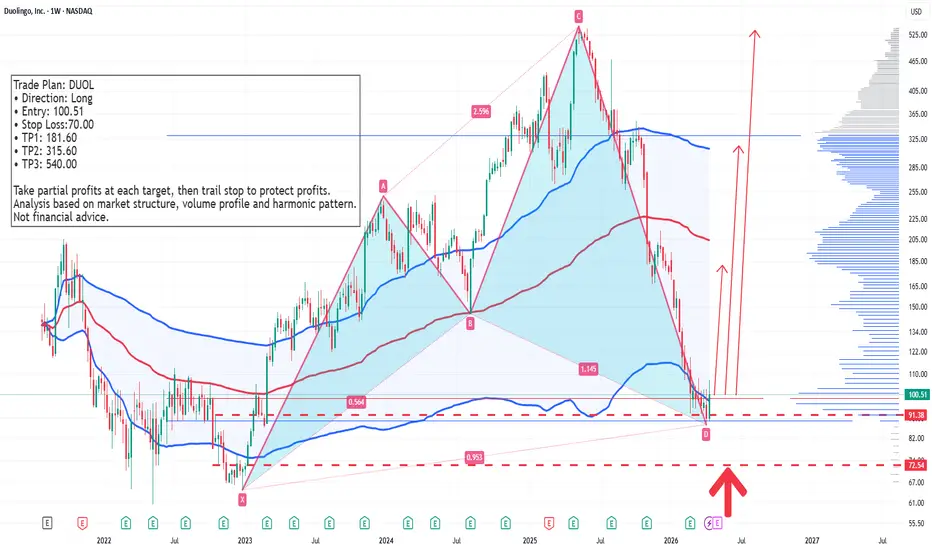
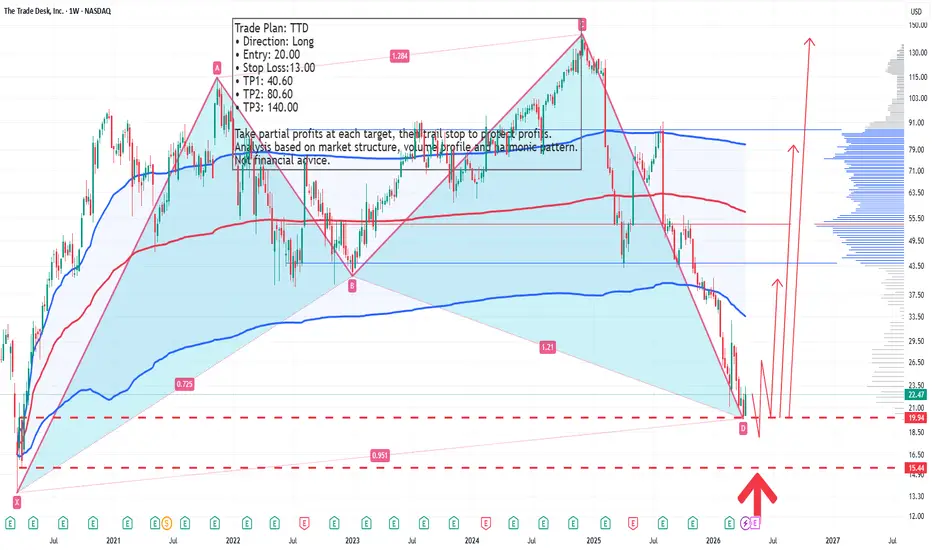
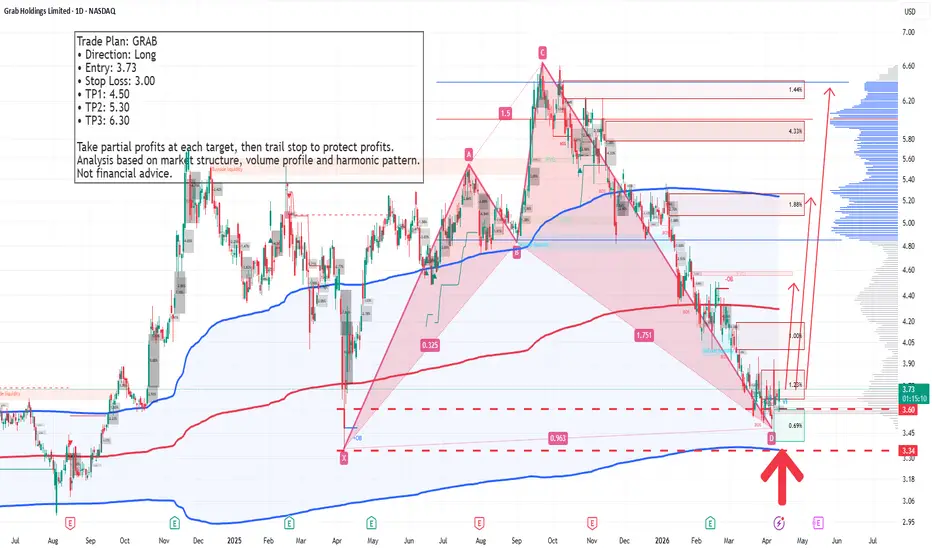
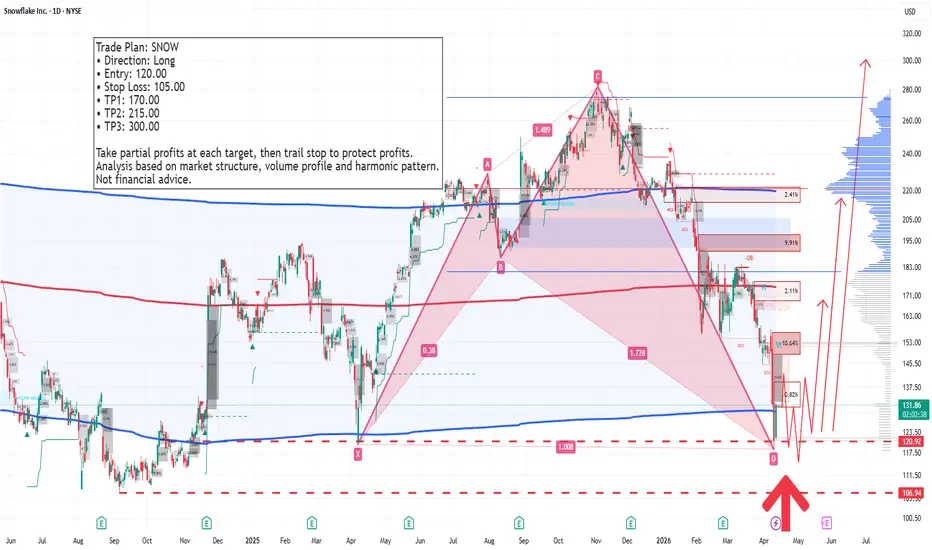
The Cypher pattern is a 4-leg reversal pattern that relies on specific Fibonacci ratios.
Here is how this specific setup validates:
B Point: Must be a retracement of the XA leg, typically between 0.382 and 0.618.
Here, it sits perfectly at the 0.618 level.C Point:
This is a "beyond" extension of the XA leg, reaching at least 1.272. On this chart, it pushed to 1.311, creating a higher high and trapping early shorters.
D Point (The Entry): The completion point occurs at the 0.786 retrace
BTCUSDT 4H Bearish Cypher: PRZ Hit, Reversal Toward 67k?BTCUSDT 4H — Bearish Cypher nearing completion, watch for rejection from PRZ
BTC is trading into a very clean bearish Cypher structure on the 4H chart, with price now pressing into the potential reversal zone (PRZ) around 72.8k–73.8k .
The structure is technically interesting because:
X-A defines the initial impulsive leg
B respects the retracement conditions and has not closed above the invalidation area
C swept deep enough into the lower support zone and stayed within accept
CIPHER Macro analysis | The bigger picture | Long-term holdersNASDAQ:CIFR remains in a wave 4, below the all-time high. Wave 4s are characterised by their drawn-out, shallow, volatile ranges, well known as the place where traders give their gains back to the market through impatience and false signals. Wave 4s usually end at the 0.382 Fib, $8.52, but can extend as far as the 0.5, aligning with the weekly 200EMA and HVN, so this is a high confluence area. Price is currently testing the weekly pivot as support and the upper trend-line of the previous trend
USDCAD SELL 1.4000On the daily chart, USD/CAD has stabilized and is trending upwards, with a short-term bullish bias. The current resistance level to watch is around 1.4000. This level represents a potential shorting opportunity based on a bearish cypher pattern; consider shorting once this level is reached.