BTC/USD: Wyckoff Accumulation Inside a ChannelI have been watching this structure building for a while now and honestly, it's getting interesting.
Back in early February we saw a massive flush down to the 60K zone- volume spiked hard, price whipped back equally hard. The action looks like a Selling Climax . The kind of move that shakes out weak hands and lets the big players quietly loading up.
The Automatic Rally followed pretty quickly, which is exactly what one would expect after the climactic action.
Then came the Secondary Test
Descending Channel
NZDCHF new bearish analysis
OANDA:NZDCHF first analysis shared ago few days its make 60PIPS, here is new analysis on NZDCHF and expecting one more bearish push. We having trend line breaked, CUP & HANDLE pattern visible and price is currently in DESCENDING CHANNEL.
SUP zone: 0.46300
RES zone: 0.45500, 0.45200
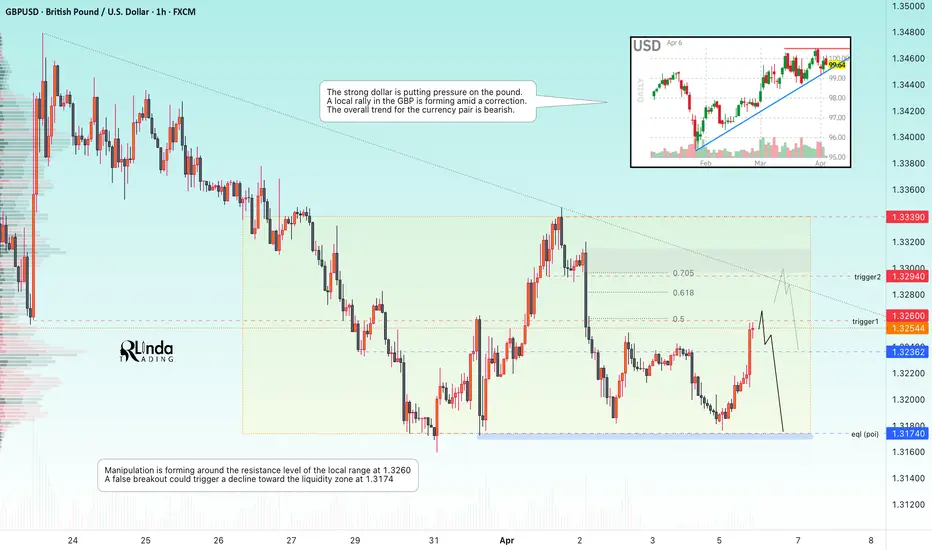
GBPUSD - The hunt for liquidity amid a downtrend FX:GBPUSD has been in a downtrend for three months. The strong dollar is putting pressure on the currency pair. The overall backdrop remains unchanged...
The dollar is forming a local correction amid a bullish trend, while the British pound is testing liquidity zones. Earlier on the daily chart, the market broke through the upward support structure, indicating weakness in the pound. The currency pair has been in a downtrend since late January, and from a technical perspective, the market i
GOLD - Price within a range, retesting resistance...ICMARKETS:XAUUSD ended last week on a mixed note, with half of the sharp decline recovered. The fundamental backdrop is complex; technically, there are bearish indicators.
On Friday, NFP data (+178K instead of -133K) and unemployment figures (4.3% instead of 4.4%) were released. The dollar closed the week on a generally positive note. Oil will continue to rise. Regarding economic data, it can be said that gold is under pressure.
Geopolitics: The situation in the Middle East is not going ac
BITCOIN - The hunt for liquidity ahead of a drop to 65000BINANCE:BTCUSDT.P is struggling to fulfill its role as a hedge asset. Consolidation continues amid a global bearish trend. The local market is seeking liquidity ahead of a decline.
The global structure is strongly bearish. Consolidation is forming ahead of an anticipated distribution phase. Locally, the price is forming a rebound from 66,200 within the trading range, aiming to hunt for liquidity before a decline. The market is currently not interested in the 66,200 support level; a local ascen
NZDUSD - A short squeeze amid a global downtrend FX:NZDUSD is forming a short squeeze as part of a counter-trend correction and is poised to decline within the broader bearish trend
Despite the correction, the dollar remains in an uptrend. If the index bounces off support, this will intensify the currency pair’s decline...
NZDUSD is forming a counter-trend correction against the backdrop of a long-term global trend. The price confirms the presence of resistance; the formation of a reversal setup and consolidation below 0.5769 could trigg
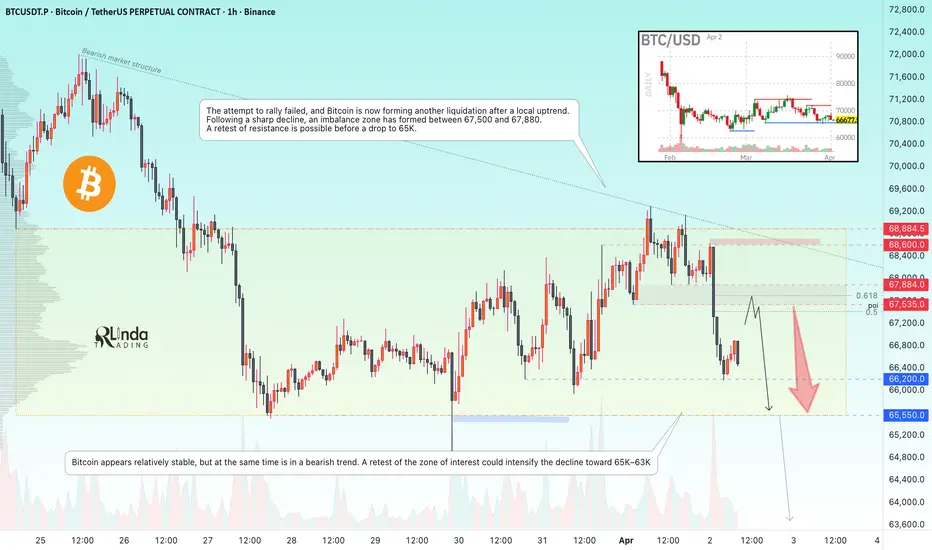
BTCUSDT - Retest resistance before a drop to 65K BINANCE:BTCUSDT is consolidating amid a global downtrend (crypto winter). At the same time, the price is holding below the upward support line, indicating market weakness...
Bitcoin looks relatively stable, but at the same time is in a bearish trend. A retest of the zone of interest could intensify the decline toward 65K–63K
The attempt at growth ended in failure, and Bitcoin is forming another liquidation after a local bullish trend. Following a sharp decline, an imbalance zone has formed
#AAVE Setting a Trap: Descending Triangle + Channel Confluence
Yello Paradisers! Are you prepared for a potential #AAVE price breakdown before the next major crypto market move unfolds?
💎#AAVE is currently forming a descending triangle pattern within a broader descending channel, which significantly increases the probability of a bearish continuation. We are likely seeing an Elliott Wave ABC or ABCDE structure developing. At this stage, we are patiently waiting for the completion of wave E, followed by a strong reversal candle with clear price action stru
Need to confirm support in the 1964.96 ~ 2111.42 range
Hello?
Nice to meet you, fellow traders.
If you "follow" me, you can always get new information quickly.
Have a great day today.
------------------------------------
(ETHUSDT 1D Chart)
This period of volatility is expected to continue until April 3rd.
After that, the direction in which it moves is expected to be a critical factor.
The next period of volatility is expected to begin around May 2nd.
However, since BTC's volatility is expected to occur around April 22nd (April 21st–23rd), w
Gold Defies the Peace Rally. $5,000 Back in Play?Gold just did something interesting. Equities surged, oil dumped nearly six bucks on Iran peace signals, and yet here's XAUUSD climbing 1.59% to 4,721. two-week highs. That's not how a fear trade is supposed to behave when the fear is fading.
The market is telling us something. This isn't about geopolitics anymore. It's structural.
Here's what's happening.
The macro picture
Powell's term expires May 15. six weeks out. Markets are already pricing a more dovish replacement, and the Fed's own
General Context (1H ETH/USDT)The market was in a descending channel (nicely drawn).
You are now at the upper boundary of the channel.
The price is currently testing:
~2110–2120 (local resistance + breakout from the mini structure)
simultaneously, the downward trend line.
👉 This is a key decision point.
📊 What I see technically
1. Market structure
We had:
lower highs ❌
lower lows ❌
BUT recently:
breakout from local consolidation
attempt to change the structure to a higher low → higher high
👉 First signal of a possible tre
#TON Triangle Collapse Confirmed—Brace for the Next Leg Down
Yello Paradisers! Are you prepared for what could be the most important move on #TON after this perfectly developing structure?
💎#TON has been forming a textbook triangle pattern, and the final Wave E now appears to be completed. What makes this moment critical is the fact that price is currently breaking below the lower trendline of the triangle, signaling that bearish pressure is starting to take control.
💎What adds even more weight to this setup is the strong confluence with the long-term
TShort
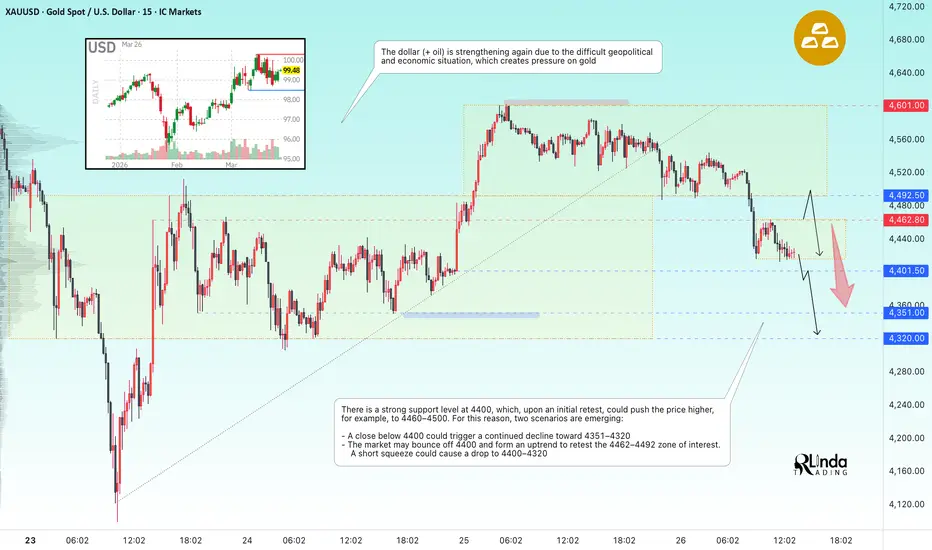
GOLD - Mixed fundamental data. Range: 4550 – 4600 ICMARKETS:XAUUSD is testing the 4,600 level within a local uptrend and forming a short squeeze. The market is under pressure from a global downtrend, a strong dollar, and high oil prices...
During his speech yesterday, Powell stated that long-term inflation expectations in the U.S. remain under control. However, it can be assumed that high oil prices will have an extremely negative impact on inflation and the markets...
Reports of a possible winding down of the U.S. military campaign again
XRPUSDT - Ready for a decline. Focus on 1.27–1.14BINANCE:XRPUSDT is preparing to transition from a consolidation phase to a distribution phase. The altcoin appears weaker than the broader market...
Bitcoin confirms the bearish market structure; against this backdrop, XRP looks much weaker than the flagship.
XRP maintains a local bearish trend that aligns with the global one. The altcoin is forming a trading range of 1.3612–1.3152 and is testing the support level. If XRP breaks below 1.3152, the decline could continue to 1.269, and then
Next Volatility Period: Around April 22
Hello?
Nice to meet you, fellow traders.
If you "follow" me, you can always get new information quickly.
Have a great day.
------------------------------------
(BTCUSDT 1D Chart)
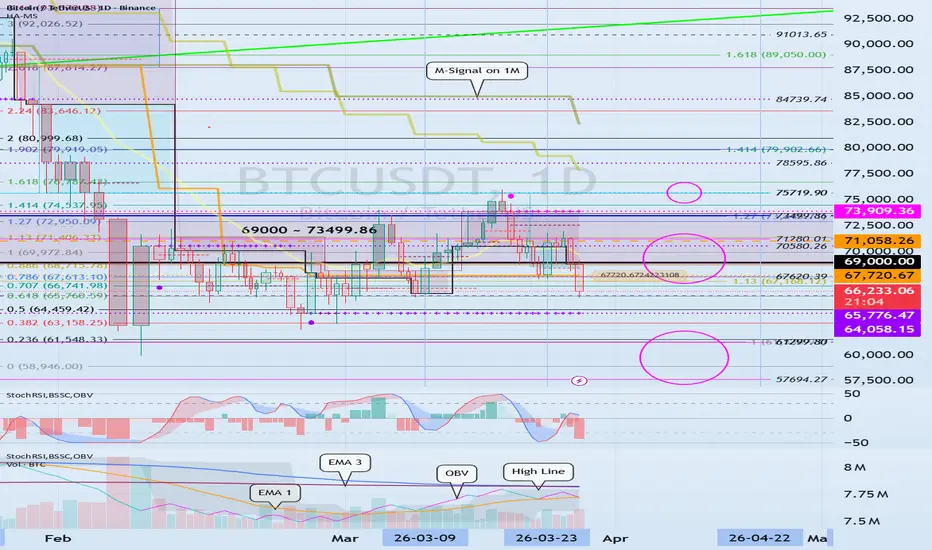
From a chart analysis perspective, the important range is between 69000.0 and 73909.36.
This is because if it falls below this level, there is a high probability that it will show a downtrend in the mid-to-long term.
Therefore, from a chart analysis perspective, I believe it is appropriate to explain countermeasu
GOLD - A countertrend correction before a decline ICMARKETS:XAUUSD is under pressure again at the start of the week. A counter-trend retest of the 4555–4600 range is forming amid a strong dollar and rising oil prices.
The conflict in the Middle East is escalating, and threats to global trade are mounting. Iran is preparing for a possible U.S. ground invasion of Kharg Island. With the risk of the Bab el-Mandeb Strait being blocked by Yemeni Houthis, such a blockade would further boost the dollar and oil prices, exerting enormous pressure
NZDUSD - Medium-term potential: a decline to 0.5658FX:NZDUSD , after breaking through support, is entering a distribution phase and is heading toward the liquidity zone. A bounce is possible before the decline continues
An active downtrend is in place; the currency pair (within the distribution phase) is aiming to test the key support level at 0.5711. Against the backdrop of a strong dollar, the NZD is facing selling pressure.
The market is in a bearish trend (against the backdrop of a strong dollar, which is poised to continue its rise).
GOLD - A short squeeze before the drop. Interest in 4435ICMARKETS:XAUUSD rolls back after a short squeeze at the daily level and closes the weekly session below 4,500. Fundamental factors, a rising dollar, and oil prices are putting pressure on the metal...
The geopolitical situation continues to escalate. The situation is complex; the West is trying to convince the public that there will be no ground operation in the Middle East, but all actual actions point to a protracted war. The dollar and oil may continue to rise in the medium term. Agai
ETHUSDT - The crypto winter continues. Support has broken down BINANCE:ETHUSDT is forming a counter-trend correction after hitting new lows. The market is reminded that it is still in crypto winter and may continue to fall...
Bitcoin is returning to a downtrend after a failed attempt to retest the 72K zone. Bears are dominating, and the downtrend continues.
Weak Bitcoin is negatively impacting altcoins
Ethereum may test the 2025–2038 liquidity zones. A short squeeze would provide a good signal for a potential decline. Earlier, Ethereum broke the supp
GOLD - The market is in a bear marketICMARKETS:XAUUSD is trading within the 5,351–5,480 range, but the outlook remains bearish. Bears continue to dominate the market as the dollar and oil prepare for an uptrend.
The situation in the Middle East is contradictory; despite rumors of negotiations, there are signs of an escalation.
Trump announced a 10-day extension of the pause in strikes on Iran’s energy facilities, but markets do not trust these statements and expect the war to continue.
Risks of escalation are boosting demand
EURUSD - The market is poised to break support. Downtrend FX:EURUSD is forming a pre-breakdown consolidation, the goal of which may be to break through the range support and the trend line...
The breakdown of support trend lines on the D1 chart indicates a weakening of the bullish trend and the formation of a U-pattern. Global trigger at 1.1400. If the main trigger is broken, the market may shift into a global downtrend.
Locally, the dollar is strengthening, which negatively affects the euro, which is already preparing for a decline within the ma
GOLD - The market is once again dominated by bears...ICMARKETS:XAUUSD tested the 4,600 level, but the retest ended in a short squeeze. The two-day rally was cut short amid renewed uncertainty surrounding the ceasefire talks in Iran.
Geopolitics: Tensions in the Middle East remain high. The parties cannot find a way to begin negotiations; the West’s 15-point ceasefire proposal is completely at odds with Iran’s five conditions.
The main question is: with whom is Trump negotiating if Iran is not participating...
Gold came under pressure amid e
BITCOIN - The bears held the 72K resistance level. Rebound BINANCE:BTCUSDT.P currently appears stable amid the chaotic market for indices, metals, and energy resources. Is this a hedge asset?
Bitcoin is bouncing off the 72K resistance level, and the market continues to keep the flagship asset in a downtrend. However, globally, Bitcoin looks fairly stable against the backdrop of other markets that are going crazy.
Technically, the price (locally) looks bearish. After rebounding from the trading range resistance, the price may test the local liqui