Economic Cycles
The Iron Leviathan: A Structural Analysis of Cyclical CrossroadsThe ocean does not care for your spreadsheet formulas, nor does it weep when your capital sinks into the deep. Five thousand winters ago, we read the stars and the flight of birds to survive the treacherous trade routes. Today, we read the candlestick charts of Maersk. This is an ancient empire built on modern steel, sitting at a fascinating cosmic crossroads where fundamental value meets brutal macroeconomic tides.
To understand this enterprise, an investor must look beyond short term price ac
Weekly review of XAUUSD Weekly Market Analysis
Gold #XAUUSD #XAGUSD
🔍 Macro Structure & SMT Divergence A powerful institutional shift has developed on the higher timeframes. Gold (XAUUSD) and Silver (XAGUSD) have officially locked in a weekly Sequential SMT Divergence. During last week's price action, Gold successfully executed a violent liquidity sweep, leaving behind a massive, high-volume rejection wick. Crucially, Silver failed to sweep its corresponding high. This non-confirmation mechanically flags a major insti
Bitcoin Cycle Analysis: Estimating the Bottom using RegressionIn our previous post, we used a straightforward cycle analysis based on weekly EMAs to estimate the next Bitcoin cycle bottom. You can read that analysis here .
In this post, we take a more advanced approach by applying polynomial regression. The full regression model can be found here . First we briefly outline how the model is constructed.
Model Construction:
For the bottom estimation, we use a cubic polynomial regression, defined by the function:
ax³ + bx² + cx + d
In this model x re
Bitcoin Cycle Analysis: Estimating the Next Bottom using EMA'sIn this post, we take a straightforward approach to estimating the potential cycle bottom for Bitcoin using the 100, 200, and 400 weekly moving averages. There is no need to always overcomplicate the analysis when simple historical patterns can also provide valuable insights.
Historical Observations
Looking at previous cycles, several consistent patterns emerge:
The 100, 200, and 400-week moving averages have historically acted as key levels of support and resistance.
In the past two cyc
MP Material | Wyckoff logicMarket Outlook: "At a Crossroads"
Current Bias: Slightly Bullish (60% Bullish / 40% Bearish)
1. Wyckoff Perspective (Accumulation)
- Structure: We have successfully completed the SC → AR → ST → Spring sequence.
- Status: A clear accumulation structure is in place. Following the Spring, we are currently seeing active demand entering the market, positioning us in the LPS (Last Point of Support) / SOS (Sign of Strength) phase.
- Takeaway: Smart money has likely initiated accumulation.
2. Tec
Scared of a Market Crash? Answer: SILVER, $SLV $AGQTVC:SILVER AMEX:AGQ AMEX:SLV Just like Gold exploded higher in late 2025 through early 2026 — delivering one of its strongest performances in decades with massive gains, repeated all-time highs, and prices surging well over $5,000/oz at peaks — TVC:SILVER , AMEX:SLV , AMEX:AGQ is perfectly positioned to follow the same pattern and potentially outperform it significantly.
While gold captured the safe-haven spotlight, silver combines monetary demand with powerful industrial leverage (sola
$BTC Rainbow Chart Analysis & Buy Signals: STH / RP / 200W SMAFirst blue dot of the cycle has appeared on the ₿itcoin Rainbow chart after PA got rejected from the STH 90EMA (short-term holder realized price of 155 days).
Now CRYPTOCAP:BTC makes its way down to inevitably test the 200SMA and RP 30EMA (Realized Price of ALL coins).
BUY SIGNALS will come when we get blue dots on the rainbow chart touching the 200SMA and RP.
Note: confluence comes when the 200SMA crosses above the RP, albeit it may be slightly early or late, but still gives plenty of sign
XAUUSD (12/05/26) long sentiment Hello everyone,
I am not typically a commodities trader, however I thought I'd provide a markup.
As we can see a large Double top high has formed, I have marked this PFH, many people would assume based of the size and severity of the formation that we will be seeing some rather exponential shorts.
In contrast, based on recent price action, specifically the low made in march, I believe that was the first leg of a reset. The extremity of the shift to the low, shows an inducement short. Price p
2140 is the estimated endpoint of BTC issuanceWhat happens if we project cyclical, geometric, harmonic, range-based, and chart-derived timing structures far into the future?
The strongest near-term monthly concentrations currently appear around 2026–2028.
But more interestingly, the models also begin detecting isolated far-future timing “islands” — clusters that tend to densify as time approaches.
A notable cycle nest appears around 2050, followed by isolated projections around 2065 and September 2085.
After 2100, the period between 211
AUD Cot extreme positioning unwindAUD/USD positioning is extremely crowded long (~85% long COT).
Price initially kept rising, but now rallies into ~0.718 are repeatedly failing.
Momentum and structure are weakening:
lower highs
weaker rebounds
MAs rolling over
price spending more time below resistance.
So the thesis is:
Crowded longs are no longer being rewarded, which may be the early stage of a positioning unwind.
BUT:
the unwind is not fully confirmed yet.
Confirmation comes if:
price breaks/accepts below ~0.709
rebounds stay
BTC Time and Price Clusters for JuneThis framework combines two structural components:
• Key timing windows (orange dashed lines)
• Multi-timeframe BTC price clusters grouped in $1,000 buckets
The idea is not to predict direction mechanically, but to identify where timing and structure become aligned.
The highest-quality reversals tend to occur when:
1. price reacts inside a dense cluster zone,
2. while having “clean air” ahead:
* no nearby high-density S&R clusters,
* and no immediate timing compression window approach
Long trade 🧠 SNAP MAP — XAUUSD Buyside Trade Idea
PAIR: XAUUSD
DIRECTION:🟢 Buyside
DATE: Mon 25th May 26
SESSION: LND Session PM
ENTRY TIME: 4.00 pm
ENTRY: 4556.49
STOP: 4544.76
TARGET: 4625.19
RR: 5.86
🧭 SNAP MAP
🧠 Bias 🟢 Bullish continuation bias
Price appears to be rotating higher after holding a key support base and reclaiming short-term fair value. The structure suggests a buy-side continuation map, not a reversal-from-high map.
Key-mapped locations:
4552 area → prior high / reclaim area
4536.16 to
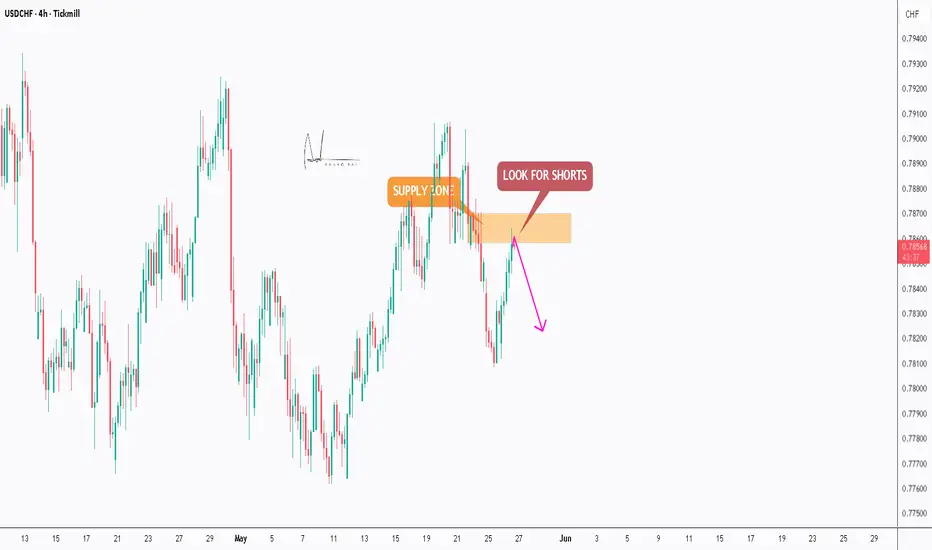
USDCHF - Supply Zone Rejection SetupHello Trading Fam! 👋
USDCHF is reacting from a key supply and resistance zone after a bullish pullback. The current rejection suggests potential short opportunities if sellers regain control and push price lower.
Don’t forget to like and share your thoughts in the comments! ❤️
160 Defense, Intervention Risk Remains but Bull Structure IntactWatching this pair closely from Tokyo today.
A few things standing out.
Current price: 159.15
Market Background:
- The Japanese government clearly wants to cap yen weakness
- They have intervened to defend the 160 level
- Despite intervention keeping markets nervous,
price is approaching 160 again
- Today, USD/JPY has been unable to break above 159.50
Structure Analysis:
- Long-term structure (520 & 20-period regression): Still pointing UP
- Mid-term (50-period regression): Turned D
Long trade
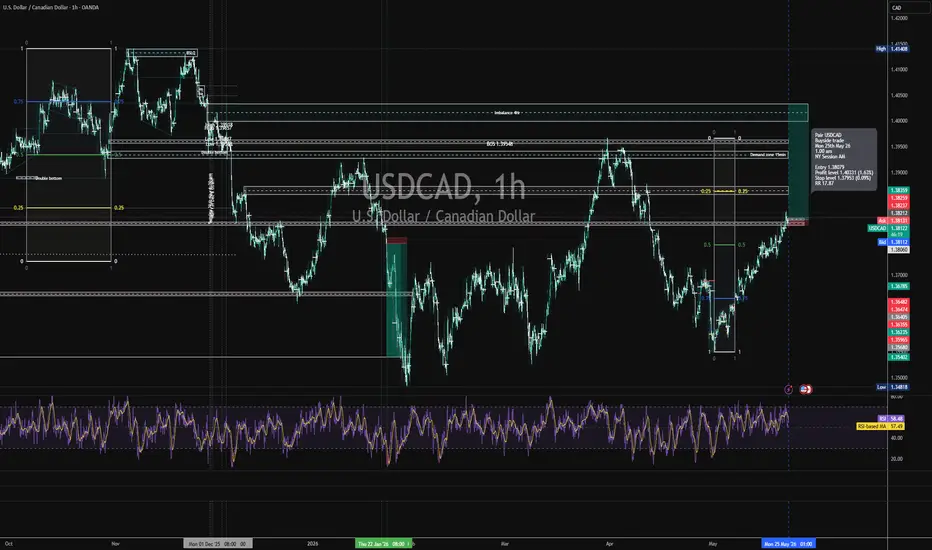
PAIR: USDCAD
DIRECTION:🟢 Buyside
DATE: Mon 25th May 26
SESSION:NY Session AM
ENTRY TIME:1.00 am
ENTRY:1.38079
STOP:1.37953
TARGET:1.40331
RR: 17.87
🟢 Bias: Buyside
USDCAD is rotating higher from the May discount base and building a cleaner bullish delivery model within the 4H/1H structure. The larger structure shows price recovering from the lower range, respecting higher lows, and pushing toward premium-side liquidity above 1.39670 and into the 1.40331 imbalance/target zone.
🟢 Buyside Range
Short trade
PAIR: GBPJPY
DIRECTION: 🔴 Sell-side
TRADE TYPE: Liquidity Sweep → Premium Rejection → Discount Delivery
ENTRY: 214.285
STOP: 214.544
TARGET: 212.638
RR: 6.36
🔴 Bias: Sell-side
GBPJPY has pushed into a premium / upper-range area around 214.20–214.50.
Price is showing rejection near the upper band after sweeping/attacking buyside liquidity.
The larger chart shows that the price has already made a strong upside rotation, but the current location is now expensive. This makes the sell-side idea
Short trade Pair: BTCUSDT
Direction: 🔴 Sell-side trade idea
Date: Sun 24th May 26
Session: LND Session AM
Entry Time: 9.00 am
Entry: 77070.3
Profit Level: 76062.8
Stop Level: 77287.2
RR: 4.49
👉 Core Read:
This sell-side idea is built on a rejection from the same upper premium zone
that previously completed the 23rd May buyside expansion.
→ 23rd May long completed in the 77100 area
→ 24th May London session pushes back into that upper zone again
→ Price fails to sustain above the premium / prior target ar
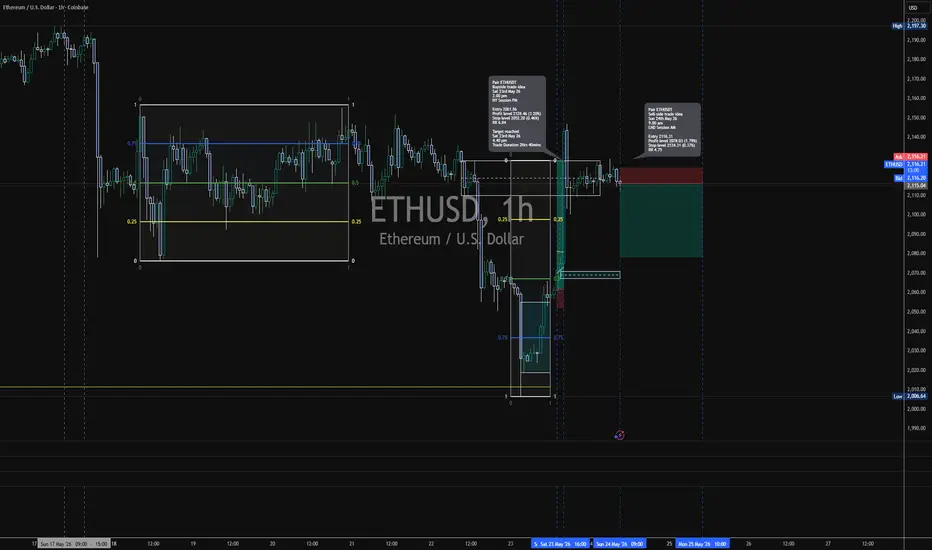
Short trade
Pair: ETHUSDT
Direction: 🔴 Sell-side trade idea
Date: Sun 24th May 26
Session: LND Session AM
Entry Time: 9.00 am
Entry: 2116.31
Profit Level: 2078.03
Stop Level: 2124.31
Risk: 0.37%
Profit Potential: 1.79%
RR: 4.75
Status:
Trade idea active / awaiting full downside delivery
🧭 SNAP MAP
Price rallied into upper intraday resistance
→ Liquidity was taken near the 2128 area
→ Price rejected back toward the 2116 zone
→ Sell-side entry activates at 2116.31
→ Stop protected above 2124.31
→ Downsid