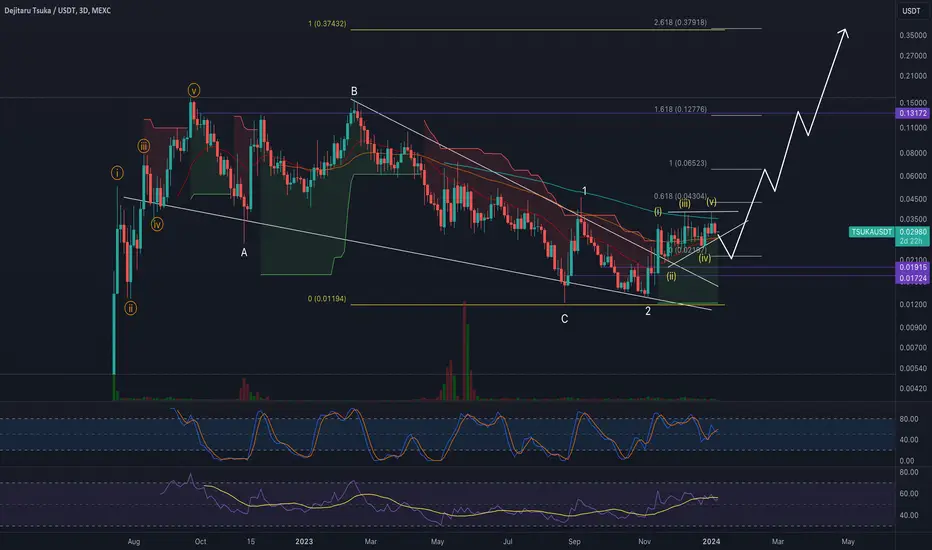
Beam, consolidation is coming to the end, buy now (151% profit)Beam Rank #69 is a very good-looking coin from a technical perspective. We had a strong pump of 500% In November 2023. Now the price is going sideways, but it is time for another pump. It's good to buy this coin right now, as it can skyrocket anytime soon. We have a strong Elliott Wave combo Impulse + ABC correction. 1.618 FIB extension is the next profit target, but I believe we will go much higher than that! Make sure you buy the right BEAM coin, as there are 2 with the same name. Let me know
Fibonacci Extension
STX is one of the best performing high-caps. Buy now?STX is a very important coin for Bitcoin. STX is a Bitcoin Layer for smart contracts. Why do I think you should buy this coin? We have to take a look at the price action first. We see that we have multiple similar swings high at around 1.75, which is a very bullish sign. From the Elliott Wave perspective, we see that we have a strong combo of (1)(2)(1)(2). The previous all-time high is the next stop, but I believe we will go much higher this year. You can hold it for the long term as well. Let m
Solana, another 100% pump in the next weeksSolana is very bullish. The uptrend is strong, and continuation to the upside is very likely because the ascending parallel channel holds the current price. I do not want to see a breakdown below this channel because that would be a very bearish sign on the other side. From the Elliott Wave perspective, we need to complete the impulse wave 12345. I am expecting a final wave (5) with a 100% profit in the next few days or weeks. Let me know what you think about my analysis, and please hit boost an
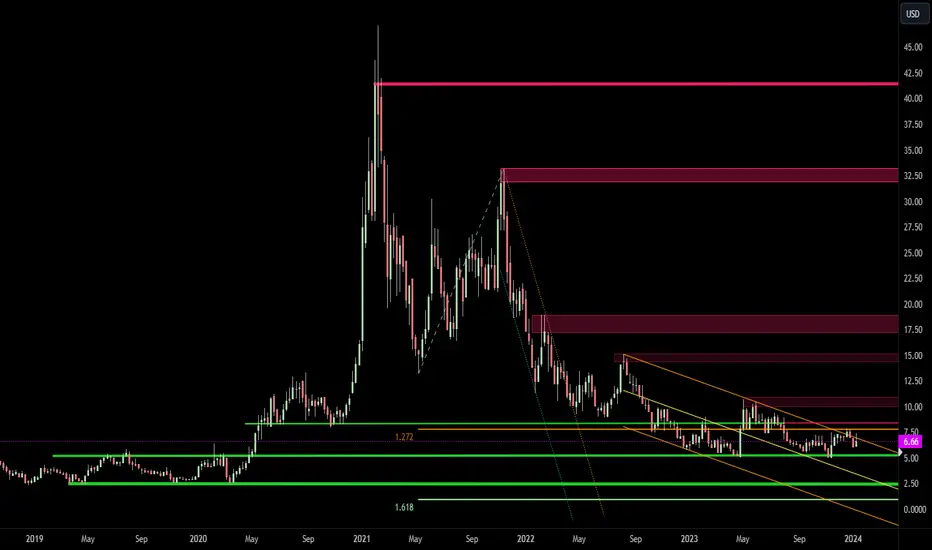
ATOMERA Weekly Technical AnalysisATOM Weekly - No RECOMMENDATION or ADVICE Status / EDUCATIONAL only - Support, Resistance, Trend Lines , Parallel Channels, Confluences, Clusters, Fibonacci Extension - Hope it Helps, Good Luck
DISCLAIMER - This communication is not trading or investment advice, recommendation or solicitation to buy, sell or hold any investment product is provided for informational, educational and research purposes only. All illustrations, forecasts or hypothetical data are for illustrative purposes only
NTRN is going parabolic, best altcoin for fast profit?NTRN is in a strong uptrend and it looks like we can go even higher. 207% profit is the next target for this coin because it is the 1:1 FIB extension. Currently the price is breaking out of the rectangle pattern on the weekly chart, which is also a good opportunity to trade the breakout. I am bullish on this coin. There is almost none bearish volume, also a good sign. Let me know what you think about my analysis, and please hit boost and follow for more ideas. Thank you, and I wish you successfu
NLong
ICP will continue in the parabolic trend, time to buy?ICP looks really strong; the uptrend just started, and I am expecting another 300% pump in the immediate short term. We can see that the price is moving in this ascending bullish parallel channel, and we have a lot of space for growth. From the Elliott Wave perspective, wave 3 is in progress, and wave 3 is usually the strongest wave. You do not want to miss this uptrend. Let me know what you think about my analysis, and please hit boost and follow for more ideas. Thank you, and I wish you succes
MOVR is breaking out! 1237% profit is possible?MOVR is extremely bullish; we have a bullish flag and a strong uptrend. We have 2 possible profit targets: the first is the 1:1 FIB extension, and the second is the 1.618 FIB extension. This coin is really hot when it comes to interest from retail traders. The ABC correction is complete, and I do not see any reason why we should go down from this point! A break of 30 USDT will lead to a massive pump to 111 USDT. Let me know what you think about my analysis, and please hit boost and follow for mo
BNB/USDT 1DIntervalBNB/USDT on a one-day time frame. We will start by identifying a downtrend line from which we can see how the price has gone up and is currently struggling to stay above this level.
Moreover, at this point we can see the formation of the Cap and Handle formation, which is characterized by a first large and a second smaller low, after which an upward price break can be observed. Moreover, the recent declines were caused by the bombardment of the media with negative information about the Binanc ex
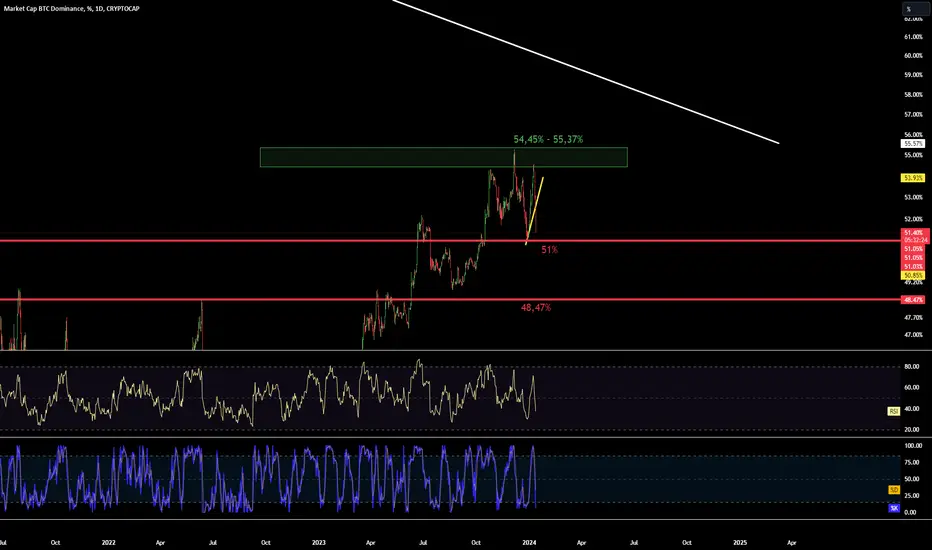
BTC DominanaceHello everyone, I invite you to every Friday's review of the leading cryptocurrencies, let's start by checking the situation regarding BTC's dominance over the rest of the market. We will start by defining, using the yellow line, a local upward trend that was dynamically interrupted by a sudden capital flow.
Moving forward, we will unfold the Fib Retracement mesh to check potential support locations. And here we can see that even the level of 0.618 golden FIB point was quickly broken, and curre
DOW - At ATH's 38k next Target. BLACKBULL:US30 is sitting at the top of the move with what is looking like one more move higher into 38k before we see a decent retracement.
In the smaller TFs there is a pattern setting up giving us potential upside targets.
I go into more details of these levels to watch in my group.
Once the high comes in we look at the retracement to see if its going to be bullish or bearish. But first we need a top, then we can go from there.
I hope this helps. Enjoy the week.
Bitcoin sell the ETF news. 20% crash is comingBitcoin is crashing after the BTC ETF launched on Nasdaq - iShares (ticker IBIT on TradingView). This is not looking good; the crash looks really strong on the 1-minute chart. Everyone bought into the ETF News, and now the whales are taking advantage of it and want liquidity at approximately 39k. Why 39? We can see multiple swing lows in this zone. I turned bearish on Bitcoin today. Let me know what you think about my analysis, and please hit boost and follow for more ideas. Thank you, and I wis
Ethereum is bullish and expecting a 27% riseEthereum is very bullish, in my opinion. We see that the price went below the parallel channel, but there is no bearish follow-through. In my opinion, this is a bear trap, and we will continue to go higher. 27% pump is my net target; take profit at the top of the trendline, as you can see in the picture. The good news is that the ABC correction has been completed successfully. It is starting, guys. Let me know what you think about my analysis, and please hit boost and follow for more ideas. Than
Bitcoin is ready to go higher to 48600 USDT. Here is whyBitcoin is ready to go higher. The price is inside this ascending parallel channel, and the bullish uptrend is intact. Usually, when you see an ascending channel on Bitcoin during a huge uptrend, it breaks to the upside. Let me know what you think about my analysis, and please hit boost and follow for more ideas. Thank you, and I wish you successful trades!
Bitcoin is the first decentralized, peer-to-peer digital currency. One of its most important functions is that it is used as a decentralize
TLong
A Confluence of Cup & Fib - Adani Ports :)For any script - When a News, Fundamentals and Technicals meet - then there its bound to
The recent positive ruling from the Supreme Court on the side of Adani Group against Hindenburg Report has definitely boosted Investor morale on all counters of Adani
From a Fundamentals perspective Adani Ports is a Rock Solid script as it has global presence in Physical Real Estate of each port and is continually trying to scale up across the world.
From Technical point of view on Monthly Chart:
1) Pr
EURUSD|Same direction with market trends and sales positionsAccording to the general structure, we realize that the sales pressure is still higher than the purchase transactions, so we mostly try to go along with the market trend with the sales transactions.
Returning from the support area, we wait to reach the specified resistance areas, which are valid price areas of 1.09629 and 1.10247. By seeing the appropriate confirmation, including stick candles, pin bars, and hammers, we can enter into sales transactions in these areas.
The support areas in my
Inventing the "Growth" Story of Inventure "Growth & Securities"Inventure - A leading provider of investment advisory service and distributes financial products like mutual funds, insurance products, etc.
The stock turned Multi-bagged when it multipled from 0.80 / Share to 6.75 / share in a matter of 22 months. Now - after a perfect 0.786 retracement on the Fibonacci scale - it is all set to beat its earlier bull run.
Here are the Technicals:
Fib 0.786 Retracement on Monthly
Perfectly following a Parallel Channel on monthly since 10 years
A beautiful
Fib Circles for LifeThis is my first educational post.
This is not long or short.
This is just fib circles.
This tool is great for non-linear support and resistance.
you can also draw horizontal lines at the top of each circle to make your traditional fib extensions and retracements.
these can be used on any timeframe just like your standard linear fib ext/ret
The biggest rule of thumb is to draw this shape on a 45 degree angle.
you can check angles with the info line if a swing low to high in any area of th
Why Fibonacci Works along with Ichimoku - $SPY - ExplainedYou read a lot about Fibonacci and realize it's everywhere but you doubt it. It is too good to be true. I present the chart where it shows that you gotta believe it. Well let's put it this way. If some believe in Fibonacci and trade accordingly it will move the market and that is exactly what happened today. I am still long on AMEX:SPY (I have gamble puts expiring Feb)
Still long because it respected the support. I believe it will be range bound as 476 is a huge resistance because if it cros
Validating $RIVN Ichimoku and Fibonacci - Trend AffirmedI want to validate RIVN on Ichimoku and Fibonacci.
The trend seems to be intact and not broken as it h as a big support at 20 as shown below. If it breaches the 26.8 resistance which is the Fib Resistance, it has to just fly from there.
Will watch closely and please provide the feedback
Navigating the Markets with Fibonacci ChannelsToday we delve into the fascinating world of Fibonacci Channels, a powerful tool for traders looking to identify potential non-horizontal support and resistance levels in the market.
Throughout the video, we provide a step-by-step guide on how to place Fibonacci Channels on price charts, allowing you to visualize and understand their significance in identifying key price levels. We also showcase real-world examples to demonstrate how Fibonacci Channels can be used to find points of interest, su