Bitcoin is ready to go higher to 48600 USDT. Here is whyBitcoin is ready to go higher. The price is inside this ascending parallel channel, and the bullish uptrend is intact. Usually, when you see an ascending channel on Bitcoin during a huge uptrend, it breaks to the upside. Let me know what you think about my analysis, and please hit boost and follow for more ideas. Thank you, and I wish you successful trades!
Bitcoin is the first decentralized, peer-to-peer digital currency. One of its most important functions is that it is used as a decentralize
Fibonacci Extension
TLong
A Confluence of Cup & Fib - Adani Ports :)For any script - When a News, Fundamentals and Technicals meet - then there its bound to
The recent positive ruling from the Supreme Court on the side of Adani Group against Hindenburg Report has definitely boosted Investor morale on all counters of Adani
From a Fundamentals perspective Adani Ports is a Rock Solid script as it has global presence in Physical Real Estate of each port and is continually trying to scale up across the world.
From Technical point of view on Monthly Chart:
1) Pr
EURUSD|Same direction with market trends and sales positionsAccording to the general structure, we realize that the sales pressure is still higher than the purchase transactions, so we mostly try to go along with the market trend with the sales transactions.
Returning from the support area, we wait to reach the specified resistance areas, which are valid price areas of 1.09629 and 1.10247. By seeing the appropriate confirmation, including stick candles, pin bars, and hammers, we can enter into sales transactions in these areas.
The support areas in my
Inventing the "Growth" Story of Inventure "Growth & Securities"Inventure - A leading provider of investment advisory service and distributes financial products like mutual funds, insurance products, etc.
The stock turned Multi-bagged when it multipled from 0.80 / Share to 6.75 / share in a matter of 22 months. Now - after a perfect 0.786 retracement on the Fibonacci scale - it is all set to beat its earlier bull run.
Here are the Technicals:
Fib 0.786 Retracement on Monthly
Perfectly following a Parallel Channel on monthly since 10 years
A beautiful
Fib Circles for LifeThis is my first educational post.
This is not long or short.
This is just fib circles.
This tool is great for non-linear support and resistance.
you can also draw horizontal lines at the top of each circle to make your traditional fib extensions and retracements.
these can be used on any timeframe just like your standard linear fib ext/ret
The biggest rule of thumb is to draw this shape on a 45 degree angle.
you can check angles with the info line if a swing low to high in any area of th
Why Fibonacci Works along with Ichimoku - $SPY - ExplainedYou read a lot about Fibonacci and realize it's everywhere but you doubt it. It is too good to be true. I present the chart where it shows that you gotta believe it. Well let's put it this way. If some believe in Fibonacci and trade accordingly it will move the market and that is exactly what happened today. I am still long on AMEX:SPY (I have gamble puts expiring Feb)
Still long because it respected the support. I believe it will be range bound as 476 is a huge resistance because if it cros
Validating $RIVN Ichimoku and Fibonacci - Trend AffirmedI want to validate RIVN on Ichimoku and Fibonacci.
The trend seems to be intact and not broken as it h as a big support at 20 as shown below. If it breaches the 26.8 resistance which is the Fib Resistance, it has to just fly from there.
Will watch closely and please provide the feedback
Navigating the Markets with Fibonacci ChannelsToday we delve into the fascinating world of Fibonacci Channels, a powerful tool for traders looking to identify potential non-horizontal support and resistance levels in the market.
Throughout the video, we provide a step-by-step guide on how to place Fibonacci Channels on price charts, allowing you to visualize and understand their significance in identifying key price levels. We also showcase real-world examples to demonstrate how Fibonacci Channels can be used to find points of interest, su
#USDCHF possible bullish scenarioPrice is currently testing the lower boundary of a daily bearish channel , the 1 FIB extension level , and a long-term support area . This supportive cluster could potentially lead to the formation of a low around this price level.
On the other hand, the bearish move in price appears to be a corrective bearish ABC move , correcting approximately 61.8% to 78.6% from the previous bullish move.
If you've found this analysis helpful, please take a moment to like, comment, or share your th
EURUSD H4/H1/M30 Long entry in to 5 Wave.I'm currently looking for long on EURUSD. Count is derived from h4,h1,m30.
Entry to (5) Wave of Elliott Wave count.
There is nice looking end of ABC in lower degrees.
SL: Under Invalidation level = TOP of (1)
TP: TOP of (3); Also posible TP on Higer level - use FIB Expansion from (1)+(2).
Is $43310 a Local Top for #Bitcoin?Hi Padawans,
I've recently acquired the candlestick pattern from the 4000 to 69000 rally and strategically positioned it in the current scenario.
Disclaimer: I am not a financial advisor.
The 2.618 projection aligns with the 43310 mark.
Disclaimer: I am not a financial advisor.
May the force guide your endeavors.
Cheers,
CryptoObi
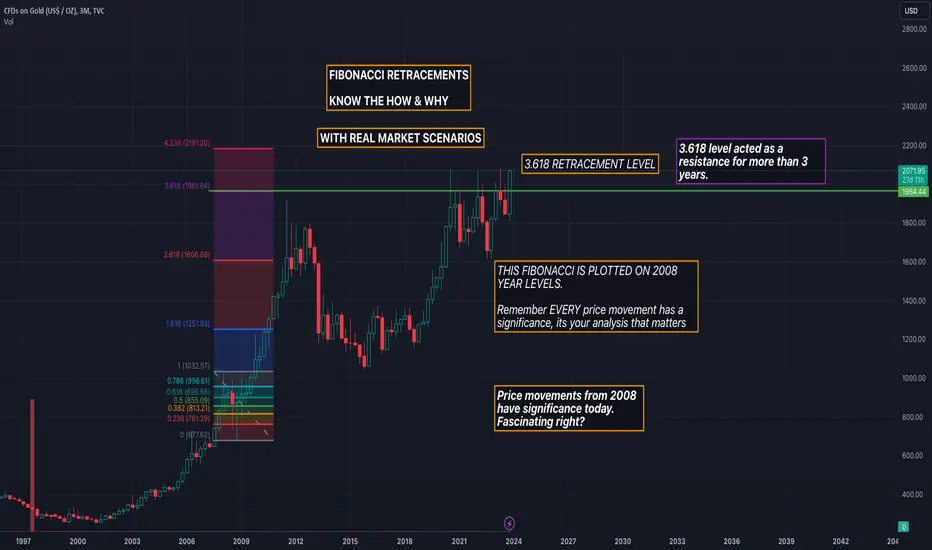
Fibonacci Retracement/Extensions- How & Why? | Live ExampleFibonacci retracements in technical analysis of various assets use a mathematical sequence discovered by Italian mathematician Leonardo Fibonacci. This sequence is a series of numbers where each number is the sum of the two preceding ones: 0, 1, 1, 2, 3, 5, 8, 13, 21, and so on. In stock trading, Fibonacci retracements are used to identify potential levels of support or resistance during price corrections.
Imagine you have a stock that has been rising in price for some time. Suddenly, it sta
Celestia target $27!Hello,
I put a fib extension on the Celestia chart and it turned out that the 3,618 level corresponds to the $24 price and the 4,236 level corresponds to the $27 price. From our point of view, it is a feasible target, at least in the first phase of the bull market, since Celestia is a solid project.
Below is our fundamental analysis, which you can also find on our Celestia website
SOCIAL & MASS MEDIA: Score 8 out of 10
AUDIT & SECURITY: Score 6.3 out of 10
TOKENOMICS: Score 3.6 out of 10
ECO
$STNE Fibonacci and Ichimoku Daily As always learning or going back to learning. A chart a day makes one happy every day!
Take Profit and Stop Loss
Used Fibonacci 4 Hour for Stop loss and for take profit used Daily Fibonacci. Now Ichimoku is the base chart for guidance
You always learn by doing it. I bought it on my long term plan and am also setting an alert for this on Trading View.
Navigating Bitcoin's Surge with a Keen Eye on the SEC's Next MovBitcoin is defying expectations, carving a path through the $38K barrier with the tenacity of a bull. The recent rally from $36,886 to $38,437 wasn't just a fluke; it's a statement. Even more compelling is Bitcoin's graceful dance above the 0.5 Fibonacci level at $37,662, dismissing any doubts about its current strength.
Away from the charts, the SEC's recent decision to delay the Bitcoin ETF ruling to 2024 has stirred the pot. But instead of a setback, it seems to have injected a curious mix o
USD/JPY: Fatigue, but no sign of reversalDear beloved friends,
Currently, the recent recovery of USD/JPY has stalled as it hovers around the strong resistance level at the psychological mark of 150, not far from the highest level of 152.00 in 2022. However, there are no signs of a reversal in the upward trend.
Furthermore, this pair is receiving support from a series of optimistic economic data from the United States (US).
Breaking above this level could potentially support the pair in exploring the area around the monthly high at 1
Possible GBPUSD movementsEnglish
First of all, I looked at the market structure, we have a very clear bearish structure since the 70´s and I looked at the last fractal to see the possible movements and debts the price may cover in his path.
I saw the last movements during (The LL and LH) that last bearish movement that the price didn´t get at least the 50% Fibo´s, it happened with the two bearish movements.
I took a look as well at the possible debts and I used the Fibo extension and noticed a debt in the level 1 (100)