Long
Long
GOLD - Symmetrical triangle. One step away from the rallyFX:XAUUSD is closing in a symmetrical triangle consolidation, awaiting a driver (news, negotiation results). The fundamental background is relatively favorable...
The dollar is stagnating and looks weak due to lower demand for the defensive USD and the hawkish policy of the Bank of Japan.
Uncertainty remains: US-Iran negotiations, Trump's tariffs
Gold is highly sensitive to geopolitics. The outcome of negotiations with Iran will be a key trigger: failure could push prices sharply higher, while success could trigger a correction. The fundamental background (weak dollar, rate expectations) remains bullish for now.
Technically, the focus is on consolidation boundaries. A rebound from support could trigger a breakout of resistance and a rally.
Resistance levels: 5210, 5238, 5310
Support levels: 5176, 5144, 5122
Consolidation in a symmetrical triangle pattern suggests that the market is doubtful about the future direction due to uncertainty. Within the consolidation, you can trade from the boundaries. However, a breakout of one boundary or another could trigger a rally in the direction of the breakout. Due to fundamental reasons, I am inclined to expect continued growth.
Best regards, R. Linda!  Long
Long
Long 
Deal or No Deal? Gold Awaits the Break Negotiation succeeds → Gold breaks down.
Negotiation fails → Gold breaks above 5205.
Gold retested the 5200 area overnight and pulled back, but it is still holding at elevated levels → the uptrend is not broken. Price is consolidating within the H1 range of 5205–5145. Repeated upper and lower wicks signal strong tug-of-war between buyers and sellers as the market awaits the outcome of the U.S.–Iran negotiations.
The key variable is the negotiation result: positive progress may trigger a short-term pullback, while failure could spark a breakout. The U.S. economic message prioritizing domestic growth suggests a potentially stronger USD → creating short-term downside pressure on gold, but not yet reversing the broader trend.
Support levels: 5172, 5150, 5120, 5100, 5090, deeper at 5050–5000.
Resistance levels: 5205, 5225, 5235, 5245, 5255.
Current strategy: trade the H1 range boundaries, scalp around 5172 within the range; follow whichever side breaks. Keep tight stop losses, avoid anticipation trades, and prioritize reaction to news and price structure. Long 
GOLD - Buyback of correction. Consolidation before rally FX:XAUUSD is buying back the downward momentum, within which the market tested 5100 and consolidated above the level. A retest of 5200 is forming after Trump's speech. The market is assessing his rhetoric on tariffs and Iran
The dollar is correcting from monthly highs amid continued expectations of a Fed rate cut.
Increased risk appetite is also weighing on the USD.
Trump's rhetoric during yesterday's speech kept pressure on the dollar and supported gold.
Tomorrow, a new round of US-Iran talks will take place in Geneva. Risks of escalation are keeping demand for safe-haven assets high.
Gold is maintaining its upward momentum thanks to the factors described above. Technically, the focus is on support: 5175, 5150, 5125. If the bulls keep the price above these levels, the growth will continue to 5238 - 5310.
Resistance levels: 5238, 5310, ATH
Support levels: 5176, 5144, 5122
Gold is consolidating above 5176, a breakout of local resistance could trigger a continuation of growth towards the resistance of the range. It is possible that the market may form a long squeeze at 5176-5144 before rising. Overall, the fundamental and technical situation is positive.
Best regards, R. Linda! Long 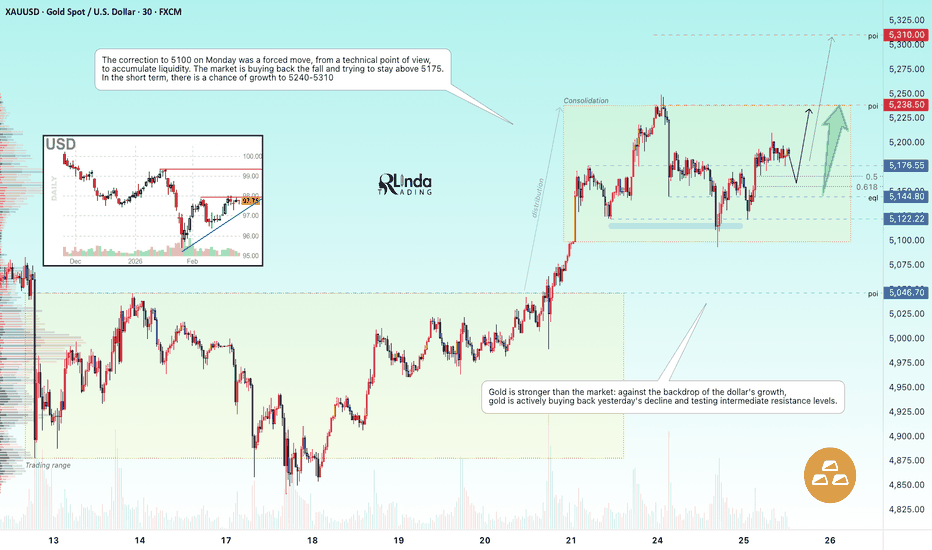
GOLD - The hunt for liquidity before the trend continues FX:XAUUSD is consolidating near $5,250 after four days of growth. A false breakout of key resistance is forming a correction, but the market structure remains bullish.
The opening of the Chinese and Japanese markets has added liquidity to the market.
Tariff uncertainty: the Trump administration is considering new tariffs.
Tensions remain between the US and Iran, Russia, and the US and Ukraine.
The correction in gold is temporary amid dollar stabilization. Fundamental support (expectations of rate cuts, geopolitics, demand from Asia) remains, limiting the potential for a decline. Technically, the focus is on the local range of 5191-5145. Liquidity capture on the support side could shift the imbalance towards buyers...
Resistance levels: 5191, 5238
Support levels: 5144, 5116, 5098
Within the bullish trend, a countertrend correction is forming, aimed at hunting for liquidity. Key areas of interest: 5145, 5116. A long squeeze of support and the market holding above key levels could trigger continued growth.
Best regards, R. Linda! Long 
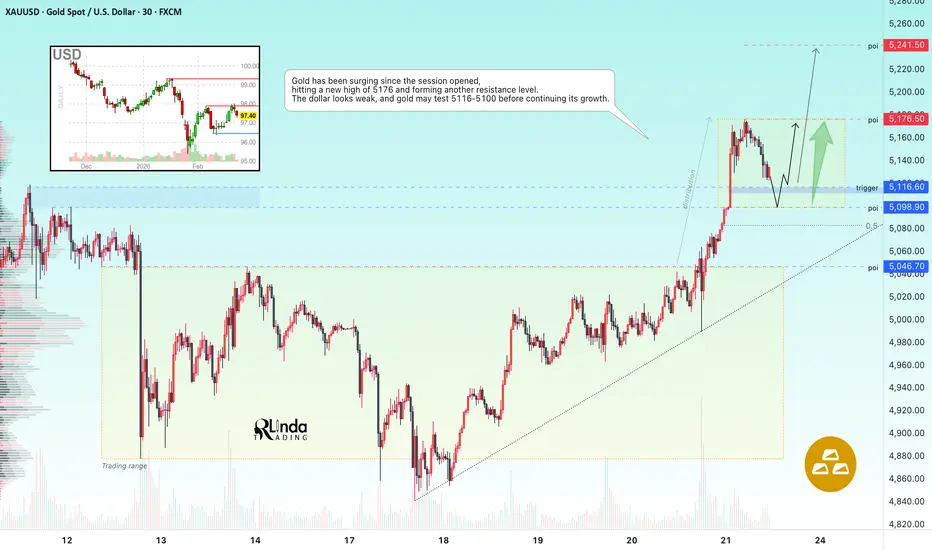
GOLD - Correction to the zone of interest before growth to 5250OANDA:XAUUSD continues its steady growth, adding 2% on Friday and another 1% on Monday, reaching new levels of 5176. The driver is the flight to safe-haven assets amid tariff uncertainty and geopolitical risks
After the Supreme Court overturned emergency tariffs, Trump announced new ones: first 10%, then raised to 15% for the whole world. This reinforces the uncertainty factor.
GDP for Q4 slowed to 1.4%, PCE inflation accelerated to 3%. The market still expects two Fed rate cuts this year.
Tariff chaos is weakening the dollar, macroeconomics is signaling stagflation (slowdown + high inflation), and geopolitics is adding tension. In such conditions, demand for safe-haven assets will remain, and the potential for further growth remains high.
Resistance levels: 5176, 5241
Support levels: 5116, 5100, 5080
A false breakdown (retest of the previously broken consolidation border and zone of interest) could trigger a shift in the imbalance towards the buyer, which in turn would lead to a rally in which the market could renew its interim high and head towards 5240.
Best regards, R. Linda! Long 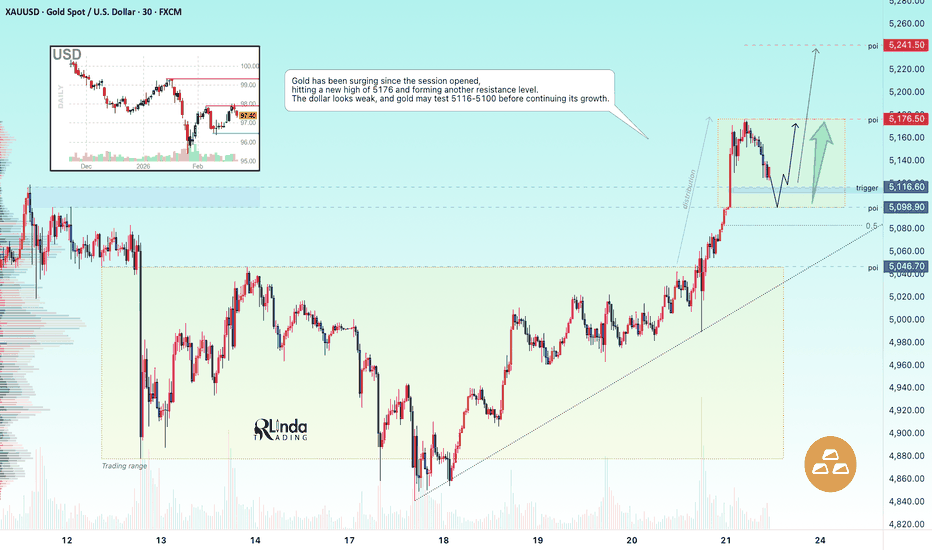
Waiting for Alignment: When Confluence Becomes the EdgeMarkets rarely reward urgency. More often, they reward structure — and structure becomes significantly more meaningful when multiple technical elements align at the same price zone.
On the weekly timeframe, we are currently observing a clear impulse–correction–impulse sequence within a broader downtrend. Instead of reacting to weakness, the focus here is on waiting for alignment — specifically, a corrective retracement into a zone where several independent technical tools converge.
This publication presents a structured case study built around confluence, patience, and risk asymmetry using Bitcoin futures and Micro Bitcoin futures contracts. The objective is not to anticipate outcomes, but to illustrate how disciplined positioning within a defined framework can potentially improve reward-to-risk efficiency.
Market Structure: Impulse → Correction → Impulse
The weekly structure reflects a prevailing downtrend characterized by:
A strong bearish impulse leg
A corrective rally phase
A continuation lower
Trend-following methodology generally favors entering during corrective phases rather than chasing impulse legs. Selling into weakness often compresses reward-to-risk ratios, while waiting for retracements allows for:
More favorable entry positioning
Clearly defined invalidation levels
Expanded downside asymmetry
The structural premise here is straightforward: if the broader trend remains intact, the optimal participation point is not during acceleration, but during retracement into resistance.
The Confluence Zone: 81,210 – 90,885
The highlighted resistance region is technically significant because it represents the alignment of four independent factors:
38.2% Fibonacci retracement measured from the major swing low to the swing high
38.2% Fibonacci retracement measured from the swing high to the current low
An open weekly gap, with the opening level at 79,660
A clearly defined UFO resistance zone (UnFilled Orders)
Why Nested Fibonacci Levels Matter
When identical retracement percentages from opposing legs cluster within a narrow range, it signals structural symmetry. This nesting effect increases the probability that the zone attracts liquidity during corrective movement.
The 38.2% level is frequently associated with trend continuation environments, as it reflects shallow retracement within dominant momentum structures.
The Role of the Open Weekly Gap
Open gaps on higher timeframes often function as price magnets during retracement phases. While not guarantees, they frequently draw corrective movement before broader trend direction resumes.
In this context, the weekly gap opening at 79,660 reinforces the importance of the surrounding resistance structure.
UFO Resistance (UnFilled Orders)
UFO zones represent areas where prior aggressive activity left inefficiencies. These inefficiencies may act as supply when revisited. When a UFO aligns with Fibonacci confluence and a gap boundary, structural relevance increases materially.
The convergence of these four elements creates what can be defined as an alignment zone — not because of prediction, but because of overlapping technical logic.
The Patience Principle
Patience in trading is often misunderstood. It does not imply inactivity. It implies waiting for structural improvement in asymmetry.
Entering prematurely — before retracement — typically results in:
Wider stop placement
Reduced reward-to-risk efficiency
Emotional pressure during corrective rallies
By contrast, waiting for price to revisit resistance allows:
Defined invalidation above 90,885
Entry within a region of structural supply
Downside extension potential toward lower liquidity zones
In trending markets, corrections are not threats to the thesis. They are opportunities to refine positioning.
Forward-Looking Trade Structure (Illustrative Case Study)
This section is presented strictly as a hypothetical framework for risk management illustration.
Scenario Assumption:
Price retraces into the 81,210 – 90,885 confluence zone.
Potential Structure:
Entry: Upon retracement into the confluence region
Invalidation: Price trading above 90,885
Target Zone: 49,435 – 38,540 (UFO support)
The target region corresponds to the next substantial liquidity structure identified on the weekly chart. Between the confluence resistance and the lower UFO support, limited structural support is visible.
Conceptually, this creates a high asymmetry structure: limited defined upside risk relative to broader downside space.
The key variable remains patience. Without retracement, the structure does not mature.
Liquidity Vacuum Below
One of the most important technical observations on the weekly timeframe is the relative absence of meaningful support between the resistance confluence and the lower support zone.
Trending markets frequently produce liquidity vacuums — areas where price previously accelerated without significant counterflow.
These zones often:
Provide little friction during continuation
Allow extended impulse movement
Amplify volatility during breakdown phases
The lack of intermediate support is what enhances the asymmetry profile of the setup.
Bitcoin Futures Contract Specifications
Understanding contract mechanics is critical when structuring risk.
Bitcoin Futures (BTC)
Contract size: 5 bitcoin
Minimum tick size: $5 per bitcoin
Tick value: $25 per contract
Approximate margin: ~$81,500 (varies with volatility conditions)
This contract is designed for participants seeking larger notional exposure and institutional-scale positioning.
Micro Bitcoin Futures (MBT)
Contract size: 0.1 bitcoin
Minimum tick size: $5 per bitcoin
Tick value: $0.50 per contract
Approximate margin: typically ranges between ~$1,630 (varies with volatility conditions)
Micro contracts allow for precision sizing and more granular exposure management, particularly useful when operating on higher timeframes with wider invalidation zones.
Margin requirements fluctuate based on volatility and clearing conditions.
Risk Management Considerations
Weekly timeframe structures inherently require larger stop distances. Therefore:
Position sizing must reflect volatility expansion
Capital allocation should remain proportional
Micro contracts may allow refined exposure control
Additional considerations:
Gap risk: Weekly gaps can introduce opening volatility
Volatility clustering: Crypto markets can experience rapid expansion phases
Scenario invalidation: A sustained move above 90,885 would structurally weaken the bearish thesis
Risk management is not an accessory to strategy — it is the strategy.
Why Confluence Matters
No single technical tool provides consistent edge in isolation. Fibonacci levels alone, gaps alone, or UFO zones alone do not create reliability.
However, when:
Retracement symmetry
Liquidity inefficiencies
Structural resistance
Trend continuation bias
align within the same region, the probability framework becomes more organized.
Confluence reduces randomness. It does not eliminate uncertainty.
The objective is not certainty — it is structured asymmetry.
Final Thoughts: Edge Is Built, Not Forced
Markets reward alignment more often than urgency.
Waiting for retracement into resistance may feel counterintuitive during accelerating trends, but structurally it offers:
Defined invalidation
Improved asymmetry
Emotional neutrality
Impulse–correction sequencing is foundational to trend continuation logic. When corrections intersect with confluence zones, the framework becomes technically compelling.
The key variable is discipline.
Without patience, confluence has no utility.
Without structure, patience has no direction.
When both align, edge becomes measurable.
Data Consideration
When charting futures, the data provided could be delayed. Traders working with the ticker symbols discussed in this idea may prefer to use CME Group real-time data plan on TradingView: www.tradingview.com - This consideration is particularly important for shorter-term traders, whereas it may be less critical for those focused on longer-term trading strategies.
General Disclaimer
The trade ideas presented herein are solely for illustrative purposes forming a part of a case study intended to demonstrate key principles in risk management within the context of the specific market scenarios discussed. These ideas are not to be interpreted as investment recommendations or financial advice. They do not endorse or promote any specific trading strategies, financial products, or services. The information provided is based on data believed to be reliable; however, its accuracy or completeness cannot be guaranteed. Trading in financial markets involves risks, including the potential loss of principal. Each individual should conduct their own research and consult with professional financial advisors before making any investment decisions. The author or publisher of this content bears no responsibility for any actions taken based on the information provided or for any resultant financial or other losses.  Education
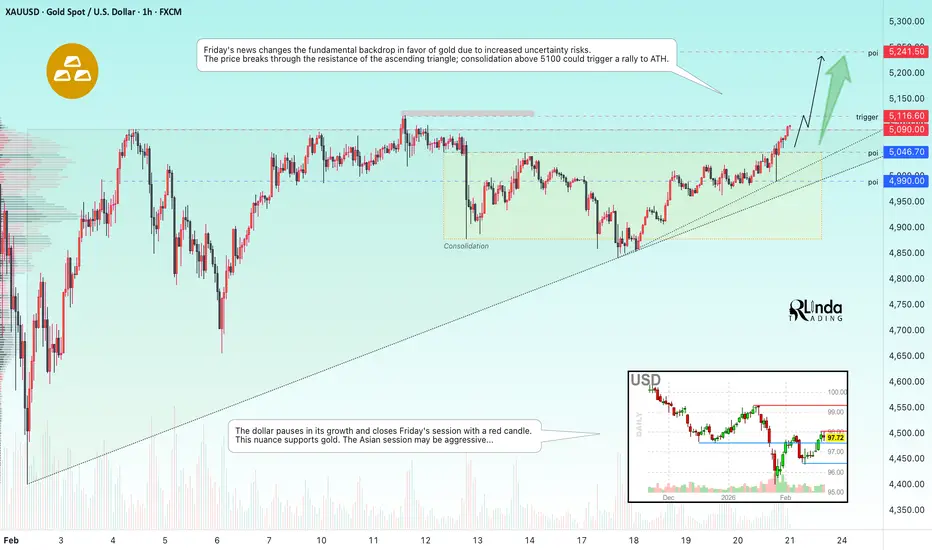
GOLD - Fundamental and technical background positive...FX:XAUUSD rose more than 2%+ on Friday, reaching $5,100, following the release of conflicting data on the US economy and the US Supreme Court's ruling on Trump's tariffs. It's not that simple...
GDP for the fourth quarter slowed sharply to 1.4%.PCE inflation accelerated to 3%.
The court ruled Trump's global tariffs illegal (exceeding his authority under the IEEPA).
Trump said he would find ways to keep the tariffs and immediately raised overall tariffs from 10% to 15%, but the market perceived this as temporary uncertainty.
Key question : Will gold be able to consolidate above $5,100 amid ambiguous macroeconomics and geopolitics?
Technically , gold has broken through the resistance of a fairly strong bullish pattern...
Resistance levels: 5100, 5116, 5240
Support levels: 5090, 5046, 4990
The fundamental backdrop for gold is relatively positive. The technical backdrop is also favorable. Thus, the breakout of the resistance of the ascending channel gives fairly strong bullish signals. If the bulls hold the market above 5000-5100, the metal may resume its rally, with targets at 5250, 5400, and ATH...
Best regards, R. Linda! Long 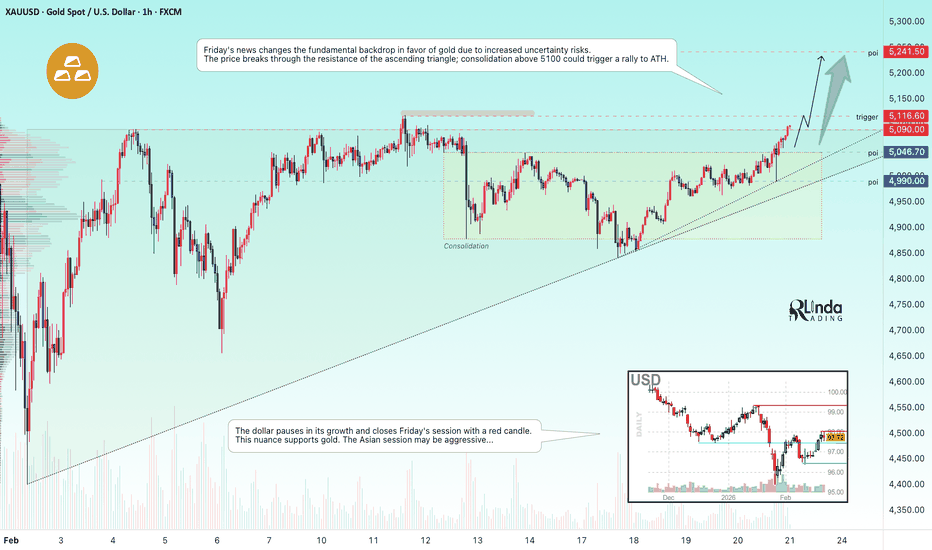
 Short
Short
Fibonacci Retracement: Why Markets Respect the Golden Ratio
The Market Speaks in Numbers. Fibonacci Is the Language.
From sunflower spirals to galaxy formations, the Fibonacci sequence appears everywhere in nature.
And it turns out, markets follow the same mathematical patterns.
Fibonacci retracement isn't magic — it's mass psychology meeting mathematical harmony. When thousands of traders watch the same levels, those levels become self-fulfilling.
What Is Fibonacci Retracement?
Fibonacci retracement identifies potential support and resistance levels based on the Fibonacci sequence.
The Key Levels:
23.6%
38.2%
50.0% (not technically Fibonacci, but widely used)
61.8% (the "Golden Ratio")
78.6%
The Logic:
After a significant move, price tends to retrace a predictable portion before continuing the trend.
The Fibonacci Sequence Explained
The Sequence:
0, 1, 1, 2, 3, 5, 8, 13, 21, 34, 55, 89, 144...
The Pattern:
Each number is the sum of the previous two.
The Ratio:
Divide any number by the next: ≈ 0.618 (the Golden Ratio)
Divide by the number two places ahead: ≈ 0.382
Divide by the number three places ahead: ≈ 0.236
Why Markets Care:
These ratios appear in natural growth patterns. Human psychology, being part of nature, follows similar patterns.
How to Draw Fibonacci Retracement
For Uptrends:
Identify the swing low (start of move)
Identify the swing high (end of move)
Draw Fibonacci from low to high
Watch for support at retracement levels
For Downtrends:
Identify the swing high (start of move)
Identify the swing low (end of move)
Draw Fibonacci from high to low
Watch for resistance at retracement levels
Pro Tip:
Use the most significant swing points on your timeframe. Minor swings create noise.
Understanding Each Fibonacci Level
23.6% Retracement
Shallow pullback
Strong trend continuation
Often first support in aggressive trends
Quick bounce expected
38.2% Retracement
Moderate pullback
Healthy correction
Common in strong trends
Good risk/reward entry
50% Retracement
Psychological level
"Half-back" principle
Very common support/resistance
Not true Fibonacci but widely watched
61.8% Retracement (Golden Ratio)
The most important level
Deep retracement
Last chance for trend continuation
High probability reversal zone
78.6% Retracement
Very deep retracement
Trend may be weakening
Last line of defense
Break here often means trend reversal
Fibonacci Trading Strategies
Strategy 1: The Golden Pocket (61.8% - 65%)
Setup:
Strong trend established
Price retraces to 61.8% - 65% zone
Confluence with other support (MA, trendline, S/R)
Enter with confirmation (candlestick pattern, volume)
Why It Works:
The 61.8% level is where most trend continuation happens. It's the sweet spot.
Strategy 2: The 50% Bounce
Setup:
Clear trend
Price pulls back to 50%
Quick rejection
Enter on bounce
Why It Works:
50% is psychological. Traders see it as "half-back" and often buy/sell there.
Strategy 3: Multiple Timeframe Fibonacci
Setup:
Draw Fib on higher timeframe (daily)
Draw Fib on lower timeframe (4H)
Look for confluence zones
Enter where multiple Fib levels align
Why It Works:
When multiple timeframes agree, probability increases significantly.
Strategy 4: Fibonacci + Candlestick Patterns
Setup:
Price reaches key Fib level
Reversal candlestick forms (hammer, engulfing, etc.)
Enter on confirmation
Why It Works:
Fib shows where, candlesticks show when. Together = high probability.
Fibonacci Extensions (Targets)
After retracement, where will price go?
Extension Levels:
127.2%
161.8% (most common target)
200%
261.8%
How to Use:
Draw Fib retracement as normal
Add extension levels
Use as profit targets
Watch for resistance at extensions
Combining Fibonacci with Other Tools
Fibonacci + Moving Averages
50% Fib often aligns with 50 MA
61.8% often aligns with 200 MA
Confluence = higher probability
Fibonacci + Trendlines
Fib level + trendline = strong support
Double confirmation
Clear invalidation point
Fibonacci + Volume Profile
Fib level + POC = institutional zone
High volume + Fib = strong level
Best entries
Fibonacci + Support/Resistance
Fib level at previous S/R = triple confluence
Market memory + math
Highest probability setups
Common Fibonacci Mistakes
Wrong Swing Points — Using minor swings instead of major ones. Use the most obvious swing high/low.
No Confirmation — Entering blindly at Fib levels. Wait for price action confirmation.
Ignoring Trend — Trading against the trend at Fib levels. Fib works best with the trend.
Too Many Fibs — Drawing Fib on every swing. Focus on major moves only.
Expecting Perfection — Price doesn't always hit exact levels. Watch zones, not lines.
Advanced Fibonacci Techniques
1. Fibonacci Clusters
Draw multiple Fibs from different swings
Look for zones where levels cluster
These are high-probability reversal zones
2. Fibonacci Time Zones
Vertical lines at Fibonacci intervals
Predicts when moves may occur
Less reliable than retracements but useful
3. Fibonacci Fans
Diagonal lines from swing point
Dynamic support/resistance
Useful in trending markets
4. Fibonacci Arcs
Curved lines showing support/resistance
Combines price and time
Advanced technique
Fibonacci Across Different Markets
Stocks:
61.8% very reliable
Combine with earnings dates
Works well on daily/weekly charts
Forex:
50% and 61.8% most respected
Use on 4H and daily
Combine with session opens
Crypto:
All levels respected
High volatility = wider zones
Use higher timeframes
Futures:
Intraday Fibs work well
Combine with session profiles
Quick reactions at levels
Fibonacci Psychology
Why Fibonacci Works:
Self-Fulfilling Prophecy — Millions of traders watch these levels, creating real support/resistance.
Natural Patterns — Human psychology follows natural patterns, and Fibonacci is nature's ratio.
Risk/Reward — Fib levels provide clear entry and stop placement, attracting systematic traders.
Institutional Use — Algorithms and institutions use Fib, adding to their significance.
Key Takeaways
Fibonacci retracement identifies potential support/resistance based on natural ratios
61.8% (Golden Ratio) is the most important level
Always wait for confirmation before entering at Fib levels
Combine Fibonacci with other tools for highest probability
Use major swing points, not minor ones
Your Turn
Do you use Fibonacci in your trading?
What's your favorite Fib level — 50%, 61.8%, or something else?
Have you noticed Fibonacci working better in certain markets?
Share your Fibonacci experience below 👇
 Education
BITCOIN - Rebound from range support towards liquidity...BINANCE:BTCUSDT.P bounces off flat support and forms a pre-breakout consolidation relative to 68270. The flagship strengthens after Friday's news, but there are doubts...
After a shakeup, Bitcoin entered a strengthening phase amid the US Supreme Court's decision to overturn Trump's tariffs. However, it is difficult to say that this will significantly change the fundamental situation in the crypto market, as it creates uncertainty due to further decisions by Trump, who has already introduced new tariffs...
Bitcoin transfers to crypto exchanges continue, which generally indicates weak crowd sentiment.
Technically , the global trend is downward, while locally the market is in a flat/consolidation phase. The focus is on the 65K-72K range. The retest of support ends with a rebound, and technically, Bitcoin may head towards resistance. Pre-breakout consolidation is forming relative to the key resistance level of 68,270 at the moment. A breakout of this level could trigger a rally to the zone of interest at 70,000-70,500, from which, if the situation does not change, a fall to the support range is possible.
Resistance levels: 68270, 70000, 70500
Support levels: 67250, 65720
The structure of the upward model will be disrupted if the market breaks the local upward support line. At the moment, the market is testing resistance at 68,270, and if the bulls manage to break through this barrier and consolidate above resistance, Bitcoin could form a local rally to liquidity zones
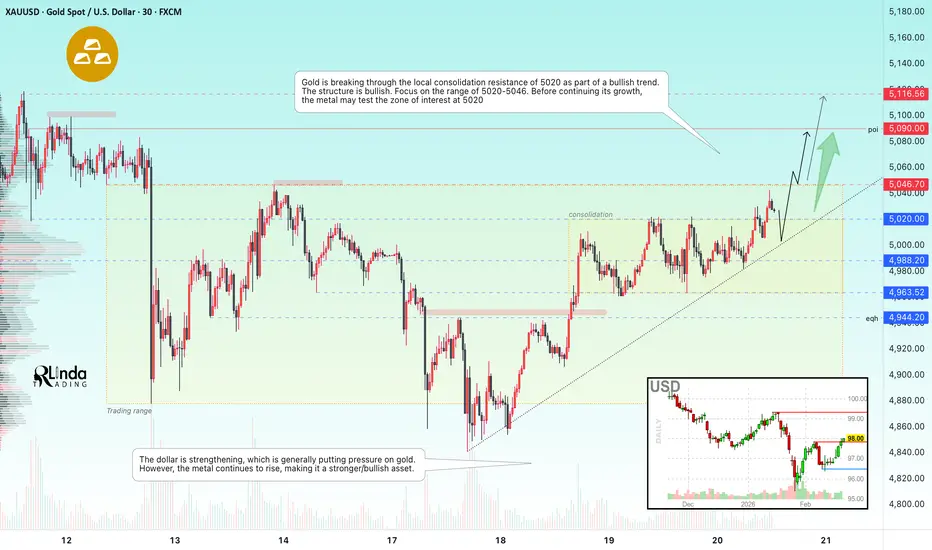
Sincerely, R. Linda! GOLD - Consolidation above 5000 ahead of news...FX:XAUUSD is consolidating around $5,000 in anticipation of key macroeconomic data from the US, which will determine its further direction. Will the bullish sentiment continue?
The USD is strengthening thanks to the Fed's hawkish minutes and strong labor market data.
The escalation of risks of a US strike on Iran and Trump's tough rhetoric are keeping gold buyers in the game. The market is also still pricing in three rate cuts this year, despite the Fed's cautious tone, which generally supports interest in gold.
Today we are awaiting US GDP for Q4: forecast to slow to 3%. PCE inflation (the Fed's favorite indicator): forecast to rise to 2.9%.
Supreme Court verdict on Trump's tariffs.
PMI business activity indices (global background).
The outcome of today's data will determine whether it can consolidate above $5,000 or will return to pressure. Key signal — market reaction to PCE inflation
Resistance levels: 5046, 5090, 5100
Support levels: 5020, 5000, 4988
If the bulls keep the price above the trend line and above the support level of 4988-5000, the market may experience strong support before continuing its growth. Otherwise, gold will continue to form a wide flat: 5050 - 4950 - 4900... Further dynamics depend on economic and geopolitical data.
Best regards, R. Linda! Long