EURUSD 1H: Reclaiming Resistance & Trendline Seller Trap1. Market Context
On the 1H chart, EURUSD is showing a strong bullish structure. After executing a major deviation below the lower boundary of the parallel channel (marked "Fake Break Parallel Channel"), the price saw massive institutional absorption. Subsequent dips to local supports were immediately bought up, marked by successive "No Buyer" exhaustion signals. The market is now aggressively pressing against the key horizontal resistance zone at 1.14512 - 1.14583, preparing for a decisive breakout.
2. Sentiment & Price Trap Analysis
• The Fake Break & Retail Shakeout: The initial drop below the parallel channel support successfully trapped breakout retail sellers and washed out weak buyers. The rapid recovery back into the channel confirmed strong institutional demand.
• The Resistance Seller Trap: Retail shorters are aggressively defending the horizontal resistance zone between 1.14512 and 1.14583 (marked "Seller"), expecting the range top to hold. Their stop losses (buy stops) are concentrated heavily just above 1.14583, representing a massive pool of buy liquidity.
• The Squeeze Catalyst (Break Signal): A decisive 1H candle close above 1.14583 (marked "Break Signal") will trigger the accumulated buy stops of the trapped shorters. This forced liquidation will act as direct rocket fuel, driving the price rapidly upward toward the next expansion targets at 1.15000 (Level 2) and 1.15383 (Level 3).
3. Trade Setup
We target a high-probability long entry on a confirmed breakout of the key resistance zone to exploit the trapped sellers' liquidation momentum.
• Entry: 1.14583 (Buying the confirmed breakout close / Break Signal)
• Stop Loss (SL): 1.14154 (Placed safely below the recent "No Buyer" consolidation low)
• Take Profit (TP): 1.15383 (Targeting Level 3 near the upper parallel channel boundary)
• Risk-to-Reward Ratio (R:R): Approx 1.86:1
Gann Box
XAUUSD 1H: Reclaiming the Base & Short Squeeze (Long Setup)1. Market Context
On the 1H chart, Gold recently executed a rapid downswing to flush out retail buyers. After sweeping below the local support level, the price found strong institutional buying interest at the major support zone. It is now starting a V-shape recovery back above the key level of 4,029.89. A successful reclaim of this base confirms a bullish shift, opening the way for a rally toward the descending trendline resistance near 4,169.48.
2. Sentiment & Price Trap Analysis
• The Retail Buyer Shakeout (Buyer Lose): The sharp drop below the local ascending support successfully triggered the stop losses of weak retail buyers, forcing them out of their long positions at the worst possible prices.
• The Institutional Defense (Buyer Wait Here): Instead of continuing down, the selling pressure was completely absorbed by large market makers around the 3,980.28 - 4,000.00 demand zone. This area is heavily defended by smart money buyers who are ready to build their long positions.
• The Short Squeeze (Break Signal): As the price recovers aggressively above 4,029.89, early breakout short-sellers are getting trapped. The trigger of their stop losses (buy stops) combined with new institutional buying momentum will act as fuel to drive Gold rapidly higher toward the upper target.
3. Trade Setup
We target a high-probability long entry to ride the recovery momentum of the trapped sellers' stop hunt.
• Entry: 4,029.89 (Buying the confirmed reclaim / Break Signal)
• Stop Loss (SL): 3,980.28 (Placed safely below the manipulation spike low)
• Take Profit (TP): 4,169.48 (Targeting the upper consolidation resistance and trendline test zone)
• Risk-to-Reward Ratio (R:R): Approx 2.8:1
Daily Outlook || 13th July || CPI EveMarkets are sitting on a knife's edge heading into tomorrow's CPI print. Liquidity has been building on both sides of the market across forex, indices, gold, and Bitcoin — a setup that typically precedes a sharp directional resolution. Today's session is about mapping where that liquidity sits, not predicting which way it breaks.
In this video, we break down EURUSD, GBPUSD, XAUUSD (Gold), S&P 500, Nasdaq 100, and Bitcoin through the lens of:
Market Structure
Liquidity Mapping
Institutional Order Flow
ICT Concepts & Smart Money Concepts
Premium & Discount Zones
Fair Value Gaps
Order Blocks
Daily Bias Framework
With CPI on the calendar, this is a two-sided market — and knowing where the resting liquidity is matters more than guessing the headline number.
Why you should watch:
✔ Key liquidity pools above and below current price
✔ Areas where institutions are likely to react
✔ Risk management going into a high-impact news event
✔ Bullish and bearish scenarios mapped for both outcomes
✔ Confirmation levels to validate direction post-CPI
This analysis is for educational purposes only and does not constitute financial advice. Always manage risk and trade your own plan.
CPI tomorrow means big moves are coming — but which side gets swept first? Drop your bias below: are you leaning long or short into the print? Let's compare notes before the data hits.
WTICOUSD 1H: The Gap-Fill Liquidity Run (Short Setup)
1. Market Context
On the 1H chart, Oil is trading within a dominant descending parallel channel. After a minor consolidation near the upper boundary, the price is executing a clean breakdown below the local support level at 70.103. This breakdown officially opens the door for a high-probability run to fill the historical gap down to the 68.107 level.
2. Sentiment & Price Trap Analysis
• The Retail Buyer Trap: Retail traders aggressively bought the local support around 70.500 to 71.000, expecting a bullish rebound toward the channel's upper boundary. Their stop losses (sell stops) are clustered heavily inside the unfilled gap zone, right below the key support floor of 70.103.
• The Gap Magnet & Liquidity Run: Unfilled gaps act as massive liquidity magnets because institutional algorithms seek to clear price inefficiencies. As the breakdown below 70.103 triggers the first wave of buyer stop-losses, the forced liquidation of these long positions will accelerate the downward momentum, driving the market straight into the core liquidity pool.
3. Trade Setup
We target a high-probability short entry to ride the liquidation momentum of trapped buyers into the gap-fill zone.
• Entry: 70.067 (Selling the breakdown of the gap trigger/local support)
• Stop Loss (SL): 72.019 (Placed safely above the local consolidation high and trendline confluence)
• Take Profit (TP): 68.107 (Targeting the complete fill of the historical gap / lower support)
• Risk-to-Reward Ratio (R:R): Approx 1:1
XAGUSD 4H: Channel Breakout & Short Squeeze Plan (Long Setup)1. Market Context
On the 4H chart, Silver is currently trading near the upper boundary of a major descending parallel channel. After a deep liquidity sweep at the local bottom where selling pressure exhausted (marked by the "No Buyer" signal near 57.081), the price initiated a strong recovery. It is now consolidating right beneath the critical descending trendline and the key horizontal resistance levels. We are waiting for a confirmed breakout to trigger an explosive upward move.
2. Sentiment & Price Trap Analysis
• The Trendline Seller Trap: Throughout the downtrend, retail traders have aggressively shorted every touch of the upper trendline (marked "Seller"), expecting the bearish structure to hold. This massive retail selling activity has clustered a heavy pool of buy-stop liquidity (stop losses) directly above the trendline and the horizontal resistance zone at 61.606 - 63.377.
• The Breakout Catalyst: A decisive 4H candle close above the trendline (marked "Break Signal") will instantly trap these late sellers. As their buy-stop orders are triggered, the forced liquidation of short positions will act as rocket fuel, accelerating the bullish momentum rapidly.
• The Institutional Support: Strong buying demand is waiting at the lower key support zones (marked "Buyer Wait Here"). These buyers are ready to defend the breakout structure on any potential pullbacks, confirming that the path of least resistance is now to the upside.
3. Trade Setup
We target a high-probability long entry on a confirmed breakout of the descending channel to exploit the trapped sellers' exit momentum.
• Entry: 60.419 (Buying the confirmed breakout close above the trendline / Break Signal)
• Stop Loss (SL): 57.081 (Placed safely below the local accumulation bottom)
• Take Profit (TP): 70.604 (Targeting the major overhead structural resistance zone)
• Risk-to-Reward Ratio (R:R): Approx 3:1
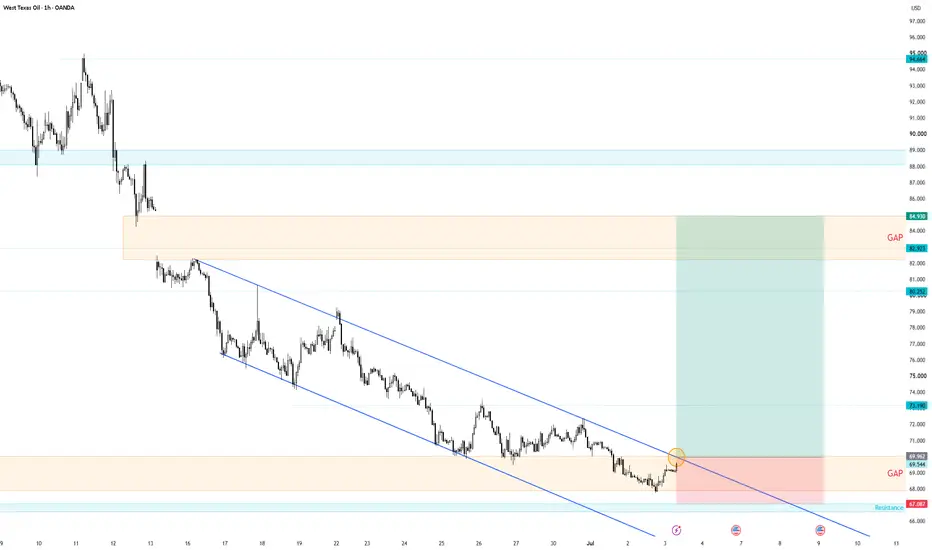
WTICOUSD 1H: Channel Breakout & Massive GAP Fill (Long Setup)1. Market Context
On the 1H chart, Oil has officially broken above the upper boundary of the dominant descending parallel channel that has controlled the price action for weeks. This decisive breakout above the 69.494 - 69.962 zone confirms a structural shift from bearish to bullish, opening the door for an explosive run to fill the massive historical GAP zone resting between 82.923 and 84.930.
2. Sentiment & Price Trap Analysis
• The Trapped Sellers: Throughout the life of the descending channel, retail traders aggressively opened short positions at every touch of the upper trendline resistance. Their stop losses (buy stops) are clustered heavily above the channel boundary, acting as a massive pool of buy liquidity.
• The Short Squeeze Catalyst: As the price breaks and holds above the channel, these sellers are forced into underwater positions. Their capitulation (forced market buy orders to cover short positions) will act as direct rocket fuel, accelerating the bullish momentum upward.
• The Ultimate GAP Magnet: Large institutional orders are sitting in the unfilled GAP zone near 82.923 - 84.930. The market will naturally seek this heavy liquidity pool now that the channel resistance has been completely reclaimed.
3. Trade Setup
We target a high-reward long entry to ride the short squeeze momentum into the massive overhead GAP fill.
• Entry Zone: 69.494 - 69.962 (Buying the confirmed channel breakout)
• Stop Loss (SL): 67.087 (Placed safely below the local consolidation low and major support)
• Take Profit (TP): 84.930 (Targeting the complete fill of the overhead GAP zone)
• Risk-to-Reward Ratio (R:R): Approx 5.3:1
US30 1H: Trapping the Channel Buyers (Bearish Breakdown Setup)1. Market Context
On the 1H chart, US30 is trading within a well-defined ascending parallel channel. After a sharp rejection from the channel's upper boundary around 53,279.9, the price collapsed rapidly and is currently consolidating right above the critical ascending trendline support and local horizontal level at 52,793.7.
2. Sentiment & Price Trap Analysis
• The Retail Buyer Trap: Retail traders are aggressively opening long positions at the touch of the ascending trendline support (marked "Buyer"), expecting a typical bullish bounce back toward the upper channel limit. This heavy retail buying behavior has clustered a massive pool of sell-stop liquidity (stop losses) directly beneath the 52,793.7 support floor.
• The Breakdown Trigger: Institutional algorithms are likely keeping the price suspended temporarily to induce more retail buyers into the trap. Once the accumulation of long positions is complete, a decisive break below the 52,793.7 support will trigger a domino effect of stop-loss market orders (selling pressure).
• The Downward Expansion: The forced liquidation of trapped buyers will rapidly accelerate the downward momentum, driving the market straight into the deeper liquidity pools and structural support zones at 52,307.5 and 51,821.3.
3. Trade Setup
We target a high-probability short entry on the confirmed breakdown of the trendline support to capitalize on the trapped buyers' liquidation momentum.
• Entry: 52,793.7 (Selling the confirmed breakdown of the trendline and local support)
• Stop Loss (SL): 53,279.9 (Placed safely above the recent swing high/consolidation top)
• Take Profit 1 (TP1): 52,307.5 (First major horizontal support zone)
• Take Profit 2 (TP2): 51,821.3 (Ultimate target / lower structural expansion level)
• Risk-to-Reward Ratio (R:R): Approx 2:1 (Calculated based on TP2)
GBPUSD 15M: Trapping the Channel Buyers (Short Setup)
1. Market Context
On the 15M chart , GBPUSD has been trading within a well-defined ascending parallel channel. After failing to sustain its position near the upper boundary around 1.32731, the price formed a local consolidation box and is now executing a sharp breakdown below both the consolidation support and the channel's middle line.
2. Sentiment & Price Trap Analysis
• The Retail Buyer Trap: Inside the local consolidation box (between 1.32400 and 1.32700), retail traders aggressively opened buy positions, expecting a bullish bounce toward the channel's upper limit. This buying behavior has clustered a massive pool of sell-stop liquidity (stop losses) directly below the consolidation support at 1.32406.
• The Liquidity Trigger: The decisive breakdown below 1.32406 has successfully triggered the first wave of buyer stop-losses. As these retail long positions are forced to liquidate into market sell orders, the selling pressure is set to accelerate aggressively.
• The Downward Target: With retail buyers trapped at the top and forced to cut losses, market makers are expected to drive the price lower to hunt the remaining liquidity pool, targeting the lower channel boundary and the major structural support box near 1.31867.
3. Trade Setup
We target a high-probability short entry to exploit the liquidation momentum of the trapped buyers.
• Entry: 1.32406 (Selling the breakdown of the consolidation support)
• Stop Loss (SL): 1.32662 (Placed safely above the local consolidation high)
• Take Profit (TP): 1.31867 (Targeting the lower structural expansion zone)
• Risk-to-Reward Ratio (R:R): Approx 2.1:1
BTC 1H: Trapping Trendline Sellers & Liquidity Hunt1. Market Context
On the 1H chart of image, Bitcoin has successfully performed a liquidity sweep at the 58,288 support level. The "No Buyer" signals at the lows confirm that the selling pressure has been absorbed, and the market is currently testing the major descending trendline.
2. Sentiment & Price Trap Analysis
• The Trendline Seller Trap: Retail traders are actively shorting at the descending trendline (marked "Seller"), expecting the downtrend to continue. They are building a massive pool of buy-stop liquidity just above this trendline.
• The "No Buyer" Liquidity Sweep: The market maker has already flushed out weak buyers at the 58,288 support. The lack of selling follow-through confirms that the smart money is positioning for a reversal.
• The Short Squeeze Setup: As the price pushes against the trendline, the accumulated stop losses from the trapped sellers will act as fuel. A breakout above the trendline will trigger these stops, forcing a rapid upward move to clear the overhead resistance.
3. Trade Setup
We are targeting a long entry to exploit the trapped sellers' stop-loss orders.
• Entry: 59,480 (Breakout confirmation/Momentum)
• Stop Loss (SL): 58,280 (Placed safely below the liquidity sweep low)
• Take Profit (TP): 62,700 (Targeting the next structural resistance level)
• Risk-to-Reward Ratio (R:R): Approx 2.7:1
XAUUSD 1H: Trapping Trendline Sellers & Buyer Exhaustion1. Market Context
On the 1H chart of image, Gold is struggling under the major descending trendline. The price is currently oscillating within a small consolidation zone below the trendline, failing to sustain any significant bullish momentum.
2. Sentiment & Price Trap Analysis
• The Trendline Seller Trap: Retail traders are aggressively selling at the descending trendline (marked "Seller"), building a wall of buy-stop liquidity just above the trendline.
• The "A Few Buyer" Trap: Retail traders are buying the local dip (marked "A Few Buyer"), expecting a reversal. These positions are becoming liquidity for a potential move lower.
• The "No Buyer" Exhaustion: The signal marked "No Buyer" confirms that there is no genuine demand to push the price above the current resistance. This exhaustion suggests that the market is preparing to sweep the liquidity resting below the recent lows.
3. Trade Setup
We are targeting a short entry to capitalize on the exhaustion of buyers and the impending liquidity sweep.
• Entry: 4031.75 (Selling the exhaustion/No Buyer signal)
• Stop Loss (SL): 4046.38 (Placed safely above the recent resistance)
• Take Profit (TP): 3900.00 (Targeting the lower support liquidity zone)
• Risk-to-Reward Ratio (R:R): Approx 9:1
USDCAD 1H: Trapping the Consolidation Buyers1. Market Context
On the 1H chart, USDCAD is currently stuck in a tight consolidation range after failing to break above the major resistance level. The price is testing the lower support of this range, where retail traders are actively looking to buy the dip.
2. Sentiment & Price Trap Analysis
• The Retail Buyer Trap: The "Buyer" label at the support level indicates that retail traders are aggressively going long, expecting the range to hold. This has created a massive pool of sell-stop liquidity (stop losses) right below the support level.
• The "No Seller" Exhaustion: The price rejection marked as "No Seller" at the range high confirms that the momentum to push higher is currently absent, leaving the retail longs vulnerable to a breakdown.
• The Breakout Strategy: As retail buyers are trapped in the consolidation, a breakdown through the support will trigger their stop losses (sell orders), which will act as fuel to drive the price down to the primary trendline support.
3. Trade Setup
We are targeting a short entry on the breakdown of the consolidation support to capitalize on the stop-loss run.
• Entry: 1.41888 (Selling the breakdown of the consolidation support)
• Stop Loss (SL): 1.42146 (Placed safely above the recent high/resistance area)
• Take Profit (TP): 1.41218 (Targeting the lower support area near the trendline)
• Risk-to-Reward Ratio (R:R): Approx 2.6:1
WuBlockchain Highlights Bitcoin Mining StrugglesWuBlockchain reports that Bitcoin has traded below its estimated production cost for five consecutive months, according to JPMorgan. This situation has left approximately 20% of Bitcoin miners unprofitable, raising concerns about the sustainability of mining operations in the current economic climate. The full details can be found in the original tweet from WuBlockchain.
Market Snapshot
The current state of Bitcoin mining reflects a significant downturn in profitability. Amid a wave of selling pressure across the crypto market, Bitcoin’s trading price has consistently lingered below the estimated production cost of about $78,000. This stark reality underscores the challenges miners face as they navigate a difficult economic landscape. Many miners are now grappling with the harsh consequences of these conditions, which could lead to a shake-up in the mining ecosystem as some are forced to halt operations or seek more efficient methods of mining to remain viable.
Bitcoin mining has always been a critical aspect of the cryptocurrency ecosystem, serving both to secure the network and to introduce new coins into circulation. However, the current regulatory pressures and economic conditions have raised numerous questions about the industry’s future. Historical trends show that profitability in mining is closely tied to Bitcoin’s market price, and the recent downturn poses serious implications for miners who operate on slim margins.
What Traders Are Watching Next
As traders and market observers analyze this situation, they should keep an eye on Bitcoin’s price action relative to its production costs. Future developments may include potential innovations in mining technology or shifts in energy consumption practices that could alter profitability dynamics. Additionally, market sentiment could shift as discussions around mining regulations and environmental concerns become more prominent. Understanding these factors will be crucial for traders looking to navigate the evolving landscape of Bitcoin mining.
This article is for informational purposes only and does not constitute financial advice. Please conduct your own research before making investment decisions.
XAUUSD 4H: Bullish Structure With Event Risk AheadBias: Bullish
Gold remains structurally bullish on the 4-hour timeframe as price continues to respect the overall higher high and higher low sequence.
I am currently monitoring a potential continuation setup after price retraces into the Fibonacci value area between the 50%-61.8% levels.
From a fundamental perspective, easing geopolitical tensions may reduce some safe-haven demand, but the overall market remains highly sensitive to upcoming US macroeconomic events.
Key events to monitor:
* FOMC statement
* Federal Reserve interest rate decision
* Economic projections (dot plot)
* Fed Chair press conference
These events could inject significant volatility into XAUUSD.
Bullish scenario
* Price holds above the Fibonacci support zone.
* Buyers defend the retracement area.
* Gold resumes its uptrend toward higher resistance levels.
Bearish risk
* A hawkish Federal Reserve stance (higher-for-longer interest rates) could strengthen the US Dollar and pressure gold prices lower.
* Failure to hold the retracement zone may invalidate the bullish setup.
Trade idea: Wait for confirmation inside the 50%-61.8% Fibonacci zone rather than chasing price.
Gann StarBased on the current data, Bitcoin could still continue dropping along the nearby trendline. If it breaks above that trendline, it would suggest that the price is holding its level defensively until a stronger upside breakout before September.
The most likely scenario is either a direct breakout—like previous breakouts—or a delayed breakout, which could lead to an even more exaggerated surge on a later day.
And Allah knows best.
According to my algorithm-based analysis, Bitcoin appears to be in a breakout phase. Based on my expectations, Bitcoin could reach $160,000, and over the following years it may continue up to around $201,000.
Wishing everyone the best of luck.
Continuation SELL entry on NZDUSD This is a new entry for a sell continuation on FOREXCOM:NZDUSD
Here is the previous early entry from last week, currently running at +2R.
Price has confirmed a bearish bias on the daily timeframe. I expect the price to dig into this H4 imbalance, which is also an order block on the higher time frame.
#NZDUSD
SELL setup
1:5 RR
Expectation, 1-2 weeks.
Manage risk, and let's get it.
Master Candle Range Theory (CRT)Analysis Breakdown
1. HTF Context
Choose your HTF CRT Candle .
Mark CRTH , CRTL , and the 50% equilibrium level .
2. Keylevel Selection
Mark your keylevel using one of these four structural points:
Old Highs / Lows
Order Block (OB)
Fair Value Gap (FVG)
Rejection Block
3. LTF Execution
Drop to LTF at the keylevel .
Look for TBS (Turtle Soup) and Model #1 displacement for entry limit .
Trading is risky. So always follow your own trading plan.
Prediction Markets A New Trend Trading The View of Valmors GroupFinancial markets continue to evolve rapidly, and with that evolution comes the emergence of new tools that are changing traditional approaches to trading. One such innovation is prediction markets — platforms where participants trade based on the outcomes of future events. Today, they are attracting growing attention from both professional traders and retail investors.
Valmors Group sees prediction markets as a promising direction that can complement traditional instruments while offering new ways to approach risk and returns.
Growing Interest in New Instruments
Interest in prediction markets is increasing as traders look for alternative ways to generate returns. Traditional markets are becoming more competitive, and margins are tightening, pushing participants to explore new formats.
Prediction markets offer a different approach. Instead of analyzing price movements, traders evaluate the probability of events. These events may include economic indicators, political decisions, or technological developments.
This format makes trading more accessible to a broader audience. It requires less technical chart analysis but encourages critical thinking and the ability to interpret information effectively.
Integration into Trading Platforms
As popularity grows, more platforms are integrating prediction markets into their ecosystems. This simplifies access and lowers the barrier to entry.
Valmors Group notes that integration goes beyond user interfaces. It also involves infrastructure development, leading to hybrid platforms that combine traditional trading with prediction-based markets.
This creates a more flexible environment where users can diversify strategies and manage risk more effectively.
New Opportunities for Traders
Prediction markets open up new opportunities. Traders can profit not only from price changes but also from the accuracy of their forecasts.
This is particularly valuable in highly volatile conditions, where traditional instruments may become less predictable. Working with probabilities provides an additional layer of decision-making.
In addition, popular events often generate strong liquidity, creating opportunities for short-term trading strategies.
Market Impact
The expansion of prediction markets is gradually influencing the broader financial ecosystem. They introduce a new layer of market sentiment that reflects collective expectations.
In some cases, these markets serve as indicators. The price of a contract can represent the perceived probability of an event, offering insight into market expectations.
Valmors Group believes that as this segment grows, its influence on investment decision-making will continue to increase.
Technological Development
Technology plays a key role in the evolution of prediction markets. Blockchain, smart contracts, and decentralized platforms improve transparency and accessibility.
Automation reduces the risk of manipulation and increases user trust. At the same time, advanced analytics tools help participants better evaluate probabilities and make informed decisions.
Technology also supports the global nature of these markets, allowing users from different regions to participate on equal terms.
Conclusion
Prediction markets are not just a new tool — they represent a shift in how trading is approached. The focus moves from price analysis to probability assessment, opening new opportunities for market participants.
Valmors Group believes that these formats have the potential to reshape the traditional structure of financial markets. In a rapidly changing environment, flexibility and willingness to adopt new tools are becoming essential for success.
As technology advances and user interest grows, prediction markets are well positioned to become a significant part of the modern financial ecosystem.
C
OKX Launches Agentic Wallet For AI-Driven On-Chain TransactionsOKX has unveiled its Agentic Wallet as part of a broader push into AI-integrated blockchain solutions, marking a notable step toward automation in Web3. The wallet is designed to enable AI agents to perform tasks that traditionally required human involvement, including analyzing blockchain data, executing trades, and managing digital assets.
One of the defining features of the Agentic Wallet is its multi-chain capability. The system supports around 20 different blockchain networks, allowing users and developers to manage assets across ecosystems through a unified interface. This eliminates the need to switch between multiple wallets or platforms, simplifying operations in an increasingly fragmented blockchain landscape.
The wallet operates through a command-line interface, enabling AI agents to interpret and execute user-defined instructions. This setup allows automation of complex workflows such as token swaps, portfolio adjustments, and transaction execution. By reducing manual input, the system aims to improve efficiency and speed in handling blockchain operations.
Security remains a central focus of the platform. Before executing any transaction, the wallet simulates the operation and conducts risk assessments. These checks help detect potential vulnerabilities, including smart contract risks or unfavorable trading conditions. By integrating these safeguards, the platform seeks to minimize risks associated with automated decision-making and enhance user confidence in AI-driven processes.
Implications for AI and Web3 Integration
The launch of the Agentic Wallet reflects a broader trend of integrating artificial intelligence into decentralized ecosystems. AI agents are increasingly being explored for their ability to automate trading strategies, manage portfolios, and interact with decentralized applications without constant human supervision. This evolution could significantly change how users engage with blockchain technology.
By enabling AI to directly execute transactions, platforms like OKX are pushing toward a more autonomous financial environment. Faster execution, data-driven decision-making, and reduced operational friction are some of the potential advantages. However, this shift also introduces new challenges related to system reliability, transparency, and security.
OKX Wallet
The wallet’s multi-chain functionality also highlights the growing importance of interoperability in the crypto space. Major ecosystems such as Ethereum and Solana continue expanding their capabilities, creating a competitive environment where seamless cross-chain interaction becomes increasingly valuable.
Despite the potential benefits, the adoption of AI-driven blockchain tools will depend on real-world performance and user trust. Automated systems must consistently deliver accurate and secure outcomes to gain widespread acceptance. Market participants are likely to monitor how effectively such solutions integrate into existing workflows.
For now, the Agentic Wallet represents an early but meaningful step toward more intelligent and autonomous blockchain interaction. As both AI and decentralized technologies continue evolving, their convergence could play a key role in shaping the next phase of digital finance.