Pidilite Industries – Weekly Inverse Head & Shoulders Setup🎯 Pidilite Industries – Weekly Inverse Head & Shoulders Setup
📊 CMP: ₹1,518
🛑 Stop Loss: ₹1,427
🎯 Targets: ₹1,572 | ₹1,617 | ₹1,685 | ₹1,766
Technical View
Pidilite Industries is showing a potential Inverse Head & Shoulders formation on the weekly chart, indicating a possible medium-to-long-term trend reversal.
Adding further strength to the setup, the right shoulder is developing within a box consolidation pattern, creating a classic "pattern within a pattern" structure. Such formations oft
Inverse Head and Shoulders
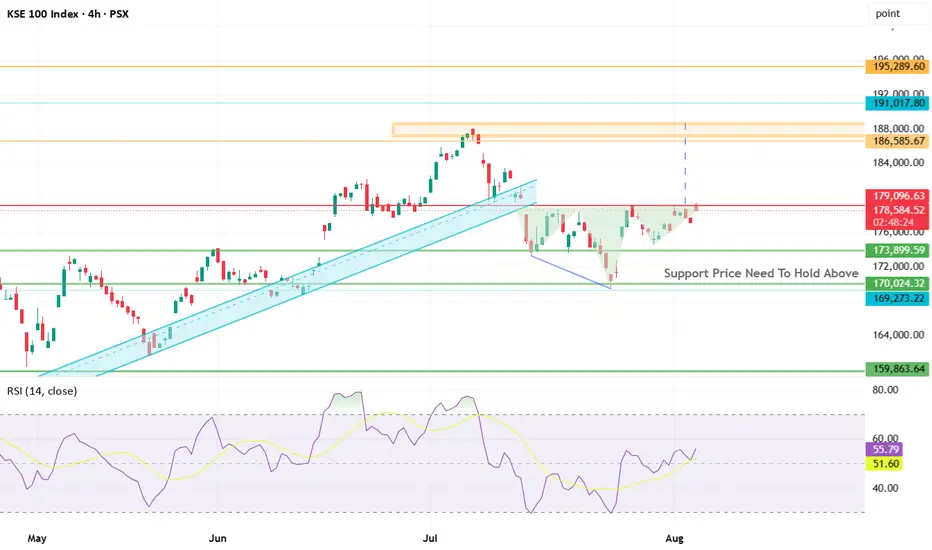
KSE100 index PSXKSE-100 Index |4H and 1H Chart Analysis
The KSE-100 Index is currently forming a potential Inverse Head & Shoulders reversal pattern on the 1-hour timeframe, indicating a possible shift from bearish to bullish momentum.
🔹 Key Confirmation Level: 179,100
The pattern will only be considered valid after a decisive 1-hour candle closes above 179,100.
A breakout accompanied by strong volume would significantly increase the probability of a sustained upside move.
🎯 Bullish Target:
Primary Target
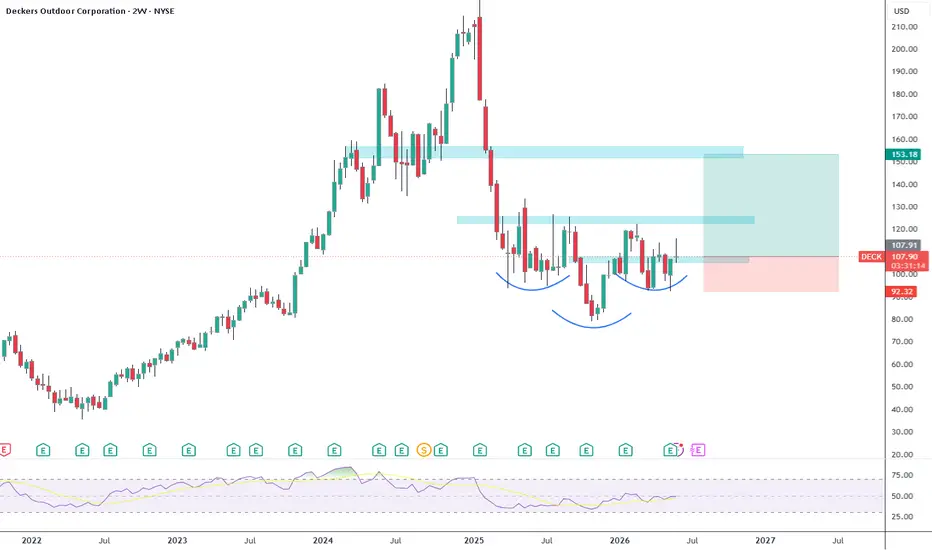
I cannot be that obviousWe have here a so obvious inverse HS setting up for a big break out. I'll buy calls at open: 08/14 strike 210. I think three weeks is enough time for this trade. I'll be selling calls on the way up. My final target is 224. I'll take the loss if a daily candles CLOSES below 198.
Bullish Reversal Signs in Refinery Stock!PRL Analysis
Closed at 42.07 (10-07-2026)
Inverse Head & Shoulders
Falling channel breakout
Resistance breakout (38.78)
Strong bullish candle
High breakout volume
Higher low forming on the right shoulder.
If price falls back below the neckline and remains below it,
the breakout may turn into a false breakout.
Angel One: Breakout | Target ₹580The wait is over. Angel One (ANGELONE) has spent years building a massive technical base, and the weekly chart is now screaming "Blue Sky Breakout."
Following a classic "Shakeout & Rocket" phase in early 2023, the price action has matured into a textbook Continuation Inverse Head & Shoulders pattern.
We are currently witnessing a high-conviction test of the multi-year neckline at the ₹326–₹330 zone.
Why the setup is prime:
Confirmation Trigger: A solid weekly close above ₹330 invalidates th
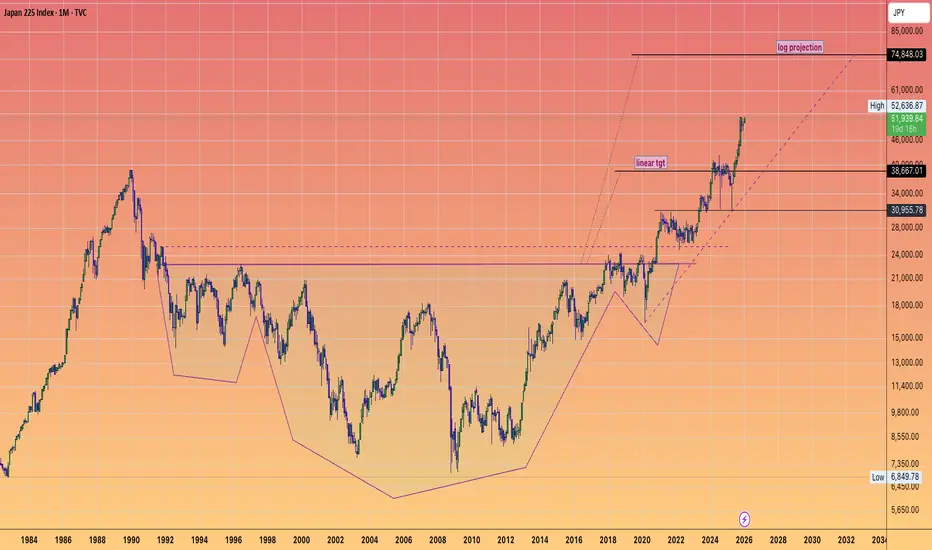
Update: Nikkei 225 Hits 52k. The Log Extension still the Magnet!The Nikkei 225 closed the first full week of 2026 at 51,939.89, marking a significant recovery from its mid-week dip to nearly 51,000. Here is why the structural bull case for your log target remains robust:
The "Takaichi" Tailwinds: The market is currently fueled by "Sanaenomics" (the policies of Prime Minister Sanae Takaichi), which focus on expansionary fiscal measures and a pro-growth stance that favors reflation over aggressive interest rate hikes.
Earnings Dominance: Heavyweights like Fa
Granules India: Inverse head and shoulders continuationKey Bullish Drivers for Investors:
Major Accumulation Zone: The stock has spent nearly two years building a strong base. This massive "Cup" formation indicates a significant transfer of shares from weak hands to long-term institutional buyers.
Handle Consolidation: The recent price action at the right side of the cup shows a healthy "Handle" formation, which is a final shakeout before a major bullish move.
Linear vs. Log Targets:
Linear Target: Projected at ₹837, offering a substantial upside
Bank of Japan Losing Credibility. USDJPY eyes breakout. Continued or large scale QE, capped yields and reluctance to normalise (or being forced back in to easing during a downturn) would anchor Japanese yields far below peers encouraging capital outflows and undermining confidence in the currency.
A shrinking and ageing population chronic fiscal deficits very high public debt and history of trade deficits in recent years represent structural headwinds that can justify a weaker Yen if investors start to question long-run debt sustainability.
With
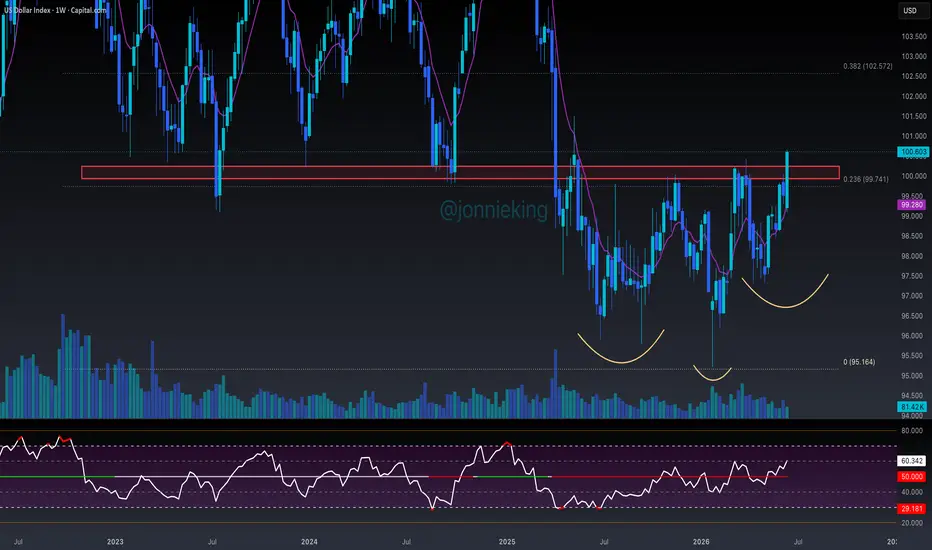
$DXY Massive Weekly Close - Bearish for RiskMassive Weekly Close for TVC:DXY back above $100.60 where it reclaimed the .236 Fib
It has not traded this high for over a year.
Next week it will work on flipping previous support.
Note the Inverse Head and Shoulders and rise above the 9W EMA with bullish divergence.
Terrible for risk assets if the dollar starts pumping.
Yield Curve Inversion IHS Breakout - Recession WarningMORE RECESSION INDICATORS FLASHING 🚨
The Yield Curve Inversion chart appears to have broken out of an Inverse Head & Shoulders pattern reclaiming the 50MA.
Note the constant higher lows and higher highs since this trend started making its way back to inversion in 2011.
probably nothing 👀
Compounder or Trap? Examining $Dixon Technologies’ Growth Runway5 Bullish Insights for ATH's
IT Hardware & Laptop PLI: Dixon isn't just a smartphone assembler anymore.
Their foray into IT hardware and laptops (under the latest PLI schemes) opens up a massive total addressable market (TAM) that is significantly larger than their legacy mobile business. This is a "new leg" of growth the market hasn't fully digested.
Vertical Integration (The "Value Chain" Moat): They are aggressively moving from simple sub-assembly to "Full Box Build" manufacturing.
By doi
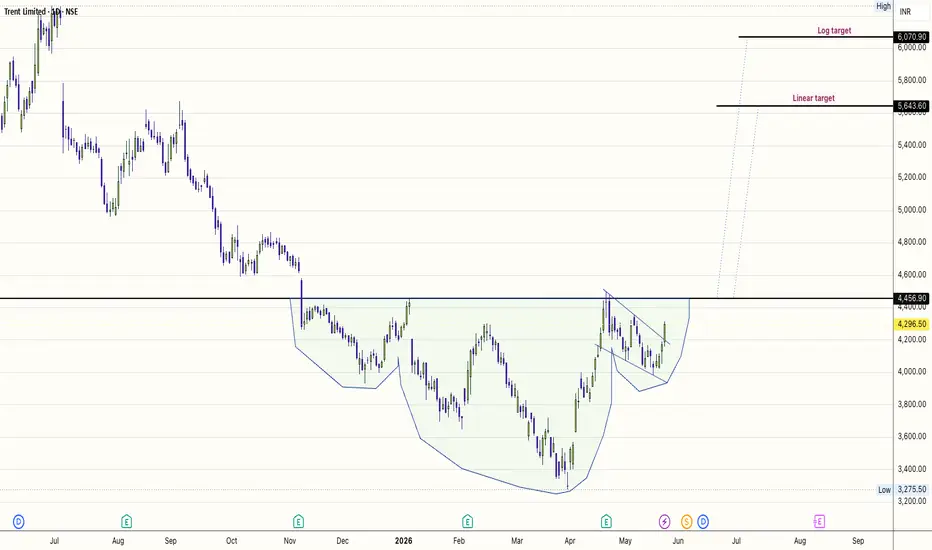
TRENT: The Bear-to-Bull Pivot🏬 🏬 🏬
The TRENT reversal is taking shape, and the structure is textbook. We aren’t guessing; we’re playing the pattern.
The Setup:
The Inverse Head and Shoulders has formed. Entries here represent an incredibly high reward-to-risk ratio.
The Entry: We are playing the consolidation near the neckline/right shoulder.
The Risk Management: The stop is non-negotiable—it sits under the right shoulder. If we break below that, the "bullish reversal" thesis is invalidated, and the pattern has failed.
GA's Retest "Nods" To A Valid ReversalOANDA:GBPAUD has not only delivered a Breakout of the Inverse Head and Shoulders Pattern but to end last week, we got a Retest of this Breakout at the Neckline @ 1.86998!
As this week starts, we can see that price opens with a Gap Up after the Retest of the Neckline, this suggest price has found Support!
If the Support from the Neckline that was once Resistance to help form the pattern holds, we can expect OANDA:GBPAUD to continue rising!
The next area of Resistance will come from the Fal
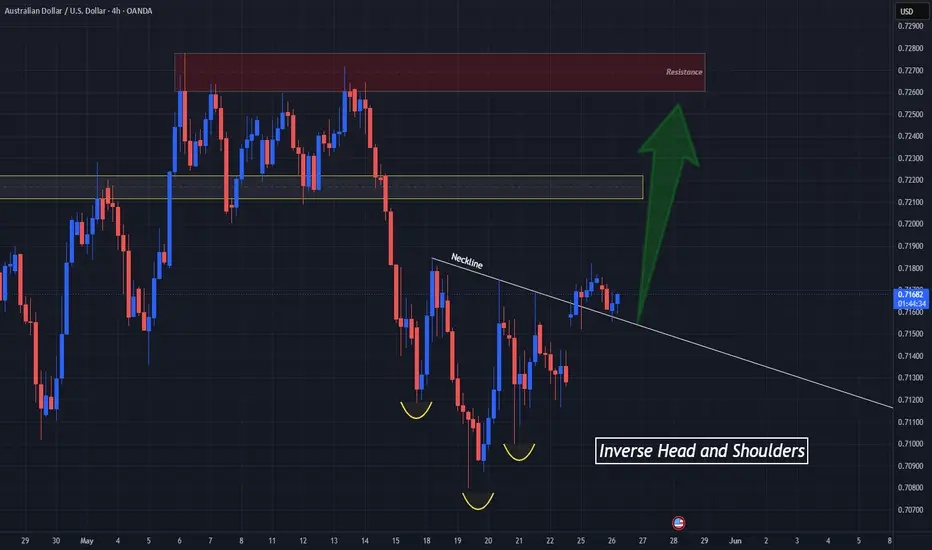
AU Reversal Points to Potential USD WeaknessOANDA:AUDUSD has completed what looks to be a Breakout and, just this morning, a Retest of the Breakout of the Inverse Head and Shoulders Pattern!
An Inverse Head and Shoulders Pattern is a Bullish Reversal Pattern that suggest Bulls have taken over the pair and price will be looking to move to the upside.
Now as long as the "Neckline" of Resistance of the Pattern remains strong and holds price as Support, we could see OANDA:AUDUSD make a move up to the next Resistance Area!
ICICI PRULIFE – Ready for Upside or Trap?ICICI PRULIFE – Ready for Upside or Trap? 🔍
📌 Trade / Swing Setup
• CMP: ₹678
• SL: ₹599
• Target: ₹797
📍 Structure & Logic
• After a sharp fall, stock failed once at 61.8% Fib and corrected
• Now re-attempting breakout from the same zone
• Structure suggests two possibilities:
1️⃣ Rounding bottom → direct breakout above ₹678
2️⃣ Inverse H&S → short consolidation, then breakout
• Key confirmation level: ₹694
– Sustained move above this = upside confirmed
• In both cases, target structure remai
TATA CONSUMER PRODUCTS – Monthly Inverse H&S | Strength Building🟦 TATA CONSUMER PRODUCTS – Monthly Inverse H&S | Strength Building
Tata Consumer Products is forming a clear inverse head & shoulder pattern on the monthly chart, indicating a potential medium-term trend reversal.
💰 Trade / Positional Plan
• CMP: ₹1181
• Stop Loss: ₹1030
🎯 Targets
• ₹1253
• ₹1322
• ₹1566 (pattern projection)
FMCG as a sector is trading near the 200-WMA, a zone which historically holds unless there is extreme panic (like COVID). In that context, leaders tend to bounce first,
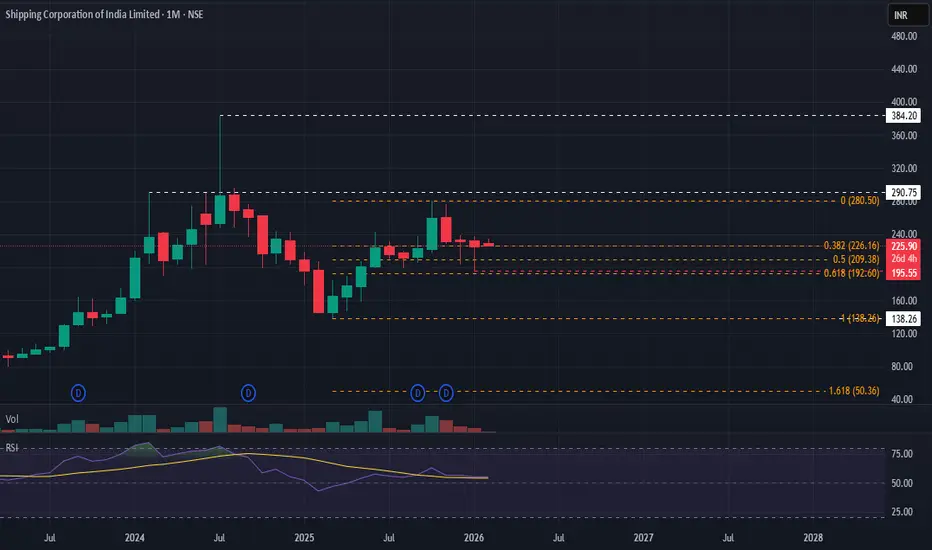
SHIPPING CORPORATION OF INDIA (SCI) – Ready for Big Bounce?🟦 SHIPPING CORPORATION OF INDIA (SCI) – Ready for Big Bounce?
Shipping Corporation of India is showing early signs of a potential upside bounce, though this is still a pre-emptive setup and requires patience.
📊 Technical View
• Possible Inverse Head & Shoulder forming
• Right shoulder under formation
• Break & sustain above ₹280 = confirmation
• Stock corrected to 61.8% Fibonacci (~₹192) and has held this support multiple times
• Budget allocation towards shipbuilding adds a positive backdrop
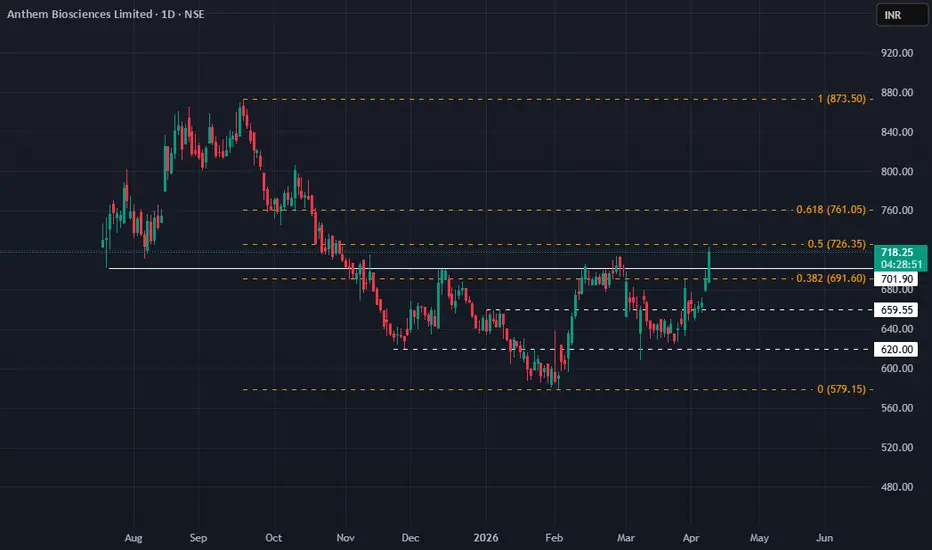
Anthem Biosciences Ltd – Inverse H&S Reversal Setup📊 Anthem Biosciences Ltd – Inverse H&S Reversal Setup
CMP: 717
Trigger: Sustained above 701 (trendline breakout)
Targets: 761 / 808 / 873
SL: 648 (strict)
🧠 Setup Logic:
Fall: 873 → 579 → now reversal structure
Inverse Head & Shoulder breakout
Trendline breakout: 701
Sustaining above 38.2% Fibonacci
👉 Conclusion: Pre-emptive reversal (early breakout stage)
🎯 Trade Plan:
Entry: Above 701 (avoid fake breakout)
Confirmation:
✔ Sustaining above breakout level
✔ Volume support preferred
⚠️ Clari