S&P 500 Daily Chart Analysis For Week of May 29, 2026Technical Analysis and Outlook:
The Index has achieved a notable accomplishment this week by completing the Outer Index Rally at 7,600.
At present, the market is poised for an In-Force retracement, with a targeted support level at Mean Support 7,520. There exists a potential extension to Mean Support at 7,451, as the downward momentum is likely to restrict opportunities for profit-taking.
Forecasts for the upcoming trading sessions indicate that the Index will remain focused on retesting the
Investing
EUR/USD Daily Chart Analysis For Week of May 29, 2026Technical Analysis and Outlook:
In this week's trading session, the Eurodollar rebounded sharply from Mean Support 1.159 and is currently advancing towards the projected target of Mean Resistance at 1.156.
Market players trading the Euro currency should recognize that upon the realization of the designated upside target, the currency may extend its upside journey to Mean Resistance 1.174.
However, traders/investors should be aware that this interim bounce is a precursor to the main target of t
Bitcoin(BTC/USD) Daily Chart Analysis For Week of May 29, 2026Technical Analysis and Outlook:
This week's trading session has seen a significant decline in Bitcoin's value. Current market analysis indicates that Bitcoin is trading between the Mean Resistance level at $74,000 and the Mean Support level at $72,500. There is strong anticipation that the price will continue to decline, ultimately reaching its primary target, known as the Inner Coin Dip, set at $71,400.
Market participants should be aware that once the Inner Coin Dip at $71,400 is reached, a
US Savings Rate Collapsing!Anyone telling you “the economy is doing great” needs to explain this chart.
Personal savings are collapsing back toward crisis-level territory. That means households are not thriving — they are burning cash, leaning on credit, or cutting back.
A strong economy builds savings.
A stressed economy consumes them.
This is not political; these are facts based on empirical evidence.
Let’s push it to 7,000 and share so I can help others as well. We'll keep building a community grounded in raw trut
$MU getting accumulated with PT $140-220- NASDAQ:MU GAAP eps is growing substantially in 2025 and 2026 but market hasn't rewarded NASDAQ:MU
- It appears that whales are accumulating the stock and/or suspicious of NASDAQ:MU future demand.
- If analyst expectation and company's projection is true then this stock is grossly undervalued.
Based on the fundamentals:
Year | 2025 | 2026 | 2027
Gaap EPS | 6.32 | 9.65 | 11.27
EPS growth | 730.48% | 52.72% | 16.80%
Bear case ( for. p/e = 15 ) | $94.8 | $144.75 | $169.05
Base case (
The key is whether it can break above 3.650
Hello?
Nice to meet you, fellow traders.
If you "follow" me, you can always get new information quickly.
Have a great day.
------------------------------------
If the price maintains above 2.144 and above the M-Signal indicator on the 1M chart, an uptrend is expected to begin.
-
If an uptrend begins,
1st: 3.650
2nd: 7.008
You need to check if it finds support in the vicinity above these levels.
Therefore, the key is whether the price can maintain a level above 2.144.
Since the StochRSI
Start of Uptrend: Upon breakout of 1.5 ~ 1.9669
Hello?
Nice to meet you, fellow traders.
If you "follow" me, you can always get new information quickly.
Have a great day.
------------------------------------
The uptrend for XRP is expected to begin as it breaks upwards through the 1.5 ~ 1.9669 range.
Therefore, we need to observe whether it rises to the 1.5988 level and shows signs of support.
If it fails to rise above 1.5988, we should consider it to be in the mid-to-long-term investment zone and devise appropriate countermeasures.
I
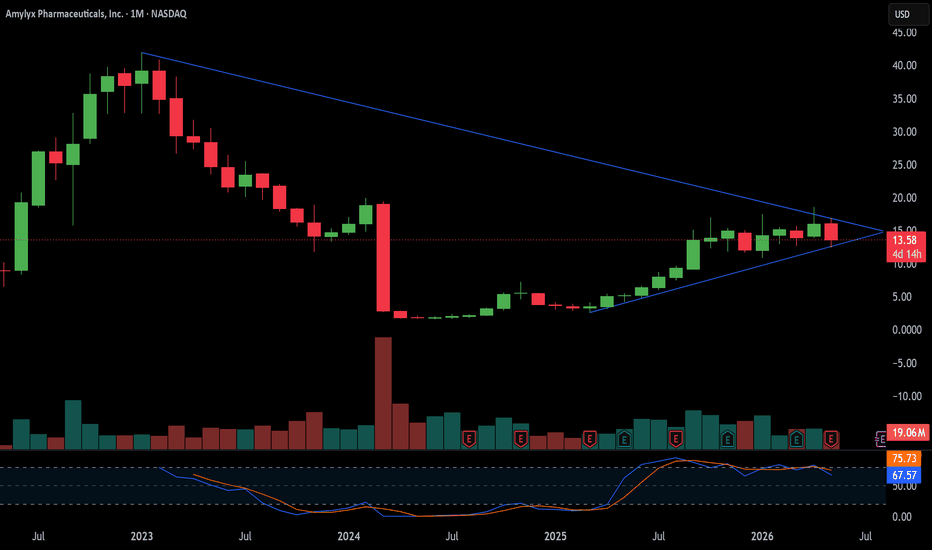
Will Amylyx Survive Its Radical Rare Disease Pivot?Macroeconomics and Economics
Amylyx Pharmaceuticals faces a brutal macroeconomic landscape today. Rising interest rates heavily punish pre-revenue biotech companies. Investors demand rapid clinical catalysts to justify massive capital expenditures. Amylyx maintains a cash runway expected to last into 2028. This financial buffer provides crucial breathing room for clinical trials. The company currently burns significant cash on late-stage research. First-quarter 2026 R&D expenses reached nearly
S&P 500 Daily Chart Analysis For Week of May 22, 2026Technical Analysis and Outlook:
The Index has demonstrated a double whammy in this week's trading activities. Initially, it achieved our established Mean Support target of 7,341, after which the S&P 500 rebounded and retested our Key Resistance level at 7,501.
At present, the Index is positioned in a downward trading mode, targeting a decline to the Mean Support level of 7,425, with a potential extension to the Mean Support at 7,341, as downward momentum continues to prevail.
In anticipation
EUR/USD Daily Chart Analysis For Week of May 22, 2026Technical Analysis and Outlook:
In the previous week's trading session, the Eurodollar declined sharply and is currently moving towards our projected target at the Inner Currency Dip level of 1.156.
Market participants engaged in Euro trading should recognize that upon completion of the Inner Currency Dip at 1.156, there is an expectation of upward momentum toward the primary target, the Mean Resistance level at 1.162. Furthermore, there exists the potential for this In-Force rebound to extend
Bitcoin(BTC/USD) Daily Chart Analysis For Week of May 22, 2026Technical Analysis and Outlook:
In the most recent trading session, Bitcoin has demonstrated a significant pullback. Current market analysis shows that the cryptocurrency is trading downward toward the Mean Support level of $73,800. Should this downward trajectory persist, Bitcoin will decline further to its primary target, the Inner Coin Dip, which is positioned at $71,400.
Market participants must acknowledge that upon completion of the Inner Coin Dip at $71,400, there will be upward momentu
Simple Math that separates profitable investors from the crowdMost newbie traders are looking for a "secret indicator," the perfect entry point, or a signal. But the truth is, the biggest and most consistent money in the market is made not by successful trading, but by basic math and discipline.
1. The Main Mistake Most Traders Make
People try to: earn 100% in a month, constantly catch the bottom and top, trade too often. But market math works differently.
A professional thinks:
"How can I preserve my capital and steadily increase it over the years?"
T
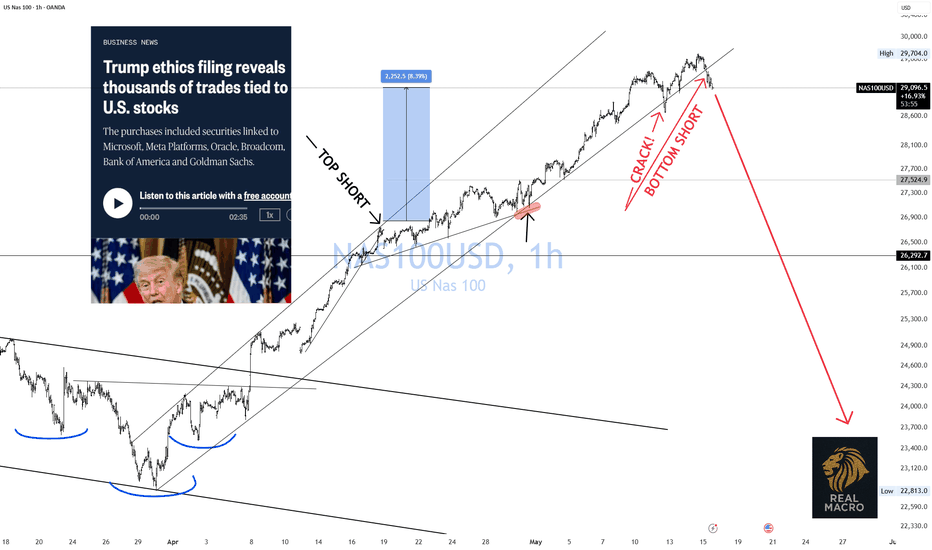
NDX Top Short! or.. Wait For Crack! Update 2NDX Bottom short has come!
Whenever initiating a TOP SHORT in an established uptrend, the likelihood that it keeps running is obviously high. That's why you wait to add to the bottom CRACK! short. To give you a nice cost average. In this case, the price rose 9% addding now gives you a -4.5% drawdown Peanuts for a Macro short trade.
It is important to remember that the -4.5% drawdown applies to the entire position. However, the -9% draw down was only on half of the position. A much smaller am
Support Zone: 1964.96 ~ 2111.42
Hello?
Nice to meet you, fellow traders.
If you "follow" me, you can always get new information quickly.
Have a great day today.
------------------------------------
Among the various indicators set on the chart, the ones we should pay attention to are as follows:
1. Trends that reveal the flow of the chart,
2. Support and resistance points that allow you to set trading points
-
The indicators used to indicate the trend are the M-Signal indicators on the 1M, 1W, and 1D charts.
Therefore,
CrowdStrike +40% Here is What Changed (and What Didn’t)Back on March 16th, I broke down why I was bullish on CrowdStrike from a long-term perspective. Since then, the stock has moved up roughly 40%.
In this update, I walk through what I’m seeing now, why that move matters, and how I’m thinking about the opportunity going forward.
The key point: while the long-term thesis around AI, cybersecurity, and recurring revenue remains intact, this recent move has largely happened without a new earnings cycle. That suggests a shift in sentiment and expectat
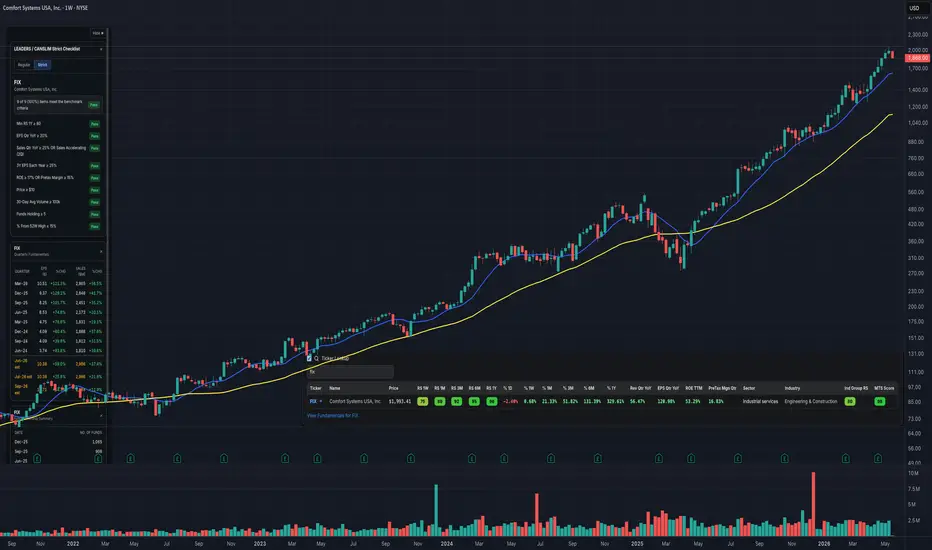
Stop Chasing Stocks. Start Mastering the Real Game.I’m amazed at how much effort people put into trying to find the next big stock, while ignoring the things that actually determine whether they survive long enough to compound capital:
Risk management.
Position sizing.
Trade management.
A disciplined process.
FIX is a great example.
This is not some random name that suddenly showed up on a screen. I’ve talked about FIX for a long time and have been watching it since 2022.
Why?
Because it checks many of the same boxes William O’Nei
SPY Structure Update (Daily Chart)The 10, 20, and 50 EMAs remain in healthy alignment and continue showing constructive upward curvature. The 200 EMA remains below price and is also steadily trending upward, keeping the broader structure constructive across multiple layers.
RSI is currently holding around 68, showing continued participation while remaining in a strong momentum range.
OBV has maintained an upward trend since March 31st and is currently consolidating near recent highs — something I continue watching closely for
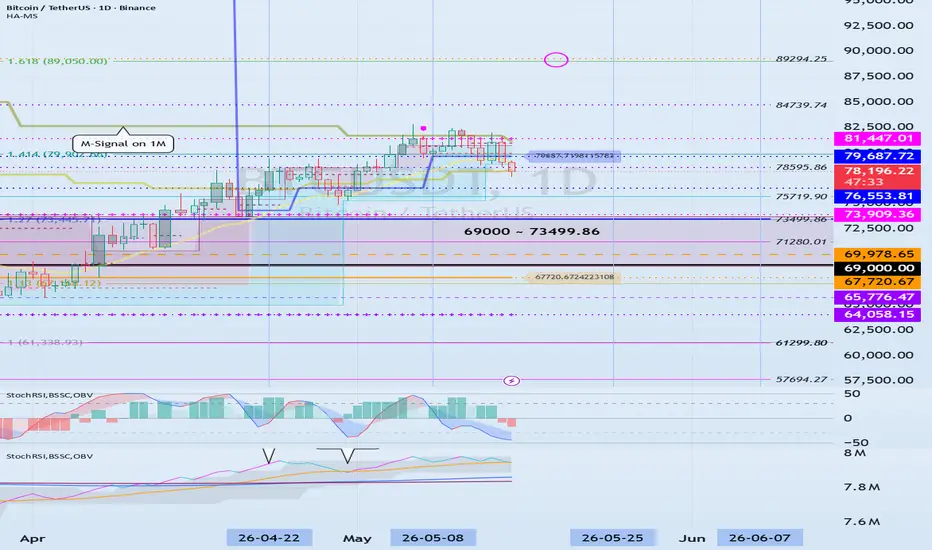
Change in Volatility Period: Around May 25 ~ Around June 7
Hello?
Nice to meet you, fellow traders.
If you "follow" me, you can always get new information quickly.
Have a great day today.
------------------------------------
(1D Chart)
It appears that the volatility period has changed as a downtrend line (4) has formed.
The next period of volatility is expected to run from around May 25 to around June 7.
The most important factor is whether the price can maintain its upward trend above the uptrend line (1).
Therefore, I believe the range from 67
S&P 500 Daily Chart Analysis For Week of May 15, 2026Technical Analysis and Outlook:
The Index has completed the Outer Index Rally by reaching a level of 7,440. During this rally, a new Key Resistance level was established at 7,501. Presently, the Index is trading at the Mean Support level of 7,401, with a potential extension to the Mean Support at 7,341 as upward momentum resumes.
Looking ahead to the upcoming trading sessions, projections suggest that the Index is well-positioned to maintain its upward trajectory, with the next target for the
EUR/USD Daily Chart Analysis For Week of May 15, 2026Technical Analysis and Outlook:
In the current trading session, the Eurodollar has declined sharply, surpassing the established support levels at 1.173, 1.169, and 1.166.
A comprehensive analysis of the Eurodollar market suggests a progressive downward trend toward the designated Inner Currency Dip level at 1.156. Upon reaching this level, market participants should anticipate a substantial rebound toward the concealed target identified as Mean Resistance at 1.162.
Bitcoin(BTC/USD) Daily Chart Analysis For Week of May 15, 2026Technical Analysis and Outlook:
In the current trading session, Bitcoin has shown notable gyrations, oscillating between the completed of the Inner Coin Rally at $82,700 and the substantial Mean Support level at $79,300. This fluctuation highlights the dynamical essence of the Bitcoin market.
Currently, market analysis suggests that Bitcoin is likely to trend downward towards the Mean Support level of $78,000. Should this downward trajectory continue, Bitcoin could decline further to the next
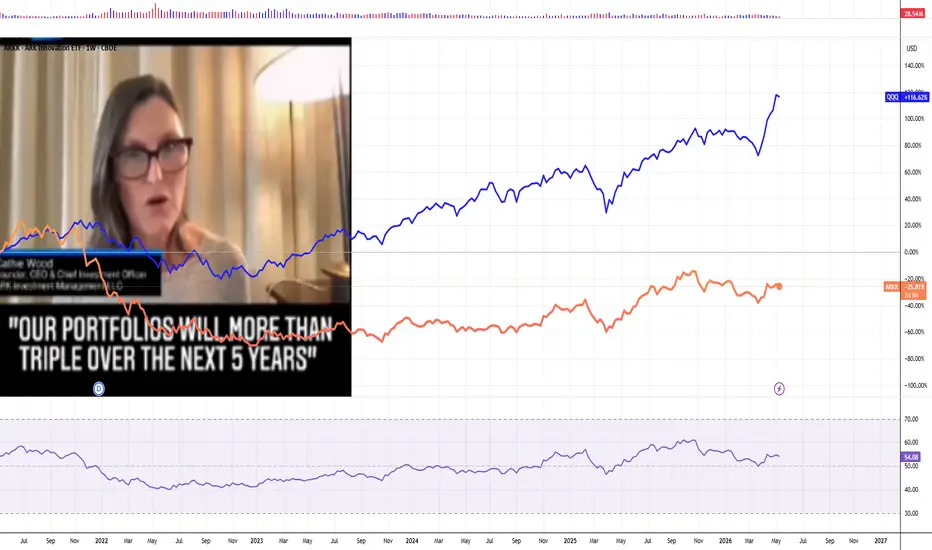
21st-Century Scammers, or How Cathie Wood Fed Everyone Fire WoodIn the modern financial arena, the loudest conviction often commands the most attention, yet the market remains stubbornly indifferent to how well a story is told. Cathie Wood, the face of innovation-led investing, famously declared that her portfolios would more than triple over a five-year horizon. However, as of May 2026, the divergence between that bold prophecy and the cold reality of the charts is impossible to ignore.
The visual contrast is staggering. As shown in the attached chart, the
Why position size is more important than entry point? Most beginners are looking for the perfect indicator or secret strategy, but the problem is almost always another position size.
It is the position size that decides:
📈 will you survive the drawdown?
📉 can you restore the deposit?
Will you remain calm during a market decline?
Position size is one of the key strategic risk parameters.
One deposit - 3 different results:
Let's imagine that Alberto has $10,000.
And he heard about the digital currency Bitcoin.
He buys $$$ and, according
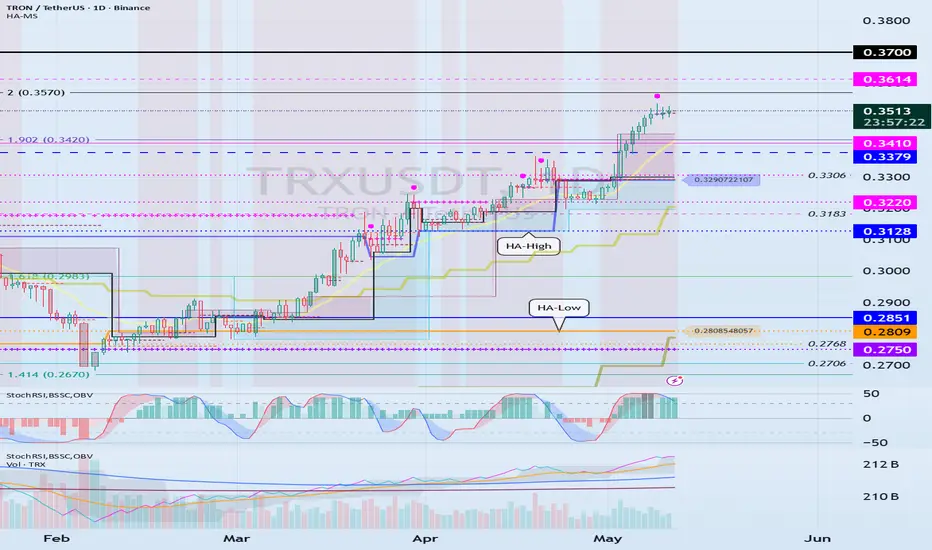
Confirming support in the 0.3410 ~ 0.3614 range
Hello?
Nice to meet you, fellow traders.
If you "follow" me, you can always get new information quickly.
Have a great day today.
------------------------------------
(1M Chart)
The target range is around the Fibonacci ratios 2.618 and 3.618.
To continue the uptrend, the price must maintain a level above 0.3410. -
It appears that significant efforts are being made to defend the price since the issuance of the TRX stablecoin.
Therefore, if possible, it is advisable to continue trading by i