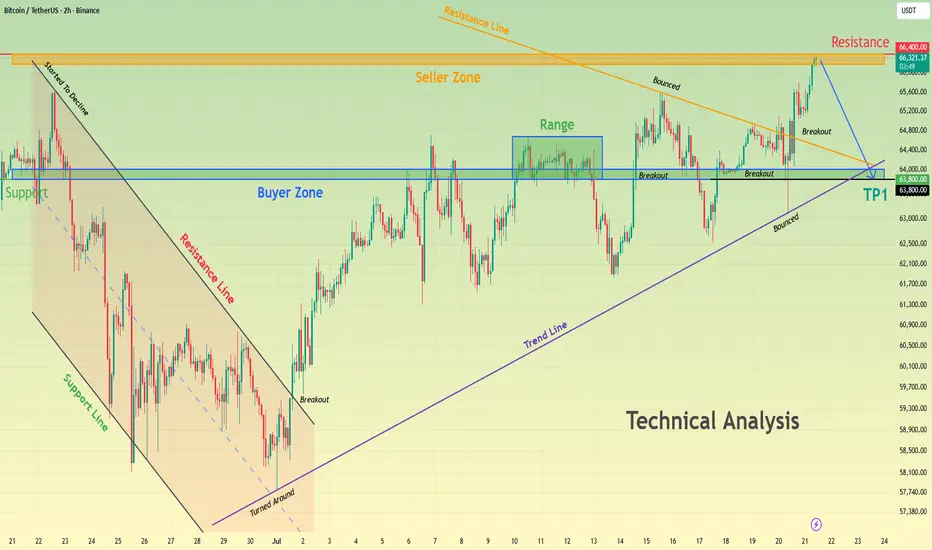
Bitcoin Faces Strong Resistance — Pullback Toward 63,800?Hello traders! Here’s my technical outlook based on the current BTCUSDT (2H) chart structure. BTCUSDT previously broke above a descending channel, confirming a bullish recovery. The rally has now reached the 66,400 Seller Zone, where price is facing strong resistance after an impulsive move higher. Currently, BTCUSDT is trading below the 66,400 Seller Zone while remaining above the 63,800 Buyer Zone. The strong rejection from resistance suggests buyers are losing momentum and sellers may attempt to regain control. As long as BTCUSDT remains below the 66,400 Seller Zone, the bearish scenario remains valid. A rejection from current levels could push price back toward the 63,800 Buyer Zone (TP1), where buyers may attempt to defend support. However, a confirmed breakout above 66,400 would invalidate the bearish outlook and open the door for further upside. Please share this idea with your friends and click "Boost" 🚀  Short
Short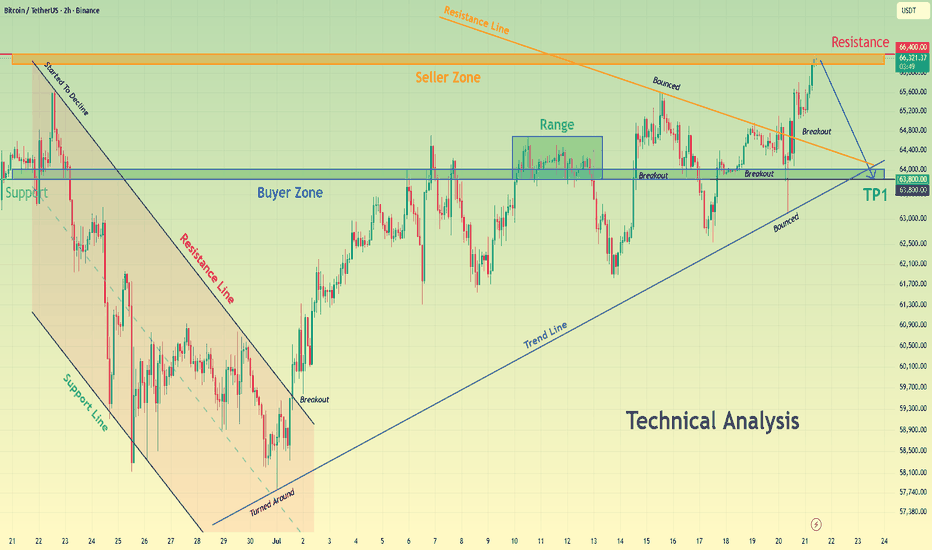
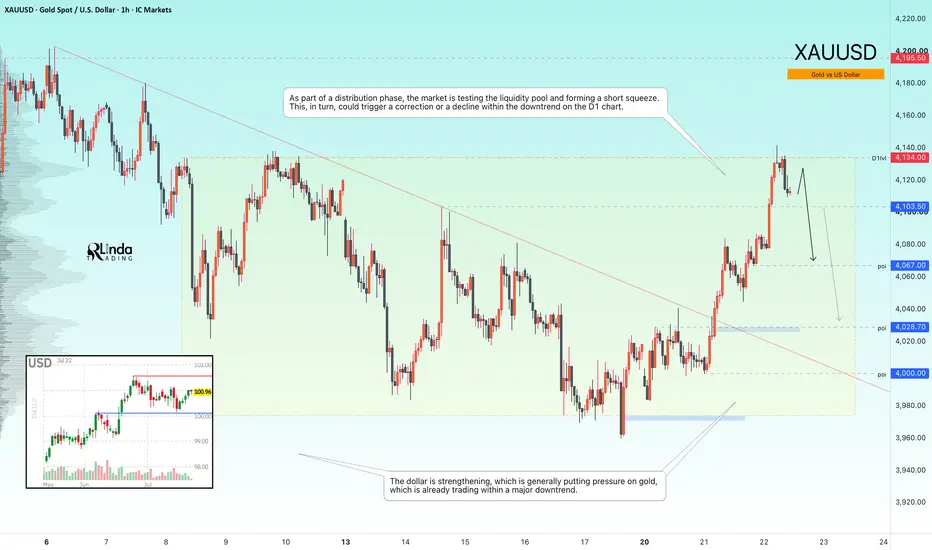
GOLD - The Hunt for Liquidity (Correction) Before the Drop ICMARKETS:XAUUSD is recovering after Thursday's sharp decline, trading around $4,060 on Friday. This rebound may represent nothing more than a liquidity-building move before the broader downtrend resumes
The U.S. dollar continues to strengthen, while gold remains under selling pressure, reinforcing the prevailing bearish market structure. The broader trend remains firmly bearish.
From a technical perspective, gold continues to face pressure from geopolitical uncertainty and hawkish Federal Reserve expectations. The current recovery appears to be a countertrend correction toward key liquidity zones, potentially building momentum for another decline toward the 4000–3983 support area. The next directional move will largely depend on the U.S. dollar, oil prices, PMI data, and developments surrounding the geopolitical conflict.
Bearish drivers: Stronger hawkish Fed expectations, Rising oil prices, Continued U.S. dollar strength, Profit-taking, Bearish technical structure
Bullish drivers: U.S. dollar weakness triggered by new tariff developments, Geopolitical de-escalation, Weaker-than-expected PMI data
Resistance levels: 4061, 4067, 4109
Support levels: 4021, 4000, 3983
Within the current countertrend correction, gold is testing the first trigger zone at 4061–4067. A short squeeze around this area could trigger another reversal and send price back toward support. However, a deeper correction toward the 4109–4134 liquidity zone before the next bearish leg cannot be ruled out
Best regards,
R. Linda  Short
Short
Long 
Short 
How to Trade Consolidation on Gold Easily. XAUUSD Strategy
In article, you will learn how to identify and trade consolidation on Gold easily.
I will share with you my consolidation trading strategy and a lot of useful XAUUSD trading tips.
1. How to Identify Consolidation
In order to trade consolidation, you should learn to recognize that.
The best and reliable way to spot consolidation is to analyse price action.
Consolidation is the state of the market when it STOPS updating higher highs & higher lows in a bullish trend OR lower lows & lower highs in a bearish trend.
In other words, it is the situation when the market IS NOT trending.
Most of the time, during such a period, the price forms a horizontal channel.
Above is a perfect example of a consolidation on Gold chart on a daily.
We see a horizontal parallel channel with multiple equal or almost equal highs and lows inside.
For a correct trading of a consolidation, you should correctly underline its boundaries .
Following the chart above, the upper boundary - the resistance, is based on the highest high and the highest candle close.
The lowest candle close and the lowest low compose the lower boundary - the support.
2. What Consolidation Means
Spotting the consolidating market, it is important to understand its meaning and the processes that happen inside.
Consolidation signifies that the market found a fair value.
Growth and bullish impulses occur because of the excess of demand on the market, while bearish moves happen because of the excess of supply.
When supply and demand find a balance, sideways movements start.
Look at the price movements on Gold above.
First, the market was rising because of a strong buying pressure.
Finally, the excess of buying interest was curbed by the sellers.
The market started to trade with a sideways range and found the equilibrium
At some moment, demand started to exceed the supply again and the consolidation was violated . The price updated the high and continued growth.
Usually, the violation of the consolidation happens because of some fundamental event that makes the market participants reassess the value of the asset.
At the same time, the institutional traders, the smart money accumulate their trading positions within the consolidation ranges. As the accumulation completes, they push the prices higher/lower, violating the consolidation.
3. How to Trade Consolidation
Once you identified a consolidation on Gold, there are 2 strategies to trade it.
The resistance of the consolidation provides a perfect zone to sell the market from. You simply put your stop loss above the resistance and your take profit should be the upper boundary of the support.
That is the example of a long trade from support of the consolidation on Gold.
The support of the sideways movement will be a safe zone to buy Gold from. Stop loss will lie below the support zone, take profit will be the lower boundary of the resistance.
AS the price reached a take profit level and tested a resistance, that is a short trade from that.
You can follow such a strategy till the price violates the consolidation and establishes a trend.
The market may stay a very extended period of time in sideways , providing a lot of profitable trading opportunities.
What I like about Gold consolidation trading is that the strategy is very straightforward and completely appropriate for beginners.
It works on any time frame and can be used for intraday, swing trading and scalping.
❤️Please, support my work with like, thank you!❤️
I am part of Trade Nation's Influencer program and receive a monthly fee for using their TradingView charts in my analysis.
Education 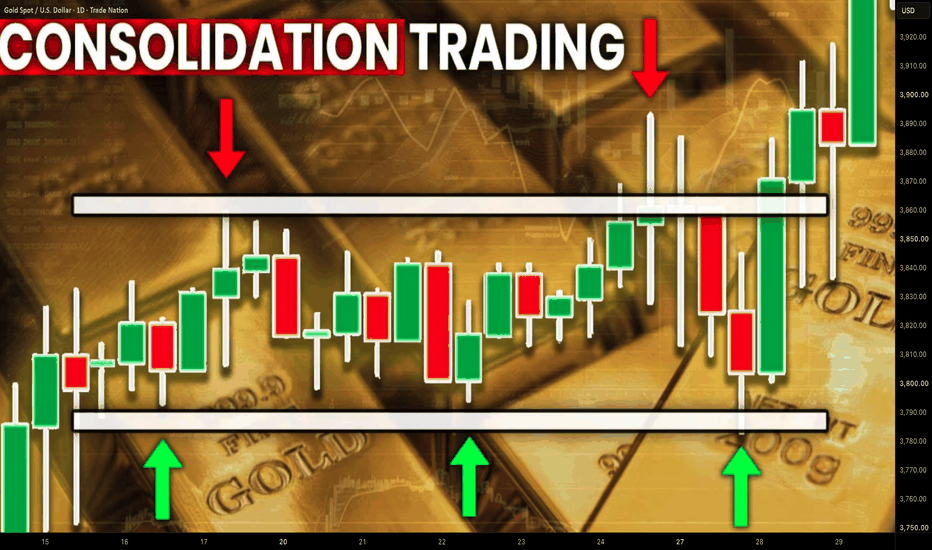
XAUUSD Short: Rejects Channel Resistance, Downside Toward 3,970$Hello traders! Here’s my technical outlook based on the current XAUUSD (2H) chart structure. XAUUSD continues to trade inside a descending channel, maintaining the broader bearish trend. After losing the 4,160 Supply Zone, price made several recovery attempts, but each was rejected near the channel resistance, confirming continued selling pressure.
Currently, XAUUSD is trading above the 3,970 Demand Zone while remaining below the 4,160 Supply Zone. The latest rejection from channel resistance suggests sellers are still in control.
As long as XAUUSD remains below the 4,160 Supply Zone and respects the descending channel, the bearish scenario remains valid. A continuation lower could push price toward the 3,970 Demand Zone (TP1). However, a breakout above 4,160 and the channel resistance would weaken the bearish outlook. Manage your risk! Short 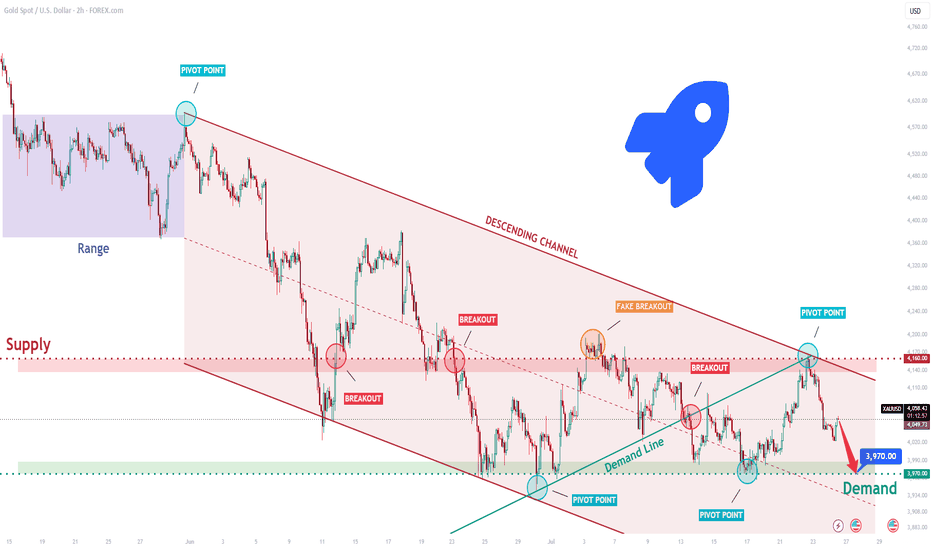
BTCUSDT: Retests Support Before Potential Rally Toward $68KHello everyone, here is my breakdown of the current BTCUSDT chart structure.
Market Analysis
BTCUSDT previously traded inside a broad descending channel before breaking below its lower boundary, confirming a strong bearish move. After finding support near the 64,300 Support Zone, buyers regained control and price formed a large symmetrical triangle, with multiple breakouts and successful retests signaling improving bullish momentum.
Currently, BTCUSDT is trading above the 64,300 Support Zone while remaining below the 68,000 Resistance Zone. The recent rebound from triangle support suggests buyers continue defending higher lows and are attempting to extend the recovery.
My Scenario & Strategy
As long as BTCUSDT remains above the 64,300 Support Zone and continues respecting the ascending triangle support, the bullish scenario remains valid. A continuation higher could push price toward the 68,000 Resistance Zone (TP1).
However, if BTCUSDT breaks below the 64,300 Support Zone and loses triangle support, bullish momentum would weaken and a deeper pullback could develop.
That’s the setup I’m tracking. Thank you for your attention, and always manage your risk. Long 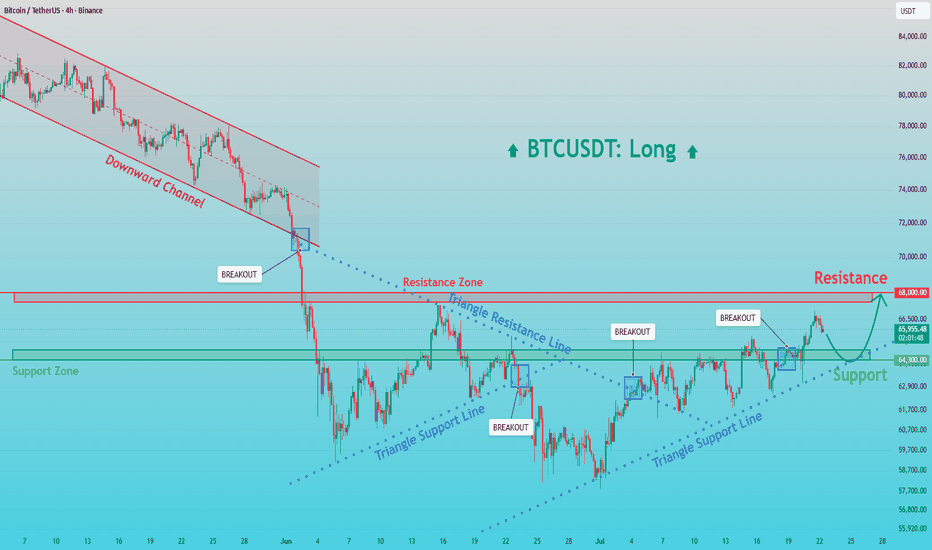
Euro Rebounds From Support — Can Buyers Reach 1.1460?Hello everyone, here is my breakdown of the current EURUSD chart structure.
Market Analysis
EURUSD previously traded inside a descending channel before breaking above the upper boundary, confirming a bullish shift in market structure. After establishing a strong base near the 1.1400 Support Zone, buyers continued to defend higher lows, allowing price to develop inside an ascending channel.
Currently, EURUSD is trading above the 1.1400 Support Zone while remaining below the 1.1460 Resistance Zone. The recent pullback held above channel support, suggesting buyers are still in control as long as the bullish structure remains intact.
My Scenario & Strategy
As long as EURUSD remains above the 1.1400 Support Zone and continues respecting the ascending channel, the bullish scenario remains valid. A continuation higher could push price toward the 1.1460 Resistance Zone (TP1).
However, if EURUSD breaks below the 1.1400 Support Zone and loses the ascending channel, the bullish outlook would weaken, allowing sellers to regain short-term control.
That’s the setup I’m tracking. Thank you for your attention, and always manage your risk. Gold Technical Analysis: Breakout Opens Path Toward 4,200$Hello traders! Here’s my technical outlook based on the current XAUUSD (1H) chart structure. XAUUSD previously traded inside a descending channel before forming a Double Bottom, where buyers regained control and triggered a recovery. Price later broke above a second descending channel, confirming strengthening bullish momentum. Currently, XAUUSD is trading above the 4,100 Buyer Zone while remaining below the 4,200 Seller Zone. The recent breakout and successful retest of support suggest buyers remain in control. As long as XAUUSD holds above the 4,100 Buyer Zone, the bullish scenario remains valid. A continuation higher could push price toward the 4,200 Seller Zone (TP1). However, a move back below the 4,100 Buyer Zone would weaken the bullish outlook. Please share this idea with your friends and click "Boost" 🚀 Long 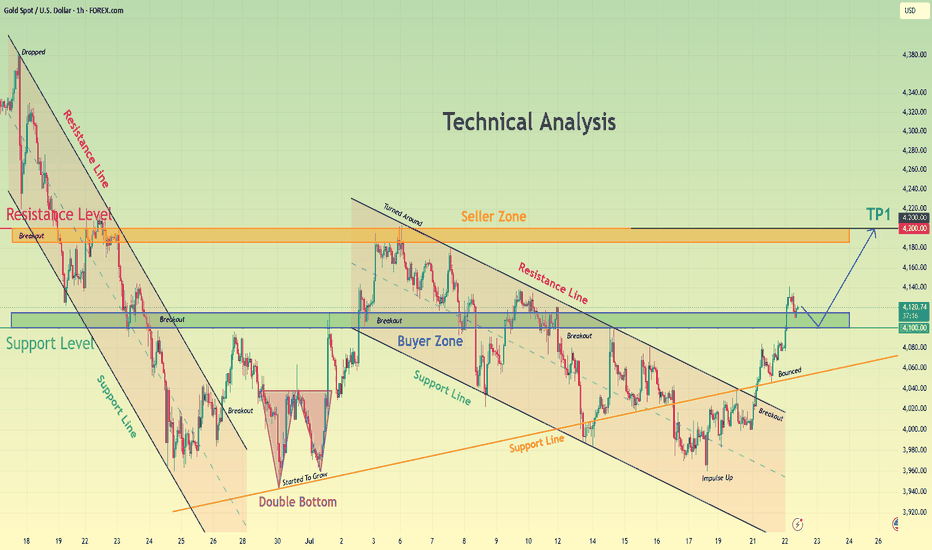
BTC - Keep It SimpleSometimes, the best analysis is the simplest one.
Bitcoin (BTC) continues to trade within the rising blue channel, keeping the short-term trend constructive. 📈
📌 As long as BTC remains inside this rising channel, the path of least resistance remains bullish, and we will continue to favor trend-following long setups.
However, the blue structure zone around $64,000–$64,500 remains the key level to watch.
A decisive break below this structure would invalidate the current bullish scenario, shift the momentum from bullish to bearish, and increase the probability of a deeper correction.
As always, rather than predicting the next move, we will wait for price confirmation before considering any positions.
Will buyers keep defending the channel, or will sellers finally break this key support? 🤔
⚠️ Disclaimer: This is not financial advice. Always do your own research and manage risk properly.
📚 Stick to your trading plan regarding entries, risk, and management.
Good luck! 🍀
All Strategies Are Good; If Managed Properly!
~Richard Nasr GOLD - A false breakout of resistance within a bearish trendICMARKETS:XAUUSD has broken out of its short-term descending channel within the current distribution phase and is now testing the 4134 liquidity zone while printing fresh intermediate highs. Despite the technical recovery, the broader fundamental backdrop remains weak
Gold remains caught between geopolitical support and pressure from hawkish Federal Reserve expectations and elevated real yields. Analysts note that a sustainable recovery would likely require lower oil prices, declining bond yields, and softer expectations for further monetary tightening. Until then, the upside potential is expected to remain limited.
At the moment, oil prices continue to rise, while the U.S. dollar has strengthened for a fifth consecutive session, maintaining its broader bullish trend.
Bullish drivers: Geopolitical de-escalation, Falling oil prices, A weaker U.S. dollar, Softer expectations for Fed rate hikes
Bearish drivers: Escalation of geopolitical tensions, Rising oil prices, Hawkish Fed rhetoric, Continued U.S. dollar strength
Resistance levels: 4124, 4134, 4195
Support levels: 4103, 4067, 4028
Technically, the market is testing a key liquidity pool within the current distribution phase and may be forming a short squeeze. If bears manage to keep price below the 4124–4134 resistance zone, it could trigger another leg lower in line with the broader daily bearish trend
Best regards,
R. Linda Short 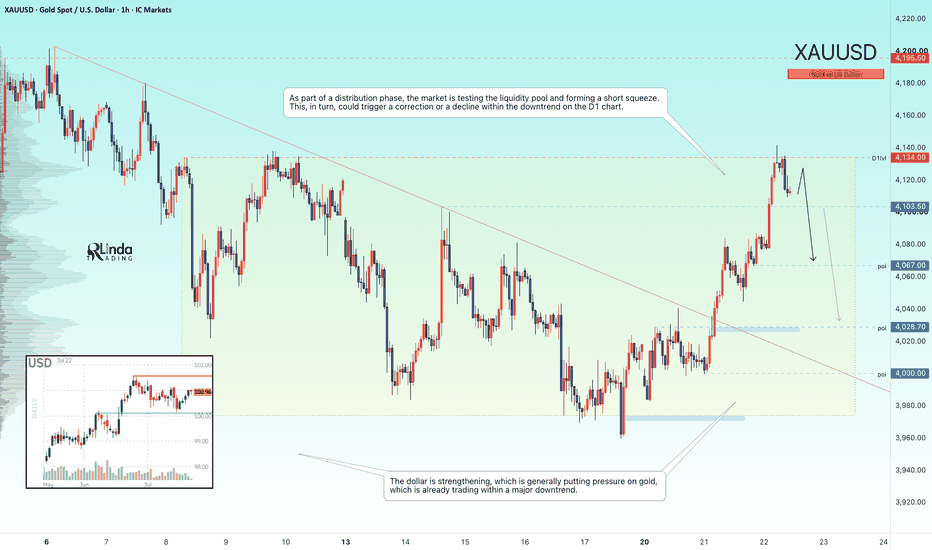
 Long
Long
 Long
Long
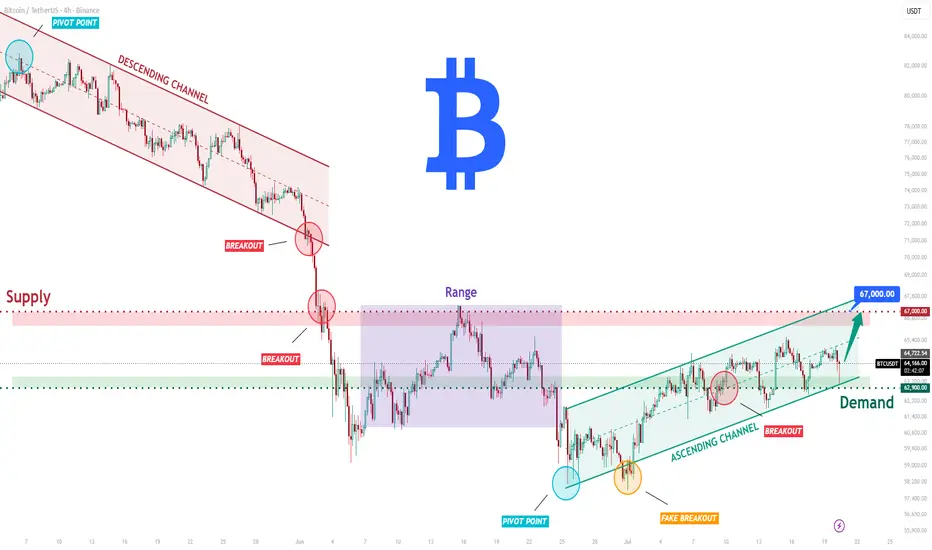
BTCUSDT Long: Climbs Toward $67K Resistance – Bulls in Control?Hello traders! Here’s my technical outlook based on the current BTCUSDT (4H) chart structure. BTCUSDT previously traded inside a broad descending channel before breaking below support, confirming a bearish shift. After consolidating inside a range, buyers regained control from the 62,900 Demand Zone and pushed price into an ascending channel. The recovery has now reached the 67,000 Supply Zone.
Currently, BTCUSDT is trading above the 62,900 Demand Zone while approaching the 67,000 Supply Zone. Price continues to respect the ascending channel, although the nearby supply area may trigger selling pressure.
As long as BTCUSDT remains above the 62,900 Demand Zone and holds within the ascending channel, the bullish scenario remains valid. A continuation higher could push price toward the 67,000 Supply Zone (TP1). Manage your risk! Long 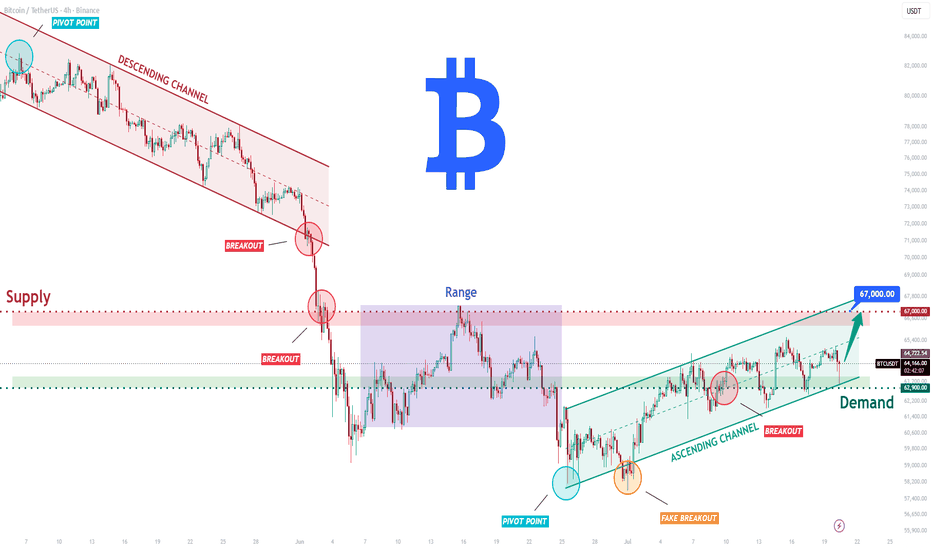
Pullback Before the Next Move Higher?Hi everyone!🐻🦬🌴
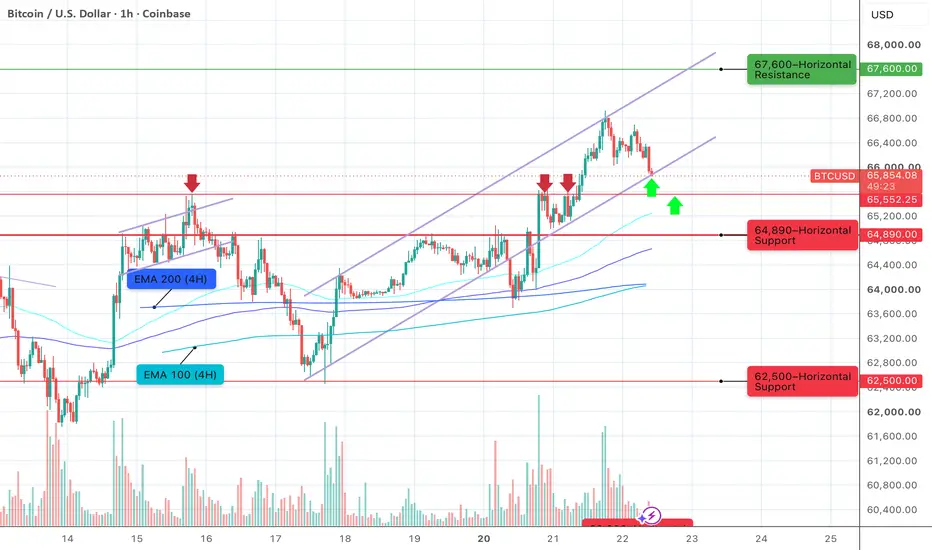
Bitcoin came within just $676 of my 67,600 target yesterday before pulling back 👾
❗️Looking at the way price broke above 65k, I don’t think this rally is over yet. To me, this is only the beginning of the current bullish leg. So far, the move continues to develop inside the ascending parallel channel shown on the chart.
Another important development is the new local support at 66,550. This level acted as resistance several times over the past week and may now provide support on the way up.
The lower boundary of the channel is by no means a “concrete” level. As you can see, price has already produced several false breakdowns below it. The same goes for 65,500.
Still, during a healthy uptrend, local support levels don’t have to be perfect to stop a pullback. That’s exactly why it’s worth keeping them on the chart.
🦬🚀 Bullish scenario.
As long as Bitcoin holds above 65k, I view the current pullback as a healthy pause before another attempt to break through 67,600.
The next leg higher could start either from the lower boundary of the channel around 65,850 or from the horizontal support at 65,500 (green arrows on the chart🟢).
🐻🪓 Bearish scenario.
If Bitcoin fails to regain and hold above 65k, sellers may take back control, opening the door to a much deeper correction toward:
- 62,500 — Key support where price has been consolidating since early June.
- 60,800 — Local horizontal support.
- 60,000 — Strong horizontal support.
Trade safe, and see you in the next update!
Peace 🌄
⚠️ Disclaimer:
All information shared on this channel is for educational and informational purposes only and is not investment advice. The author is not responsible for your trading decisions. Always manage your risk and make your own decisions. Long 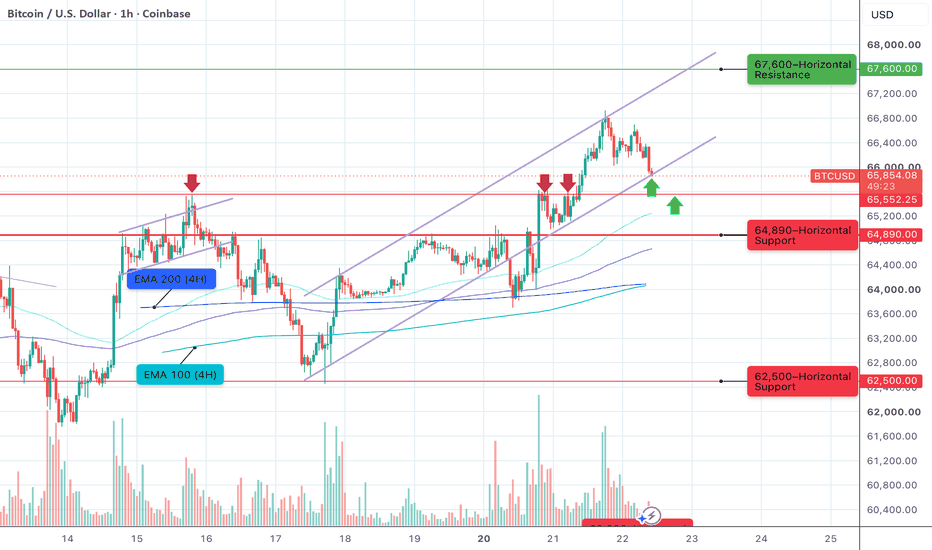
XAUUSD - Downward Channel Continues, Target at 3,790XAUUSD is trading around 4,048 and remains entirely within its H4 downtrend channel. Previous rallies have consistently created lower highs, indicating that buyers lack the strength to break the dominant downtrend structure.
The current macroeconomic context also supports a bearish scenario. The USD is maintaining near its one-week high, while the yield on 10-year US Treasury bonds is around 4.59%. High oil prices continue to fuel inflation concerns and expectations that the Fed may keep interest rates high for longer, thereby increasing the opportunity cost of holding gold.
The price is currently approaching the 4,035–4,080 resistance zone, while also being close to the upper trendline of the channel. If this area continues to be rejected, the rebound may only be a pullback before selling pressure returns.
A H4 candle closing below 3,990 would reinforce the possibility of price heading towards 3,900, and further to the target zone around 3,750–3,790. Short 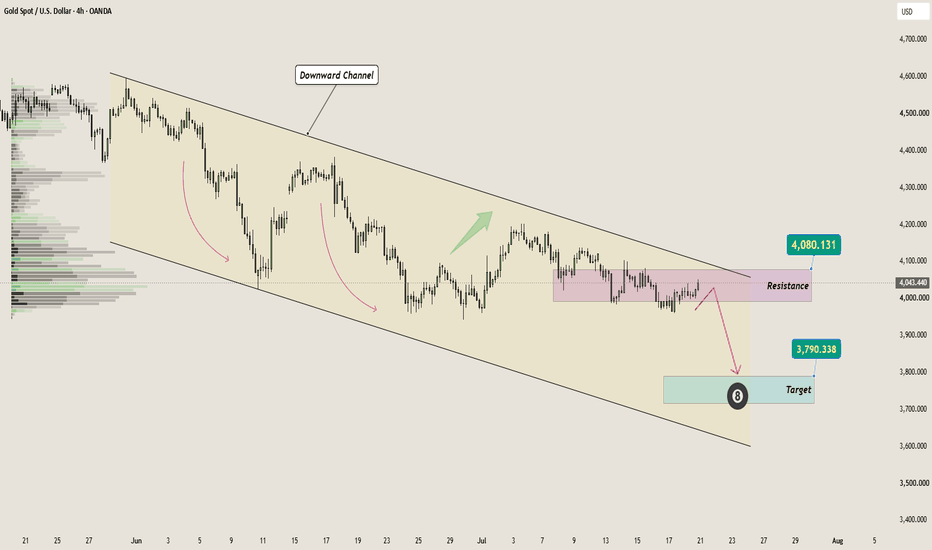

 Short
Short