WTICOUSD 1H: The Gap-Fill Liquidity Run (Short Setup)
1. Market Context
On the 1H chart, Oil is trading within a dominant descending parallel channel. After a minor consolidation near the upper boundary, the price is executing a clean breakdown below the local support level at 70.103. This breakdown officially opens the door for a high-probability run to fill the historical gap down to the 68.107 level.
2. Sentiment & Price Trap Analysis
• The Retail Buyer Trap: Retail traders aggressively bought the local support around 70.500 to 71.000, expec
Pin Bar
XAGUSD 4H: Channel Breakout & Short Squeeze Plan (Long Setup)1. Market Context
On the 4H chart, Silver is currently trading near the upper boundary of a major descending parallel channel. After a deep liquidity sweep at the local bottom where selling pressure exhausted (marked by the "No Buyer" signal near 57.081), the price initiated a strong recovery. It is now consolidating right beneath the critical descending trendline and the key horizontal resistance levels. We are waiting for a confirmed breakout to trigger an explosive upward move.
2. Sentiment
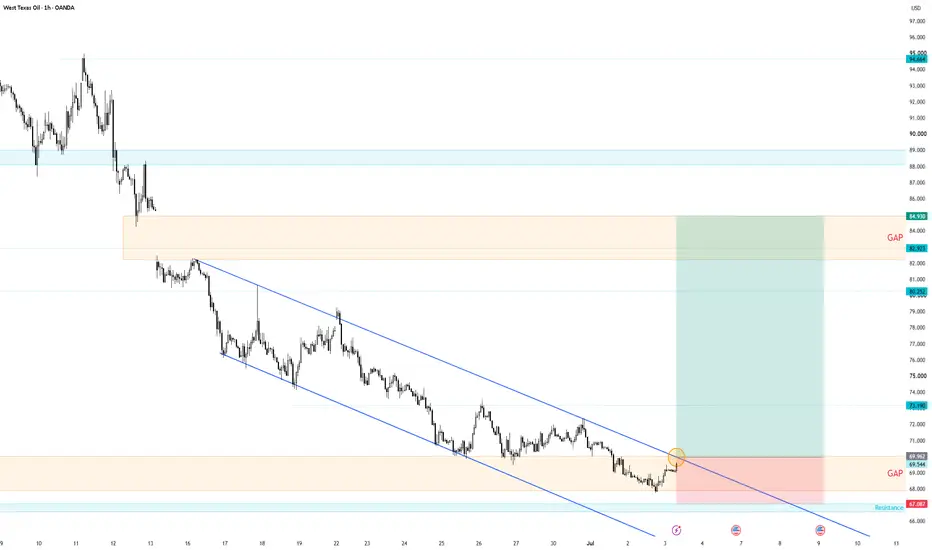
WTICOUSD 1H: Channel Breakout & Massive GAP Fill (Long Setup)1. Market Context
On the 1H chart, Oil has officially broken above the upper boundary of the dominant descending parallel channel that has controlled the price action for weeks. This decisive breakout above the 69.494 - 69.962 zone confirms a structural shift from bearish to bullish, opening the door for an explosive run to fill the massive historical GAP zone resting between 82.923 and 84.930.
2. Sentiment & Price Trap Analysis
• The Trapped Sellers: Throughout the life of the descending chann
US30 1H: Trapping the Channel Buyers (Bearish Breakdown Setup)1. Market Context
On the 1H chart, US30 is trading within a well-defined ascending parallel channel. After a sharp rejection from the channel's upper boundary around 53,279.9, the price collapsed rapidly and is currently consolidating right above the critical ascending trendline support and local horizontal level at 52,793.7.
2. Sentiment & Price Trap Analysis
• The Retail Buyer Trap: Retail traders are aggressively opening long positions at the touch of the ascending trendline support (marked
USD/JPY(20260708)Today's AnalysisMarket News:
According to Proactive Research, traders on the forecasting platform Polymarket are generally bullish on gold continuing its rebound in July, but believe that gold prices will not return to the highs reached in January. Bets are concentrated around the month's high of $4,300 per ounce.
Technical Analysis:
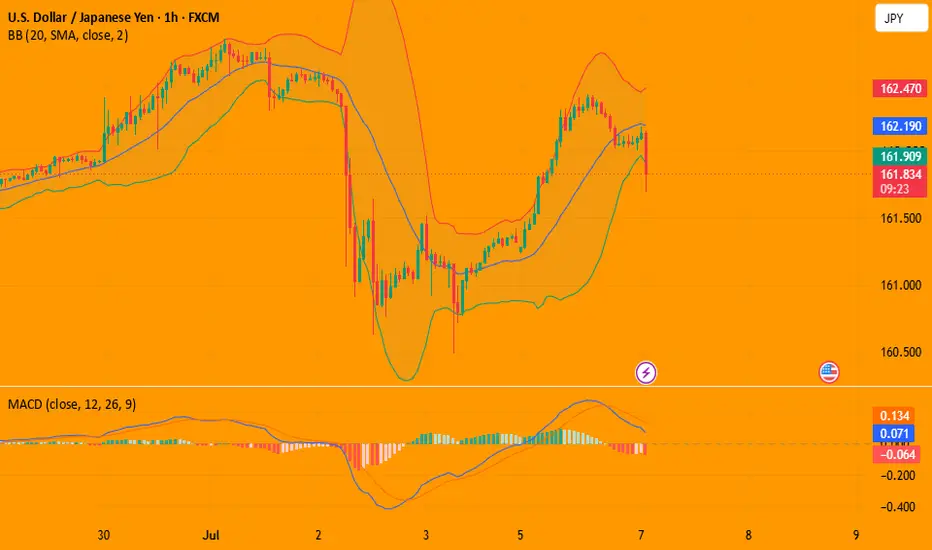
Today's Buy/Sell Threshold:
161.96
Support and Resistance Levels:
162.48
162.29
162.16
161.76
161.63
161.44
Trading Strategy:
A break above 162.29 suggests a buy ent
USD/JPY(20260707)Today's AnalysisMarket News:
Saudi Arabia has initiated a price war in the Asian market. With the Strait of Hormuz reopening and global oil supply continuing to increase, Saudi Aramco on Monday lowered its official selling price (OSP) for its flagship crude oil sold to Asia in August by the largest margin in at least 26 years, in an effort to attract Asian buyers.
According to price lists obtained by foreign media, Saudi Aramco lowered its OSP for August Arab Light crude oil by $11 per barrel, representing a
GBPUSD 15M: Trapping the Channel Buyers (Short Setup)
1. Market Context
On the 15M chart , GBPUSD has been trading within a well-defined ascending parallel channel. After failing to sustain its position near the upper boundary around 1.32731, the price formed a local consolidation box and is now executing a sharp breakdown below both the consolidation support and the channel's middle line.
2. Sentiment & Price Trap Analysis
• The Retail Buyer Trap: Inside the local consolidation box (between 1.32400 and 1.32700), retail traders aggressively ope
USD/JPY(20260701)Today's AnalysisMarket News:
Federal Reserve's Hamak: Inflation remains too high, and a rate hike may need to be considered; interest rate futures show the probability of a Fed rate hike in September has risen to 80%.
Technical Analysis:
Today's Buy/Sell Threshold:
162.35
Support and Resistance Levels:
163.16
162.86
162.66
162.03
161.83
161.53
Trading Strategy:
If the price breaks above 162.66, consider buying, with a first target price of 162.86.
If the price breaks below 162.35, consider selling, with
USD/JPY(20260630)Today's AnalysisMarket News:
Sources familiar with the matter revealed that Warsh will release the full details of the working group in the coming weeks, with all research work expected to conclude by the end of this year. After the report is completed, Federal Open Market Committee (FOMC) members will evaluate each reform proposal and determine its implementation path. Each working group leader is an external professional personally selected by Warsh, with support from key Fed staff.
Technical Analysis:
T
USD/JPY(20260629)Today's AnalysisMarket News:
Bank of America predicts the Federal Reserve will raise interest rates three times this year. Danske Bank believes the Fed will raise rates at least twice more, and US interest rates still have room to rise further. Goldman Sachs believes Warsh's hawkish stance will exacerbate volatility in short-term US Treasuries. UBS states the market overestimates the risk of rate hikes and expects rates to remain unchanged in 2026 and easing to resume in early 2027.
Technical Analysis:
Tod
BTC 1H: Trapping Trendline Sellers & Liquidity Hunt1. Market Context
On the 1H chart of image, Bitcoin has successfully performed a liquidity sweep at the 58,288 support level. The "No Buyer" signals at the lows confirm that the selling pressure has been absorbed, and the market is currently testing the major descending trendline.
2. Sentiment & Price Trap Analysis
• The Trendline Seller Trap: Retail traders are actively shorting at the descending trendline (marked "Seller"), expecting the downtrend to continue. They are building a massive pool
XAUUSD 1H: Trapping Trendline Sellers & Buyer Exhaustion1. Market Context
On the 1H chart of image, Gold is struggling under the major descending trendline. The price is currently oscillating within a small consolidation zone below the trendline, failing to sustain any significant bullish momentum.
2. Sentiment & Price Trap Analysis
• The Trendline Seller Trap: Retail traders are aggressively selling at the descending trendline (marked "Seller"), building a wall of buy-stop liquidity just above the trendline.
• The "A Few Buyer" Trap: Retail trader
USDCAD 1H: Trapping the Consolidation Buyers1. Market Context
On the 1H chart, USDCAD is currently stuck in a tight consolidation range after failing to break above the major resistance level. The price is testing the lower support of this range, where retail traders are actively looking to buy the dip.
2. Sentiment & Price Trap Analysis
• The Retail Buyer Trap: The "Buyer" label at the support level indicates that retail traders are aggressively going long, expecting the range to hold. This has created a massive pool of sell-stop liquid
XAUUSD - LONGPrice is now establishing itself above the POC level, which shifts the short-term structure to bullish. The descending triangle that formed over the past few sessions looks to have trapped aggressive shorts, as price failed to break lower. With sellers exhausted, the path of least resistance is to the upside, and I expect a test of the next POC level in the coming sessions.
XAUUSD - LONG
ENTRY PRICE - 4013.000
SL - 3943.000
TP - 4315.000
Always follow the 6 Golden Rules of Money Management:
USD/JPY(20260626)Today's AnalysisMarket News:
Data released on Thursday showed signs of a recovery in U.S. consumer demand amid rising inflationary pressures.
Data released by the U.S. Bureau of Economic Analysis (BEA) in June showed that inflation-adjusted consumer spending rose 0.3% month-over-month in May 2026, reversing the stagnation in April and indicating that household spending remains resilient.
The Federal Reserve kept interest rates unchanged at 3.50%-3.75% last week, but updated quarterly projections show that p
USD/JPY(20260624)Today's AnalysisMarket News:
Deutsche Bank research analyst Michael Hsueh stated in a report that "the Fed's repricing, coupled with strong US macroeconomic data, is the main reason for the decline in gold prices." The bank has lowered its third-quarter gold price forecast to $4,300 per ounce, a reduction of more than one-fifth from its previous forecast, and adjusted its forecast for the last three months of the year to $4,800 per ounce.
Similar adjustments were made by Goldman Sachs. Last week, the institu
WuBlockchain Highlights Bitcoin Mining StrugglesWuBlockchain reports that Bitcoin has traded below its estimated production cost for five consecutive months, according to JPMorgan. This situation has left approximately 20% of Bitcoin miners unprofitable, raising concerns about the sustainability of mining operations in the current economic climate. The full details can be found in the original tweet from WuBlockchain.
Market Snapshot
The current state of Bitcoin mining reflects a significant downturn in profitability. Amid a wave of selling
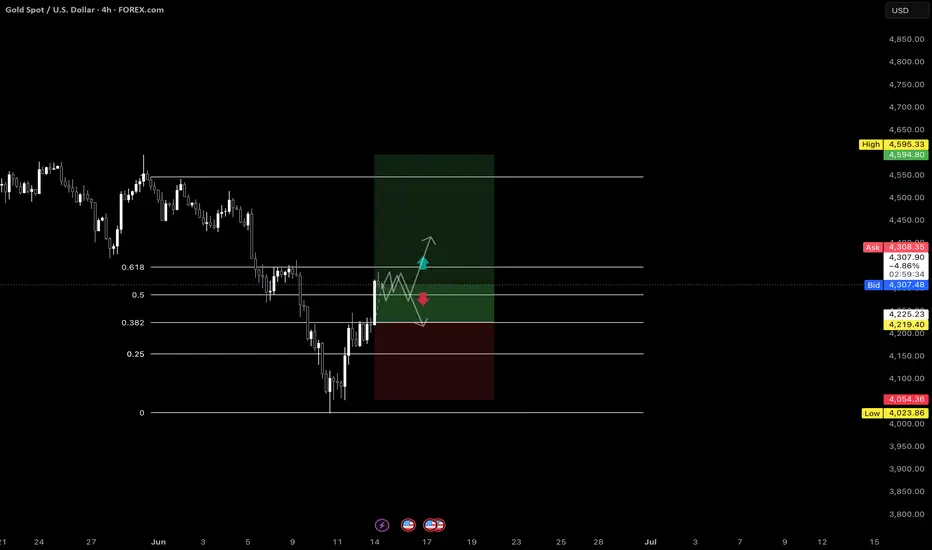
XAUUSD 4H: Bullish Structure With Event Risk AheadBias: Bullish
Gold remains structurally bullish on the 4-hour timeframe as price continues to respect the overall higher high and higher low sequence.
I am currently monitoring a potential continuation setup after price retraces into the Fibonacci value area between the 50%-61.8% levels.
From a fundamental perspective, easing geopolitical tensions may reduce some safe-haven demand, but the overall market remains highly sensitive to upcoming US macroeconomic events.
Key events to monitor:
*
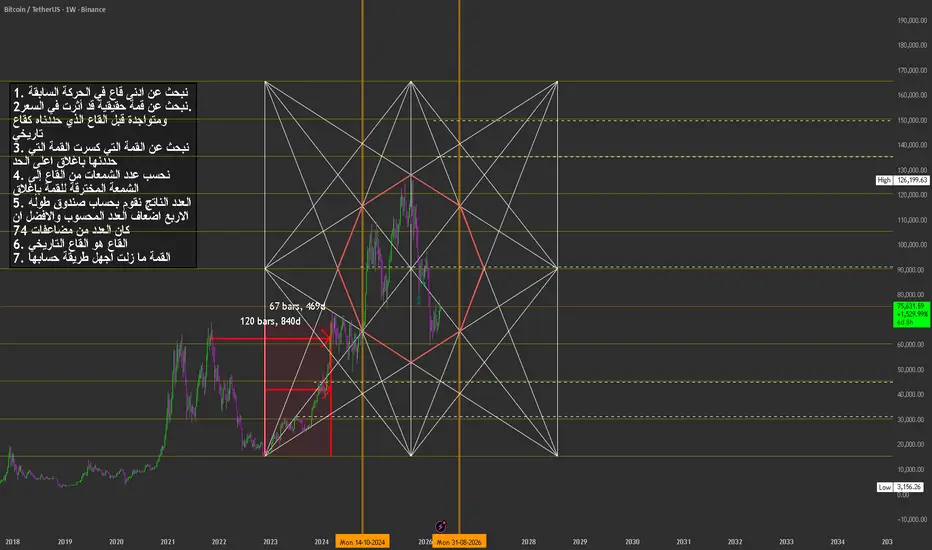
Gann StarBased on the current data, Bitcoin could still continue dropping along the nearby trendline. If it breaks above that trendline, it would suggest that the price is holding its level defensively until a stronger upside breakout before September.
The most likely scenario is either a direct breakout—like previous breakouts—or a delayed breakout, which could lead to an even more exaggerated surge on a later day.
And Allah knows best.
According to my algorithm-based analysis, Bitcoin appears to be
Continuation SELL entry on NZDUSD This is a new entry for a sell continuation on FOREXCOM:NZDUSD
Here is the previous early entry from last week, currently running at +2R.
Price has confirmed a bearish bias on the daily timeframe. I expect the price to dig into this H4 imbalance, which is also an order block on the higher time frame.
#NZDUSD
SELL setup
1:5 RR
Expectation, 1-2 weeks.
Manage risk, and let's get it.