Bitcoin Bull Market RestartingMy updated primary count:
- RSI peaks ideally in wave 3's (orange circles)
- 200 weekly MA provides major cycle support + pitchfork level holding, which it appears to be respecting nicely
- Comparing altcoin charts, the vast majority topped in January 2025, supporting the idea that we've been in a corrective structure for a year now.
- Leads to question of what is more probable?
Bitcoin was the only crypto to be in a bull?
or
Bitcoin was also in a bear market?
Pitchforks
Anglo American Monthly ViewAnglo American is in pursuit of a yearly low, first we look for a swing low, then a close above the 10 period moving average. At a minimum the yearly low will see price breach the upper resistance of the Pitchfork. In terms of time, we are within a time after a long cycle from the COVID lows.
The Future of the Crypto Ecosystem: Will Bitcoin Rise Again?Following Trump’s directive to support digital currencies, Bitcoin surged from around $69,000 to a peak price around $126,000.
But after a period of major turbulence, Bitcoin began to lose value. Based on monthly Ichimoku timeframe analysis and Andrews’ Pitchfork , our models suggest Bitcoin could fall back to around $70,000 in the coming period.
We expect this downward trend to continue until early 2027.
The big question is: what happens after that? Will Bitcoin re-value and recover, or will it get stuck around these low levels, potentially threatening thousands of smaller altcoins?
$BTCUSDBITSTAMP:BTCUSD monthly: BTC has been battling this support/resistance line for 11 months. The current consolidation is localized within the upper band of the pitchfork.
I don't believe the cycle has topped -- during the last cycle, prices moved down 40% in a little over 3 weeks after topping. Each retrace up only did 38.2%. Now prices have moved down only about 16% in 4-5 weeks and retraces went to 61.8%. It just does not feel like a drop from the cycle top as in the past.
I added to my long position today expecting at least one more wave up.
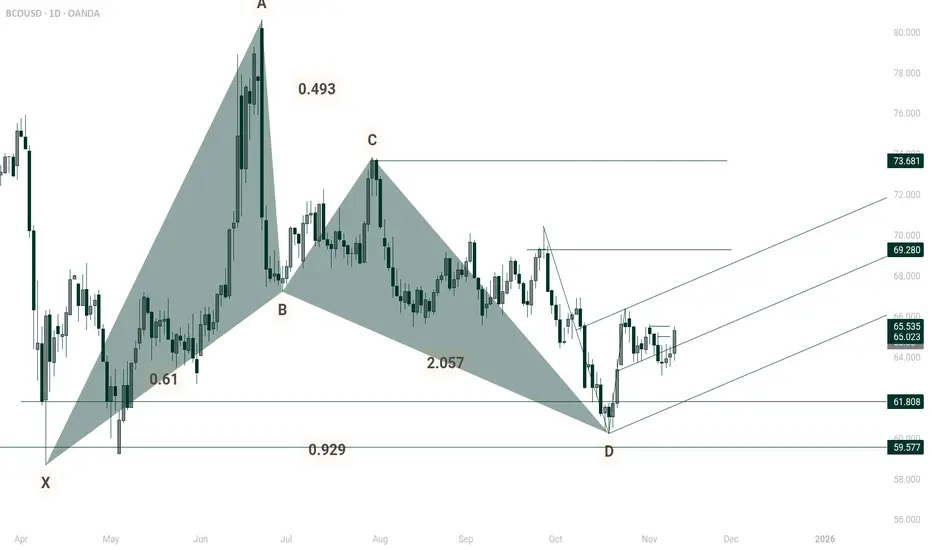
HBR massive shark pattern.This one shows a shark harmonic with schiff pitchfork. The fact this has been in consolidation/PRZ since 2020 means 1 of 2 things.
1. Bearish, the pattern has failed.
2. Bullish, this going to explode so fast and hard.
The fact Brent oil is threatening to clear its main resistance leads me to the latter.
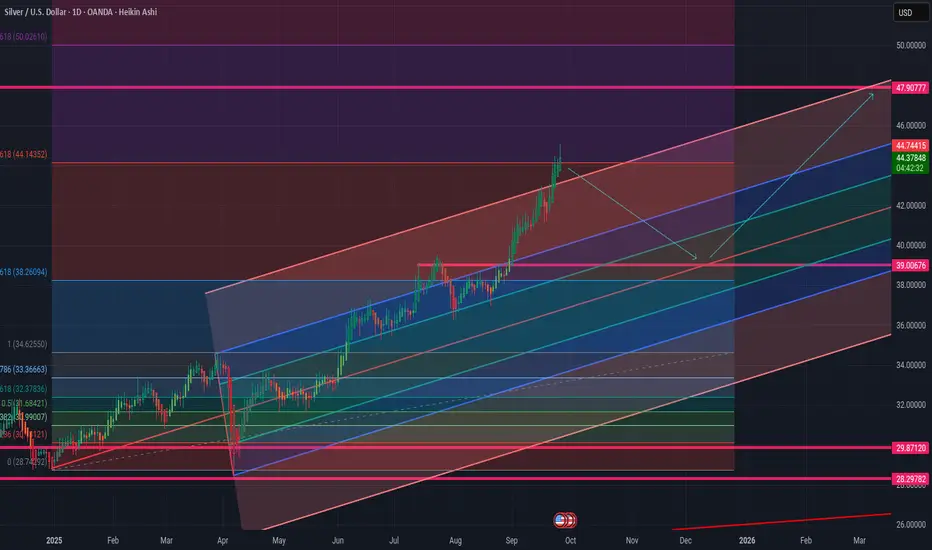
Hitting Fibonacci resistance on the XAGUSD chartAs can be seen in the chart; Fibonacci and Andrews fork are plotted in the same area. After many reactions to the fork ranges, the price has broken out of the fork and hit the Fibonacci resistance. It is likely that the price will return to the fork with this hit and will reject the next price resistances with the help of the fork channels.