EURUSD: Bullish Structure Eyes 1.1700 Liquidity🔹 EURUSD remains in a broader bullish market structure, with price respecting a rising trendline and holding above the marked support zone near 1.1580–1.1600. Recent price action shows consolidation after the earlier advance, while the upper liquidity area around 1.1700 remains a key resistance reference. The repeated reactions around support suggest that buyers are still defending the current structure, although momentum has become more balanced in the short term.
🔸 If the EURUSD support zone continues to hold, price could gradually retest the nearby resistance and potentially challenge the liquidity area around 1.1700 if a bullish breakout is confirmed. Traders may wait for clear price confirmation before considering any trade. A decisive break below the rising structure and support could weaken the bullish market structure and expose lower levels for further technical analysis. This EURUSD price action remains focused on the interaction between support, resistance, liquidity, and potential breakout conditions.
This analysis is for educational purposes only and does not constitute financial or investment advice. Always conduct your own research before making trading decisions.
Technical Analysis
XAGUSD: A Bigger Move May Be Taking ShapeXAGUSD is entering a potentially important bullish phase as a weaker U.S. dollar and renewed demand for precious metals provide support for silver. Geopolitical uncertainty is also helping sentiment toward metals, while stronger Chinese trade data adds another positive factor for silver’s industrial demand outlook. The main risk remains a hawkish Fed, which could keep volatility elevated.
On the H1 chart, XAGUSD is showing a constructive bullish structur e, with price holding above the Ichimoku Cloud and continuing to defend the broader support area around 65.0–65.3 . Buyers remain active on weakness, while the current structure keeps pressure focused on the 67.4–67.8 resistance zone .
In the short term, I expect silver to continue pushing toward 67.4–67.8 . A clean breakout and sustained move above this area could open the way toward 68.57 . As long as the 65.0–65.3 support zone remains intact , pullbacks should be viewed more as opportunities for buyers to re-enter rather than signs that the bullish structure has failed.
EURUSD: Momentum Shifts to BuyersEURUSD is currently leaning bullish in the short term, supported by an improving technical structure and a macro backdrop that is beginning to favor the euro.
From a fundamental perspective, the U.S. dollar is under pressure as markets remain cautious ahead of U.S. inflation data, while expectations for a hawkish ECB continue to support the euro. This divergence in policy expectations could help EURUSD maintain its short-term strength.
Technically, EURUSD has broken above the descending trendline and is now trading above the Ichimoku Cloud. The 1.1604–1.1610 area remains a key support zone, while 1.1637 is the nearest resistance that needs to be cleared to confirm stronger bullish momentum.
If price holds above support and breaks firmly above 1.1637, I expect EURUSD to extend toward 1.1653–1.1660. A break below 1.1604, however, would weaken the current bullish outlook.
Bias: Bullish | Support: 1.1604–1.1610 | Target: 1.1653–1.1660
Buyers have the advantage, but 1.1637 is the real test. Can EURUSD break through and open the door to 1.1660?
$SPY & $SPX — Levels for Tuesday, September 8, 2026🔮 AMEX:SPY & SPCFD:SPX — Levels for Tuesday, September 8, 2026
📊 Key U.S. Economic Data (ET)
No high- or medium-impact USD economic events scheduled.
⚠️ For informational purposes only. Not financial advice.
📌 #SPY #SPX #StockMarket #TechnicalAnalysis #Trading
XAUUSD — Daily Market StructureGold is currently trading around 4,406 after a recent bullish recovery from the 3,985–4,065 area.
The higher-timeframe structure shows an important reaction zone above current price:
D1 Bearish Order Block: approximately 4,550–4,630
Current price: around 4,406
D1 Fair Value Gap: approximately 4,140–4,220
Recent structure: bullish recovery from the lower demand area
Price may continue to seek liquidity toward the D1 bearish order block. However, the reaction around 4,550–4,630 will be important to evaluate whether buyers can maintain momentum or sellers regain control.
A deeper retracement into the D1 FVG around 4,140–4,220 could also provide an area to watch for a potential reaction, depending on lower-timeframe confirmation.
Key focus:
Watch how price behaves at the marked D1 OB and D1 FVG rather than assuming a predetermined move. Confirmation from market structure and price action can help define the next high-probability scenario.
Educational market analysis only. Not financial advice. Markets involve risk.
AUDJPY - Buyers Approaching Key Support!AUDJPY continues to respect the established support and resistance areas. After recently rejecting the resistance area and trading lower, price is now moving toward the blue support zone, where another potential reaction could develop.
⭕As price approaches the blue support zone, we can start looking for buy setups on lower timeframes, anticipating a bullish reaction and a move back toward the resistance area.
⭕On the other hand, if price breaks below the blue support area, it would signal that sellers are gaining control and could lead to further downside.
The reaction from this support should give us a clearer picture of whether buyers can regain control or if sellers are ready to take the price lower.
⚠️ Disclaimer: This analysis reflects my personal market view and is not financial advice.
Rayan Nasser
#AUDJPY #Forex #ForexTrading #TechnicalAnalysis #PriceAction #Trading
USD/JPY: a long into the FOMC window (demand zone)USD/JPY has dropped from 164 and is sitting in a demand zone that has been tested before and held. My reference points:
Entry: the blue zone at ~153.46
Stop: below the zone at ~151.64
First target: 155.29 (1R)
Second target: 157.11 (2R)
The trigger for this one is the calendar, not (only) the chart. This is a setup for the Pre-FOMC window on Wednesday, not a standing trade. If the move plays out into that event, fine, if not, the idea is discarded when the window closes.
Why long USD/JPY specifically: the setup is essentially a short-JPY read through the dollar side. The macro score is currently -4, which reads mildly negative against risk — but the trade is only open for the event window, and that gauge can flip around the meeting. I am not trading a macro call; I am trading a strong technical pattern into a scheduled catalyst, with the position only valid for that window.
The zone is pre-tested and holding. Structure first, event second, guard rails around it.
Educational content only. Not investment advice.
Zcash Breaks Above 2018 Highs, Eyes 1600–2500We have talked extensively with our members about the bullish outlook for Zcash (ZECUSD) over the past year, repeatedly highlighting the potential for a move back toward the 2018 highs and the $1,000 area. We shared it back on June 16 here on TradingView.
As anticipated, Zcash has now broken above its 2018 highs and pushed into the $1,000 region. The key question now is: how much upside remains? From an Elliott Wave perspective, ZECUSD is extending higher within a projected wave 5 of (3) on the weekly chart. As long as the bullish structure remains intact, there could be further upside toward the $1,600–$2,500 target area before the next higher-degree wave (4) correction takes place.
GBPAUD: short setup from support at 1.87512OANDA:GBPAUD
Current facts on the chart:
trend alignment
prolonged base (consolidation)
price compression (squeeze)
close retest
at-level close
Expected conditions:
volatility contraction on approach
Do you see this setup differently? Let me know your thoughts in the comments.
If this logic aligns with your trading plan, support the idea with a boost!
Disclaimer: This publication is part of my public trading journal. The material is strictly for educational purposes, reflects my market perspective, and is not financial advice.
Trading facts, not expectations.
EURAUD: short setup from support at 1.61116OANDA:EURAUD
Current facts on the chart:
prolonged base (consolidation)
price compression (squeeze)
at-level close
extreme bar close
Expected conditions:
volatility contraction on approach
Objective risks:
distant retest
Do you see this setup differently? Let me know your thoughts in the comments.
If this logic aligns with your trading plan, support the idea with a boost!
Disclaimer: This publication is part of my public trading journal. The material is strictly for educational purposes, reflects my market perspective, and is not financial advice.
Trading facts, not expectations.
Silver (XAGUSD) at a Critical Decision Zone | Breakout Above 76.Silver is currently trading around 65.56 on the daily chart and is approaching an important resistance area. The overall structure shows a recovery from the 55–58 major demand zone, followed by the formation of higher lows and rising dynamic support.
The chart highlights two possible scenarios:
🟢 Bullish Scenario
Silver needs to maintain the current support structure and successfully break the 76.86 breakout level.
A confirmed daily breakout above 76.86 could open the path toward:
🎯 72.00–73.00: Near-term key target / reaction area
🎯 76.86: Major breakout confirmation
🎯 83.74: Key resistance
🎯 88.00–89.38: Major resistance zone
🎯 91.00–92.00: Higher resistance / strong supply area
A sustained move above the descending dynamic resistance trendline would further strengthen the bullish structure.
🔴 Bearish / Rejection Scenario
If price fails to break the resistance structure and sellers become active, Silver could experience a pullback toward the current support.
Important downside areas marked on the chart are:
66.32–62.79: Important support/reaction zone
60.00: Structural support
56.00–58.00: Major demand zone
A break below the rising dynamic support would weaken the current bullish setup and could increase the probability of a deeper correction.
🧠 Technical Reasons
Major demand reaction: Price previously reacted strongly from the 55–58 area.
Higher-low structure: Recent price action is developing above the major demand zone.
Dynamic support: The rising trendline is currently supporting the recovery.
Resistance overhead: Price is still below important resistance and must prove strength with a breakout.
Liquidity/market structure: A clean break and daily close above 76.86 would provide stronger confirmation than simply touching the level.
Risk management: Avoid chasing price directly into resistance. Wait for confirmation/retest where possible.
📈 Key Takeaway
Silver is at a critical decision point. The bullish setup remains valid while price respects the rising dynamic support and the 62.79–66.32 support region. A confirmed breakout above 76.86 could significantly strengthen the upside setup toward 83.74 and 89.38+.
This is technical analysis, not financial advice. Always manage risk and position size appropriately
CHF/JPY BULLS ARE STRONG HERE|LONG
Hello, Friends!
We are now examining the CHF/JPY pair and we can see that the pair is going down locally while also being in a downtrend on the 1W TF. But there is also a powerful signal from the BB lower band being nearby indicating that the pair is oversold so we can go long from the support line below and a target at 193.909 level.
Disclosure: I am part of Trade Nation's Influencer program and receive a monthly fee for using their TradingView charts in my analysis.
✅LIKE AND COMMENT MY IDEAS✅
GOLD LONG FROM SUPPORT
GOLD SIGNAL
Trade Direction: long
Entry Level: 4,388.35
Target Level: 3,454.98
Stop Loss: 4,343.92
RISK PROFILE
Risk level: medium
Suggested risk: 1%
Timeframe: 1h
Disclosure: I am part of Trade Nation's Influencer program and receive a monthly fee for using their TradingView charts in my analysis.
✅LIKE AND COMMENT MY IDEAS✅
Liquidity Sweep Before Recovery
Fundamental Analysis
Gold remains under pressure after strong U.S. jobs data increased expectations for a September Fed rate hike. Rising oil prices and Middle East tensions may still provide some safe-haven support. Markets now turn to PPI on September 10 and CPI on September 11 for the next inflation signals.
Technical Analysis
On H4, Gold remains in a broader bearish correction after the recent BOS and strong decline from the 4,600 area.
Price is now near 4,389, with the main downside liquidity sitting around 4,275–4,305. A sweep into this support could complete the current bearish wave and create room for a recovery.
The first upside resistance is the 4,490–4,575 FVG, followed by the stronger 4,590–4,615 OB + POC.
Important Key Levels
4,665–4,695 — BSL / Major Resistance
4,590–4,615 — OB + POC
4,490–4,575 — FVG
4,275–4,305 — Liquidity / Main Support
Trading Scenario
Buy priority comes after a sweep into 4,275–4,305 followed by clear H4 bullish confirmation.
Target: 4,490–4,575 first, then 4,590–4,615.
Invalidation: H4 acceptance below 4,275.
Overall View
The H4 structure remains corrective, so I would not chase buys at the current price. A deeper move into liquidity could offer a cleaner area for the next recovery wave.
Will Gold sweep 4,300 before starting the rebound?
EURUSD is Nearing a Strong Resistance!Hey Traders, in the coming week we are monitoring EURUSD for a selling opportunity around 1.16300 zone, EURUSD is trading in a downtrend and currently is in a correction phase in which it is approaching the trend at 1.16300 support and resistance area.
Trade safe, Joe.
XAUUSD Short: Breakdown from Ascending Channel Signals DownsideHello traders! Here’s my technical outlook based on the current XAUUSD (2H) chart structure. XAUUSD previously traded inside a descending channel before breaking higher and forming an ascending channel. Price then moved toward the 4,520 Supply Zone, where sellers rejected the upside.
Currently, XAUUSD is trading below 4,520 while holding above the 4,390 Demand Zone. The rejection from the Supply Zone and descending structure suggest further downside.
As long as XAUUSD remains below 4,520 and respects the descending structure, the bearish scenario remains valid. A continuation lower could push price toward the 4,390 Demand Zone (TP1). However, a breakout and close above 4,520 would weaken the bearish outlook and increase the possibility of further upside. Manage your risk!
BTCUSDT: 78,000 Support Retest Could Fuel Another RallyHello everyone, here is my breakdown of the current BTCUSDT setup.
Market Analysis
BTCUSDT previously traded inside a downward channel before breaking above the structure and shifting bullish. Price then formed a range before breaking higher and developing an upward channel toward the 81,100 Resistance Zone.
Currently, BTCUSDT is trading below the 81,100 Resistance Zone while holding above the 78,000 Support Zone and respecting the upward channel. The recent test of the upper channel suggests a possible pullback toward support before another move higher.
My Scenario & Strategy
As long as BTCUSDT remains above the 78,000 Support Zone and respects the upward channel, the bullish scenario remains valid. A successful retest of support could push price back toward the 81,100 Resistance Zone (TP1).
However, a breakdown and close below 78,000 would weaken the bullish outlook and increase the risk of further downside.
That’s the setup I’m tracking. Thank you for your attention, and always manage your risk.
BTCUSD Bearish Setup — Rejection From Major Supply ZoneBitcoin (BTCUSD) is currently trading around $79,430 on the 1D timeframe. The chart shows a strong reaction from the lower demand area, followed by a move into a major supply/resistance zone around $82,000–$84,000.
The current structure suggests that BTC is facing selling pressure near the upper supply zone, making a bearish continuation scenario possible if buyers fail to reclaim the resistance area.
🔴 Key Resistance / Supply
$82,000–$84,000: Major supply and selling-pressure zone.
A clear rejection from this region could confirm that sellers are defending the highs.
A strong daily close above $84K would weaken the bearish setup and could open the door toward higher resistance.
🟡 Key Reaction Level
Around $76,000 is an important reaction level.
If BTC loses this level with strong momentum, it could indicate that the recent bullish recovery is weakening and sellers are gaining control.
🔵 Key Support Areas
$72,000: First important support.
$68,000–$69,000: Intermediate demand area.
$64,000: Main projected bearish target shown on the chart.
$61,000–$62,000: Additional support zone.
$58,384: Major strong-low area.
🎯 Bearish Scenario
The chart's projected path suggests:
$82K–$84K rejection → $76K reaction level → $72K support → $68K–$69K → $64K target
The $64K region is particularly important because it aligns with the marked expected target and a previous demand/liquidity area.
⚠️ What Would Invalidate the Bearish Idea?
If BTC breaks above the $82K–$84K supply zone and establishes a strong daily close above it, the bearish setup becomes weaker. Traders should then reassess the structure rather than blindly holding a short bias.
🧠 Trading Logic
The main reason for the bearish outlook is the combination of:
Rejection from a major supply zone
Visible selling pressure near recent highs
Resistance around $82K–$84K
Important reaction level near $76K
Multiple lower support/liquidity zones
Projected move toward the $64K area
Risk management is essential. This is a technical analysis scenario, not a guaranteed prediction. Wait for confirmation around the marked levels before taking any trade
Euro Trend Line Rejection Signals Possible Move to 1.1560Hello traders! Here’s my technical outlook based on the current EURUSD (2H) chart structure. EURUSD previously traded inside a descending channel before breaking above resistance and shifting bullish. Price then formed a range and rallied toward the 1.1620 Seller Zone, where it faced rejection from the descending Trend Line. Currently, EURUSD is trading below the 1.1620 Seller Zone while holding above the 1.1560 Buyer Zone and Support Level. The recent rejection and the descending Trend Line suggest that a short-term bearish continuation may develop toward support. As long as EURUSD remains below the 1.1620 Seller Zone and respects the descending Trend Line, the bearish scenario remains valid. A rejection from current levels could push price toward the 1.1560 Buyer Zone (TP1). However, a breakout and close above 1.1620 would weaken the bearish outlook and increase the possibility of further upside. Please share this idea with your friends and click "Boost" 🚀
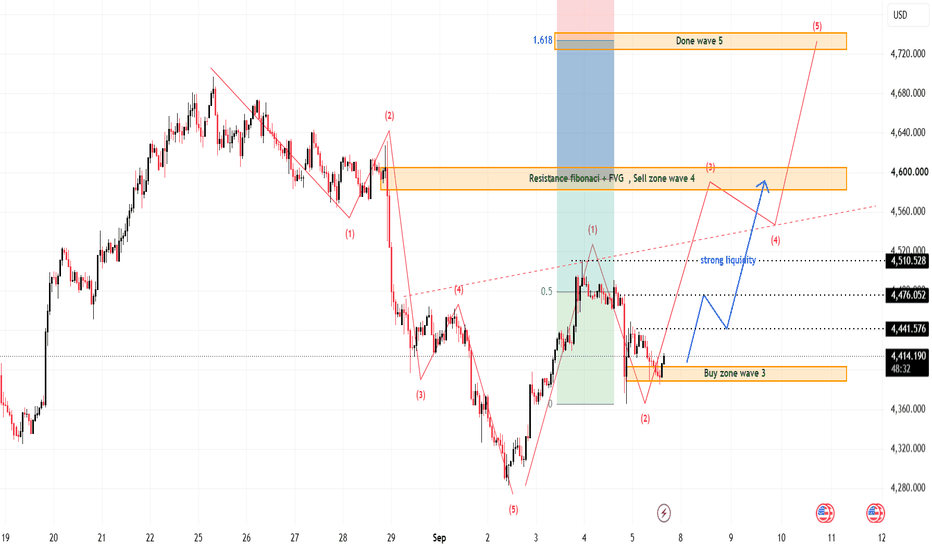
XAUUSD — Bullish Wave 3 From Buy ZoneXAUUSD — Bullish Wave 3 From Buy Zone
Gold is building a bullish recovery structure after completing the previous bearish wave near the lower area. From Kelly’s view, the current chart suggests that XAUUSD may be preparing for a new upside continuation while price is holding around the Buy zone wave 3.
The key idea is simple: gold may be forming wave (2) correction now, and if buyers defend the current buy zone, wave (3) can start pushing toward the upper liquidity levels.
⟡ Market Structure
Gold reacted strongly from the previous low near 4,280–4,300, showing that sellers lost momentum and buyers started to rebuild structure.
Price is now trading around 4,411, right above the Buy zone wave 3 near 4,390–4,410. This zone is important because it may act as the base for the next bullish impulse.
If this support holds, gold may continue higher toward 4,441, 4,476, and the strong liquidity zone near 4,510. A clean break above 4,510 would strengthen the bullish continuation toward the Resistance Fibonacci + FVG / Sell zone wave 4 around 4,585–4,605.
➤ Key Levels
◌ Current price area: 4,411
◌ Buy zone wave 3: 4,390–4,410
◌ First liquidity: 4,441
◌ Second liquidity: 4,476
◌ Strong liquidity: 4,510
◌ Resistance Fibonacci + FVG: 4,585–4,605
◌ Final wave 5 target: 4,725–4,740
◌ Bullish invalidation: below 4,360
⌁ Elliott Wave View
The chart shows a possible bullish Elliott Wave recovery.
Wave (1) formed after gold bounced from the lower demand area.
Wave (2) is now correcting back into the 4,390–4,410 buy zone.
If this zone holds, wave (3) may push price toward 4,510 and then 4,585–4,605.
After that, wave (4) may create a short pullback.
The final wave (5) target remains near 4,725–4,740.
This is why Kelly is not chasing buys too late. The cleaner plan is to wait for confirmation around the buy zone, then follow the bullish structure step by step.
▸ Trading Scenario
Preferred bullish scenario
Entry: Buy around 4,390–4,410 if price gives bullish confirmation from the Buy zone wave 3
Stop Loss: Below 4,360
Take Profit 1: 4,441
Take Profit 2: 4,476–4,510
Take Profit 3: 4,585–4,605
Take Profit 4: 4,725–4,740
Alternative entry
If gold breaks above 4,510 and retests this level as support, buyers may look for continuation toward 4,585–4,605.
◌ Invalidation
The bullish view becomes weaker if gold breaks below 4,360 and fails to reclaim the buy zone. In that case, wave (2) may extend lower and the bullish setup needs more confirmation.
⌁ Kelly’s View
Kelly’s main view remains bullish while gold holds above 4,390–4,410. The market is showing a recovery structure, and the current pullback may be only a correction before wave (3) continues higher.
If buyers defend the buy zone, gold may continue toward 4,441, 4,510, then the larger upside zone around 4,585–4,605. The bigger Elliott target remains near 4,725–4,740.
Do you think gold will start wave (3) from this buy zone, or retest lower before the next rally?
GBP/NZD BEARS WILL DOMINATE THE MARKET|SHORT
Hello, Friends!
The BB upper band is nearby so GBP-NZD is in the overbought territory. Thus, despite the uptrend on the 1W timeframe I think that we will see a bearish reaction from the resistance line above and a move down towards the target at around 2.286.
Disclosure: I am part of Trade Nation's Influencer program and receive a monthly fee for using their TradingView charts in my analysis.
✅LIKE AND COMMENT MY IDEAS✅
GBP/AUD SENDS CLEAR BULLISH SIGNALS|LONG
GBP/AUD SIGNAL
Trade Direction: long
Entry Level: 1.874
Target Level: 1.878
Stop Loss: 1.872
RISK PROFILE
Risk level: medium
Suggested risk: 1%
Timeframe: 1h
Disclosure: I am part of Trade Nation's Influencer program and receive a monthly fee for using their TradingView charts in my analysis.
✅LIKE AND COMMENT MY IDEAS✅
GRASS ForecastBINANCE:GRASSUSDT.P Trade Logic 📈
HTF structure is bullish. On the LTF, we have a healthy impulse and correction, with the final bearish leg losing momentum.
Entry: Limit order within the entry zone.
Trigger: None — limit entry.
Bullish bias with controlled risk. 🎯
I appreciate hearing your technical opinions and insights on this potential scenario.
⚠️ Risk Disclaimer
All analyses, market views, and scenarios presented on this page are provided for informational and educational purposes only and should not be considered financial advice or a recommendation to buy or sell any financial instrument.
Financial markets involve substantial risk, and none of the scenarios presented here are guaranteed to occur. Each trader is solely responsible for their own trading decisions, risk management, and any profits or losses resulting from their trades.
Please consider your own financial situation, risk tolerance, and trading strategy before making any trading decision. Do not rely solely on the information provided on this page when making investment or trading decisions.ll risk. Controlled trade. 🎯