Harvard Among Top 20 Holders of iShares Bitcoin TrustHarvard University has made a striking move in its investment strategy. The university’s endowment now holds a bigger position in Bitcoin ETFs than in any individual stock. Specifically, Harvard tripled its stake in the iShares Bitcoin Trust ( NASDAQ:IBIT ), making it the largest publicly disclosed U.S. equity holding for the endowment.Harvard University’s Bitcoin ETFs Outweigh Traditional Stocks
According to recent SEC filings, Harvard now holds approximately $442.8 million in Bitcoin ETFs. By comparison, the university’s position in Alphabet Inc. stock is around $114 million. Harvard also holds $235.1 million in SPDR Gold Trust ( AMEX:GLD ). These figures show that Bitcoin is now taking a key role in one of the world’s most prestigious endowment portfolios.
The endowment owns 6.8 million shares of NASDAQ:IBIT , which places Harvard among the top 20 largest investors in the fund. This move signals that institutional investors are increasingly willing to treat Bitcoin as a core component of diversified portfolios.
Broader Institutional Bitcoin Adoption
Harvard is not alone in this trend. Other university endowments, such as Brown and Emory, have also started adding Bitcoin-related investments to their holdings. These actions suggest that even traditionally conservative investors are becoming more comfortable with digital assets.
By expanding its Bitcoin ETF stake, Harvard is demonstrating confidence in the long-term potential of cryptocurrency. It also reflects a shift in thinking, where digital assets are viewed as part of a balanced investment strategy alongside traditional equities and commodities like gold.
Implications for Investors
This disclosure may influence other institutional and individual investors. If Harvard and similar endowments continue to increase crypto exposure, more conservative investors might feel encouraged to explore Bitcoin and related ETFs. Additionally, the move highlights how ETFs can provide a regulated, transparent way to invest in digital assets without directly holding cryptocurrencies.
Finally, Harvard’s strategy underscores the growing role of cryptocurrency in mainstream finance. Bitcoin ETFs are now not just speculative instruments but significant tools for portfolio diversification. As more institutions adopt crypto, the trend may continue to reshape investment strategies worldwide.  Short
Short
 Short
Short
BTC Reacts at $60K — Relief Rally Toward $80K Before Next Dump?Bitcoin has now re-entered the major trading range formed between February 2024 and November 2024 — a zone that has historically acted as a high-reaction area. As expected, price has once again responded strongly upon reaching this range.
Today’s price action confirms this reaction. BTC is printing a strong bullish (green) candle right around the $60,000 support, signaling active buyer defense and a short-term rebound from this key level.
However, it’s important to keep the higher-timeframe structure in mind. Despite the bounce, market structure remains bearish, and this move should be viewed as a corrective rally, not a trend reversal.
If this relief rally continues, price is likely to target the $80,000 region, a major confluence zone defined by:
A large Fair Value Gap (FVG) overhead
The 0.5 Fibonacci retracement
Prior structural resistance
This area is expected to act as strong resistance, where selling pressure could resume. A rejection from this zone would open the door for continuation of the broader bearish trend, with $55,000 remaining the key downside target.
One factor supporting the current rebound is volume behavior. Spot market buying (BTCUSDT) is significantly stronger than perpetual futures volume, suggesting that this move is driven by real demand rather than leveraged speculation. Historically, this type of imbalance often fuels temporary relief rallies, even within bearish market conditions.
Key takeaway:
➡️ Short-term bullish reaction
➡️ Medium-term corrective rally
➡️ Higher-timeframe trend still bearish Long 
 Long
Long
BTCUSD: Neckline at $74,434 Under Pressure3 Drive s target aligns with confirmed Head & Shoulders risk
BITSTAMP:BTCUSD
BITSTAMP:BTCUSD has completed the right shoulder of the Head & Shoulders structure, and price is actively pressuring the neckline at $74,434.
At the same time, the 3 Drives reversal pattern remains fully valid, with its default harmonic target at $49,577.
This is no longer a premature structure.
We now have two independent reversal patterns pointing to the same downside target zone.
Technical state:
Head & Shoulders → confirmed structure, neckline: $74,434
3 Drives → confirmed, target: $49,577
Safe Trades,
André Cardoso Short 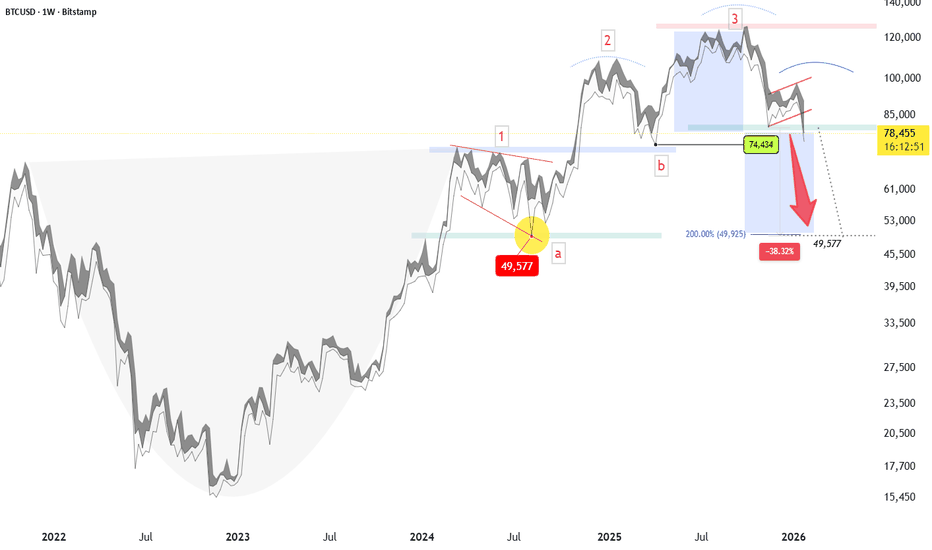
Short 
 Long
Long
 Long
Long
 Long
Long
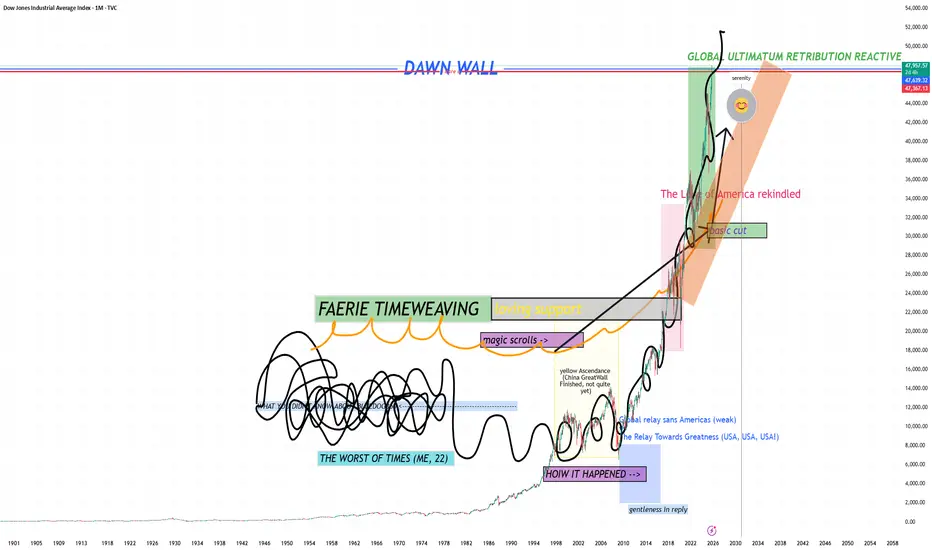
Before DOW 50K Happens (DJI long call for holders)Remember the future. Beware of the past. This time it's different. That's all.
I recommend studying Richard Wyckoff Stock Trading Technique, but not Tape Reading because that information is past its prime, in my opinion ;)
There's nothing left but upward ascent for humanity in my view. This is to do with spiritual reasons that many of us traders are privy to in our inner circles.
This chart is directed guidance towards the g20 group and the G7 group of Countries we call Home on Earth protectors.
We use capitalization as necessary to achieve the desired effect, affect, or required attribute enrichment in order to AVOID City 17, and not have to go back to the old ways of fearing totalitarian rule.
I posit that Donald Trump, The President of the United States of America, will eventually reply to my Christmas letter from 1993 and finish Home Alone 3, but I degress.
Some of us write letters. This is one such letter to the public; I used to write letters to Bill Gates on an IBM PS2, if you know your stuff.
This is my final chart, at least for a while. I always say something like that when I post a grand prediction like this one.
I bid you all well, and hope you find fruitfulness in your future life endeavors.
BLUEDOG OUT Long 
 Long
Long
 Long
Long
Long 
BTC – Retracement Likely Before Bullish Expansion | Watching 89kBitcoin remains in a strong macro uptrend, but short-term price action is showing signs of exhaustion near the 93k zone. Price rejected this level twice, forming a short-term double top and showing a loss of momentum on the lower timeframes.
On the 45m chart, BTC is slowly breaking below local support, while the 2h shows price sitting high inside a larger ascending channel. A healthy retracement looks increasingly likely before the next impulsive move.
I’m watching the 89,00 –90,000 zone closely, which lines up with:
Mid-range equilibrium
Previous consolidation
Untapped liquidity below
Local FVG imbalance
Trendline support
A sweep into this zone would create a perfect setup for buyers to step back in and continue the higher-timeframe trend.
Macro Context
December typically brings volatility in crypto. With anticipation around December rate decisions, liquidity thinning, and strong bullish positioning in BTC derivatives, a short-term correction would actually benefit the long-term trend.
As long as Bitcoin stays above 85k, the structure remains bullish and any dips are likely to be corrective.
📈 Technical Levels I'm Watching
Major Resistance:
93,200 – 93,800 (strong rejection zone)
96,000 (next major magnet if broken)
Key Support:
90,000
88,500
87,200–87,000 (main demand zone)
85,800 (larger timeframe invalidation)
Bullish Scenario:
A flush into 89k → liquidity grab → reaction → bullish continuation toward 95–96k.
Bearish Scenario (less likely unless macro shocks):
Break and close below 85,800 → deeper correction toward 83k region.
📌 My Trade Planning Outlook
Bias: Bullish on pullback
Looking for continuation long entries around 89,000–90,000, if confirmed with reaction.
Short-term targets:
• 91,500
• 93,000–93,800
Medium-term targets:
• 95,600
• 97,000
As long as BTC maintains the higher timeframe channel structure, I’ll treat dips as opportunities rather than reversals.
Trade Safe,
– JackOfAllTrades PLAN THE TRADE. TRADE THE PLAN. IT'S THIS SIMPLE !📅 Q4 | W50 | D8 | Y25 |
📊 EURGBP FRGNT FULL TRADE BREAKDOWN - TAKE PROFIT + 2%
🔍 Analysis Approach:
I’m applying Smart Money Concepts, focusing on:
Identifying Points of Interest on the Higher Time Frames (HTFs) 🕰️
Using those POIs to define a clear trading range 📐
Refining those zones on Lower Time Frames (LTFs) 🔎
Waiting for a Break of Structure (BoS) for confirmation ✅
This method allows me to stay precise, disciplined, and aligned with the market narrative, rather than chasing price.
💡 My Motto:
"Capital management, discipline, and consistency in your trading edge."
A positive risk-to-reward ratio, paired with a high win rate, is the backbone of any solid trading plan 📈🔐
⚠️ Losses?
They’re part of the mathematical game of trading 🎲
They don’t define you — they’re necessary, they happen, and we move forward 📊➡️
🙏 I appreciate you taking the time to review my Daily Forecast.
Stay sharp, stay consistent, and protect your capital
— FRNGT 🚀  Short
Short
GOLD– Bullish Continuation Expected | Watching FVG Retracement GOLD (XAUUSD) is still moving inside a clean bullish channel structure, and despite recent volatility, the trend remains firmly intact. Price is currently correcting downward and approaching a key imbalance (FVG) zone, where I expect buyers to step back in.
Even though we’ve seen a pullback from the 4,245 zone, this looks like a typical countertrend correction within bullish structure not a reversal. I’m expecting GOLD to dip slightly into the FVG layer, gather liquidity, and continue its upward movement.
📊 Macro Outlook
Mixed US macroeconomic data continues to support a bullish scenario for gold:
Weak US manufacturing PMI continues to signal economic slowdown.
Higher Fed rate-cut expectations.
Safe-haven demand remains elevated due to global uncertainty.
Rising Treasury yields temporarily capped gold, but the bullish structure remains intact.
With key US employment data and ISM services PMI coming this week, volatility might increase but overall momentum still favors the bulls.
Technical Breakdown
Here’s what I'm watching:
🔹 Bullish Channel Structure
Price continues to trade inside a well-defined ascending channel. Until the lower boundary breaks, bullish continuation is the higher-probability play.
🔹 FVG (Fair Value Gap) Rebalance
I expect a short-term dip into the 4205 – 4193 FVG zone.
This is a perfect area for bulls to reload positions.
🔹 Key Support Levels
4201 (minor reaction zone)
4193 – 4173 (major demand + FVG + channel midline)
4169 (strongest support / invalidation level)
🔹 Targets for the Upside
My bullish targets remain:
TP1 – 4,260
TP2 – 4,283
TP3 – 4,300
TP4 – 4,350
I believe GOLD can reach 4,260 fairly soon, and if momentum continues, 4,300–4,350 becomes very realistic.
My Trade Plan (Not Financial Advice)
Bias: Long
Entry:
Looking for buys inside the 4205–4193 FVG zone
or
On bullish confirmation from the channel midline
Stop-loss:
SL: 4169
or
Secondary SL: 4180
Take-profit targets:
TP1: 4260
TP2: 4283
TP3: 4300
TP4: 4350
As long as price stays above 4170 and holds the FVG, bullish continuation remains the main scenario.
Summary
Gold looks good for another bullish leg.
I expect a controlled retracement into the FVG followed by a continuation toward 4260 and above.
What's everyone's ideas??
Send them in the comments so we can chat :)
Trade safe,
– JackOfAllTrades  Long
Long