Long
Long
Neutral-atom sensorsPreliminary Information
Unlike its competitors who are purely focused on computing, Infleqtion is already a manufacturing reality that produces and delivers ready-to-use quantum hardware. The core of its production focuses on neutral-atom sensors, devices capable of operating with a precision thousands of times higher than traditional electronic sensors.
At the center of this offering is Tiqker, an optical atomic clock that Infleqtion has recently integrated into global defense systems in partnership with Safran Electronics & Defense. This device is not just a prototype, but a commercially available solution providing picosecond-level time synchronization, which is critical for 5G networks and high-frequency financial transactions.
In parallel, the production of inertial sensors and quantum gravimeters has reached a level of maturity suitable for critical missions, as demonstrated by the collaboration with NASA on the Quantum Gravity Gradiometer—a sensor designed to map the Earth's gravitational field from space. These sensors represent a concrete answer to the increasing vulnerability of GPS systems: Infleqtion’s ability to produce sensors that enable autonomous navigation in "GPS-denied" environments (such as underwater or in conflict zones) positions the company in a protected, high-margin market niche.
While the market waits for quantum computers to become practically useful, Infleqtion is already scaling the production of RF sensors and quantum receivers that drastically improve radio spectrum management and communication security, transforming atomic physics theory into a catalog of physical products—orbit-tested and already integrated into US and UK defense infrastructures.
Analysis
Driven by strong hype in the Quantum Computing sector, the price broke out of the yellow triangle this week. The current movement is heading toward a test of the $20 level, the breakout of which will likely push the price toward new highs.
Further updates to follow.
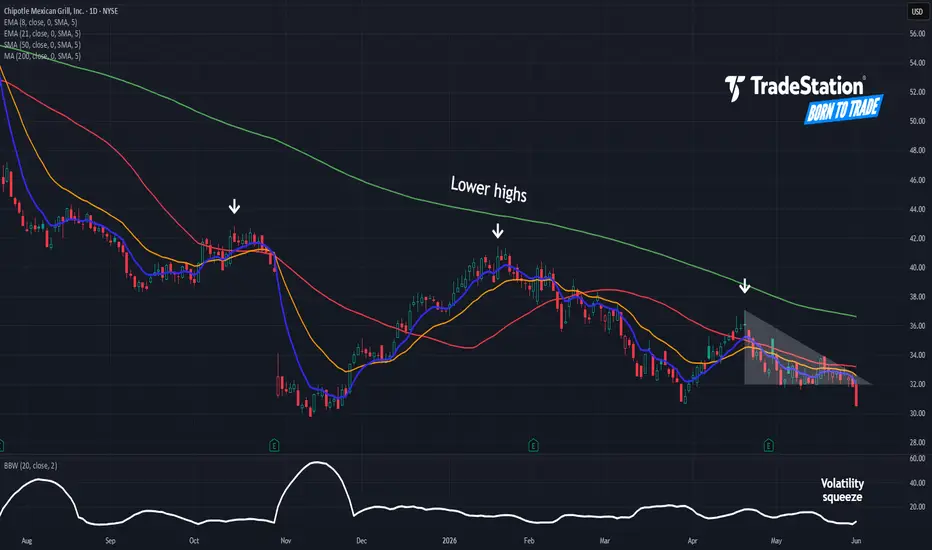
If you appreciate my insights, please leave a like! Chipotle: Triangle Breakdown?Chipotle Mexican Grill has consolidated all year. Is it ready for another push to the downside?
The first pattern on today’s chart is the series of lower highs since late April. CMG remained above roughly $32 until it fell through support yesterday. That could be viewed as a bearish triangle breakdown.
Second, the burrito chain made successively lower highs since October. Its 50-day simple moving average (SMA) has also stayed below its 200-day SMA. Those signals may be consistent with a long-term downtrend.
Third, Bollinger Bandwidth recently narrowed but is now starting to rise. That may suggest a period of price compression is ending.
Finally, the 8-day exponential moving average (EMA) is below the 21-day EMA. That may be consistent with short-term bearishness.
TradeStation has, for decades, advanced the trading industry, providing access to stocks, options and futures. If you're born to trade, we could be for you. Learn more here about TradingView’s Broker of the Year!
Past performance, whether actual or indicated by historical tests of strategies, is no guarantee of future performance or success. There is a possibility that you may sustain a loss equal to or greater than your entire investment regardless of which asset class you trade (equities, options or futures); therefore, you should not invest or risk money that you cannot afford to lose. Online trading is not suitable for all investors. View the document titled Characteristics and Risks of Standardized Options at www.TradeStation.com . Before trading any asset class, customers must read the relevant risk disclosure statements on www.TradeStation.com . System access and trade placement and execution may be delayed or fail due to market volatility and volume, quote delays, system and software errors, Internet traffic, outages and other factors.
Securities and futures trading is offered to self-directed customers by TradeStation Securities, Inc., a broker-dealer registered with the Securities and Exchange Commission and a futures commission merchant licensed with the Commodity Futures Trading Commission). TradeStation Securities is a member of the Financial Industry Regulatory Authority, the National Futures Association, and a number of exchanges.
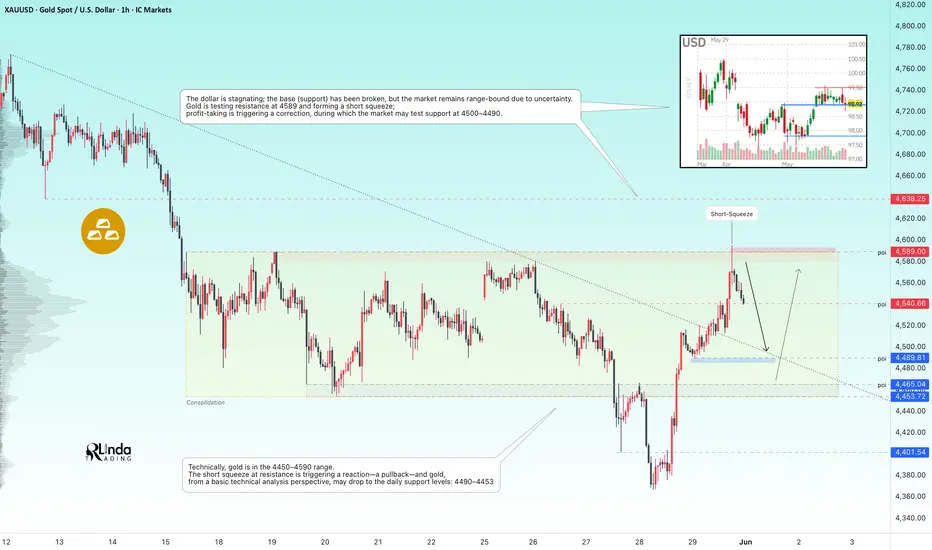
TradeStation Securities, Inc. and TradeStation Technologies, Inc. are each wholly owned subsidiaries of TradeStation Group, Inc., both operating, and providing products and services, under the TradeStation brand and trademark. When applying for, or purchasing, accounts, subscriptions, products and services, it is important that you know which company you will be dealing with. Visit www.TradeStation.com for further important information explaining what this means. GOLD - A short-squeeze triggers a correctionICMARKETS:XAUUSD volatility continues to increase due to geopolitical factors. A ceasefire framework has reportedly been agreed upon, but it has not yet been officially signed, leaving the market trapped within its current trading range
The U.S. dollar remains in stagnation. While its underlying support structure has been broken, the market continues to hold within a range due to ongoing uncertainty. Gold is also trading within a range after retesting the 4589 resistance level. A short squeeze has formed, and profit-taking is now driving a corrective move that could lead to a retest of the 4500–4490 support zone.
As of May 31, the agreement has not been officially signed. Reports suggest that the deal is still awaiting approval from Trump and Tehran, while negotiations over the final wording continue. Should the agreement be formally approved, the geopolitical risk premium is likely to decline further. However, any breakdown in negotiations could immediately revive demand for safe-haven assets and push both oil and gold higher
Resistance levels: 4589, 4638
Support levels: 4540, 4489, 4453
From a technical perspective, the market previously broke local downtrend resistance. However, after testing 4589, price formed a false breakout, triggering a corrective phase. The current move may be aimed at retesting support before another attempt higher. Nevertheless, the broader trend remains bearish.
Best regards, R. Linda  Short
Short
BITCOIN - Bearish trend. Short squeeze before the drop... BINANCE:BTCUSDT.P continues to develop a bearish trend that aligns with the broader global downtrend. Within the current distribution phase, the market has printed a new low at 72,500 and has since moved into consolidation
As of May 29, U.S. spot Bitcoin ETFs recorded their tenth consecutive day of net outflows, while large holders continue transferring BTC to exchanges. Capital managers remain net long, but positioning has been reduced from the peaks seen in April. Large speculators (hedge funds) are also maintaining a moderate net-long exposure, although there has been no meaningful increase in bullish positioning.
The market remains highly sensitive to geopolitical developments. Despite ongoing rumors of a potential agreement, volatility and uncertainty are likely to persist over the medium term.
From a D1–W1 perspective, Bitcoin reversed its local trend after a false breakout above the 80K–82K zone and is now accelerating to the downside. The market is heading toward the daily correction support area, with the primary zone of interest located at 71,500–70,500. I expect price could reach this target following a retest of the liquidity zones at 74,200, 74,750, and 75,300
Resistance levels: 74,200, 75,300, 76,000
Support levels: 72,500, 70,670
At this stage, there is no compelling case for new long positions or medium-term buying. Market structure remains weak, and any upward movement should be viewed as a potential opportunity to look for short entries.
The key area of interest, where a retest could trigger a reversal and renewed downside pressure, remains 74,200–75,300. A short squeeze could provide an attractive setup for such a move.
Best regards, R. Linda  Short
Short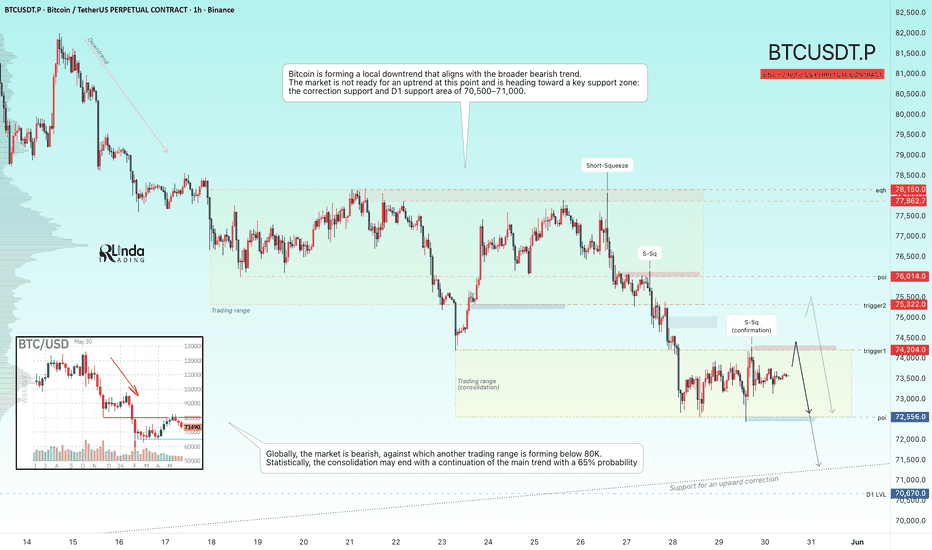
 Long
Long
 Long
Long
 Long
Long
 Long
Long
 Long
Long
PLTR Descending Triangle Failure After 5 Months of ConsolidationPLTR formed a descending triangle pattern between January and May 2026, with resistance falling from $200 down to approximately $145 and support holding firmly at $128. The standard expectation for this pattern is a bearish continuation, breaking down through the horizontal support. Last week price action delivered the opposite: a 9.21% breakout above the descending resistance line, accompanied by volume of 92.2M shares, which represents a 5-month local volume peak.
When a traditionally bearish pattern fails and breaks in the opposite direction, the resulting move tends to be stronger than a standard breakout. Short positions accumulated during the 5 months of consolidation, anticipating the textbook bearish resolution, become forced buyers when the breakout occurs upward. This short-covering pressure compounds the initial momentum.
One timing consideration is worth noting before assuming the standard measured move target. The breakout occurred at approximately 83% of the way through the triangle, measured from the widest point of the pattern to the apex. The optimal breakout zone for triangle continuation patterns falls between 50% and 75% of the pattern's duration. Breakouts in the 75-90% zone remain valid but carry statistically reduced reliability compared to earlier-stage breakouts. Two factors partially compensate for this late timing here: the breakout day volume sits significantly above the multi-month average, and pre-market action shows continuation with an additional 1.8% above the prior close. These factors keep the setup tradeable, but the measured move target should be regarded as a possibility rather than a high-probability outcome.
Volume profile throughout the formation aligns with the pattern. Volume declined gradually from approximately 80M daily in January to 40-50M by late May, which is the typical contraction expected during a triangle consolidation. The 92.2M breakout day volume is therefore significant both in absolute terms and relative to the recent baseline.
The measured move calculation is straightforward. Triangle height at its widest point equals $200 minus $128, or $70. Applied from the breakout point of $138.99, the projected target sits at approximately $209. Intermediate resistance levels that may serve as partial profit-taking zones include $167, $182, $198, and the Jan-Feb high's.
Risk management levels. The tightest invalidation point is a daily close below $143.59, the breakout line itself. A more conservative swing stop sits below $138, which coincides with both the broken descending line and the 20-day moving average. Absolute pattern invalidation occurs on a daily close below $128, which would reactivate the bearish triangle and project a downside measured move.
Not investment advice. Personal analysis shared for educational discussion. Constructive criticism and alternative interpretations are welcomed.  Long
Long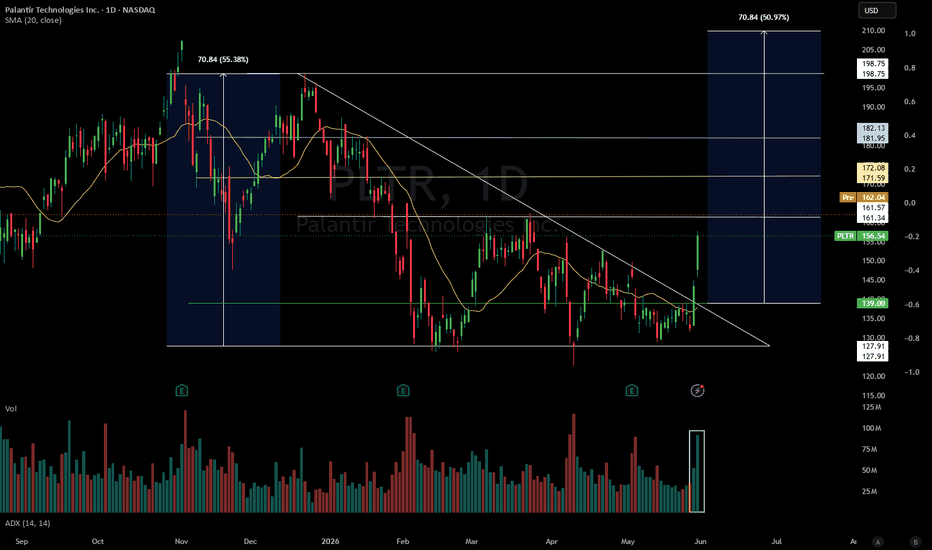
 Long
Long
 Long
Long
BTCUSDT: Could Rebound Toward 77.5K if Support HoldsHello everyone, here is my breakdown of the current BTCUSDT setup.
Market Analysis
BTCUSDT previously traded inside a strong upward channel, forming higher highs and confirming bullish momentum. After reaching the upper resistance area near 82,000, price entered a consolidation range before breaking lower through the 77,500 resistance zone, signaling a short-term bearish correction.
Currently, BTCUSDT is trading above the 75,300 support zone while remaining below the 77,500 resistance zone, which continues to act as the main supply area. Price recently rejected the triangle resistance line and is now holding near the ascending trendline support.
My Scenario & Strategy
As long as BTCUSDT remains above the 75,300 support zone and continues to respect the ascending trendline support, the bullish recovery scenario remains valid. A continuation higher could push price toward the 77,500 resistance zone (TP1).
However, if price breaks below the 75,300 support zone and loses the ascending support structure, bearish pressure could increase and lead to another downside move.
That’s the setup I’m tracking. Thank you for your attention, and always manage your risk. Long 
 Long
Long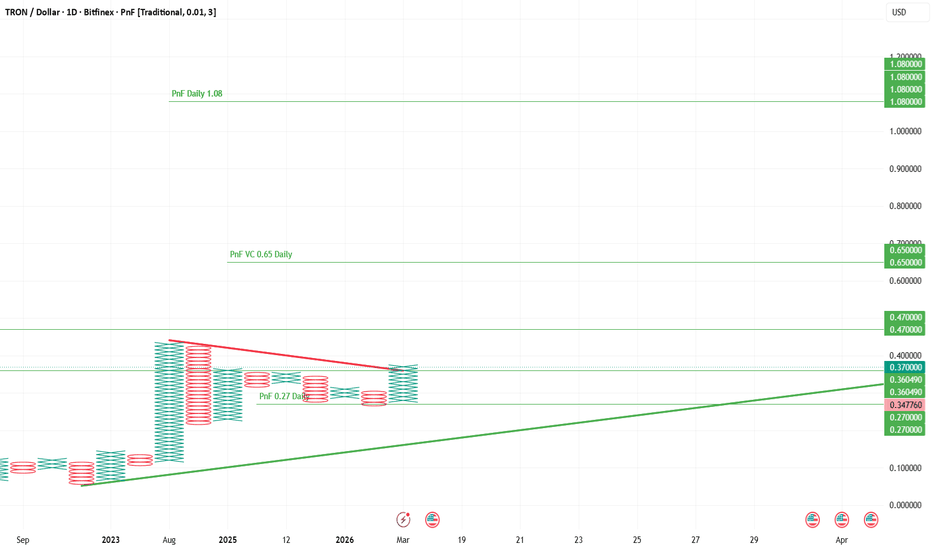
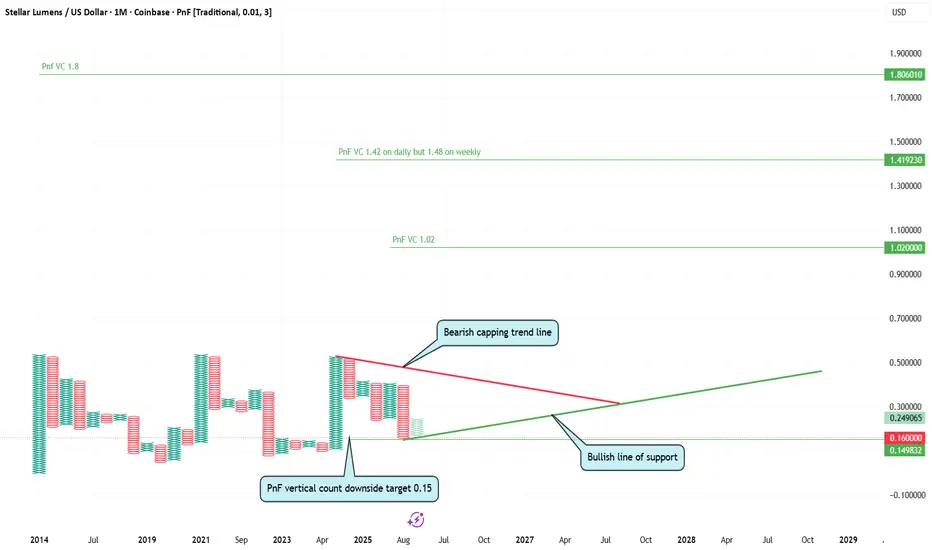
XLM PnF Point and Figure targets XLM Point & Figure Targets and Bull Market Outlook
Below are the current Point & Figure (PnF) targets for XLM.
The expectation is that price will eventually move higher and reach one of these PnF targets. For that to happen, it would likely need to coincide with the next major cryptocurrency bull market. There is also the possibility that XLM becomes one of the early leaders of the next cycle.
Traditionally, crypto markets have followed a four-year cycle, and the next strong phase should begin later this summer. However, several indicators I follow suggest that the bull market may already be underway. My working assumption is that the previous cycle was relatively muted on both the upside and downside compared with historical norms.
This may be slightly early, but the move off the lower target was very strong. Hopefully it proves to be the start of a genuine trend rather than a short-lived rally driven purely by recent news.
If trillions of dollars eventually flow into the crypto sector, some projects will experience substantial appreciation. The growth of tokenisation, where ownership can be fully verified rather than obscured through rehypothecation, could become a transformational development. What looks like a small seedling today could eventually grow into an oak tree.
Historically, both XLM and XRP have been viewed as the "bankers' coins." XRP performed strongly during the last cycle, rising approximately sixfold relatively early in the move. XLM, by comparison, has been largely dormant. This raises the possibility that XLM could be one of the remaining major cryptocurrencies yet to have its turn. Its long-term chart resembles a coiled spring or triangle formation, suggesting significant potential energy waiting to be released. That is what the charts are currently indicating.
One important point to remember is that Point & Figure analysis does not provide timing. It can indicate where price may eventually travel, but not when the move will occur.
At present, I believe XLM has bounced from the active downside PnF target around $0.15.
Point & Figure analysis identified this level very effectively.
Looking at other charting methods, my 360-degree analysis of XLM showed a break below the supporting BAGL (Basing Ascending Grind Line), which is an upward-sloping trendline. Price briefly moved below this line before quickly reclaiming it, suggesting buyers stepped in to support the market. Shortly afterwards, a positive announcement was released and the price accelerated higher.
On the ratio chart, (not shown here) I calculated a potential 100x move from this week's low. While that sounds extraordinary, it is important to understand that this is a ratio chart. It does not imply that the actual price of XLM will rise by 100x. Instead, the ratio chart is intended to help identify when it may be time to exit a long position after the next crypto bull market has run its course. In any case that chart supports this view too, but cannot easily be shown as a PnF chart.
For the bullish thesis to remain valid, price needs to stay above the green trendline.
You can also see what is effectively a triple-top formation developing. If price breaks above this level, it would trigger another Point & Figure triple-top breakout signal and generate a new upside target. If and when that occurs, I will return and update the analysis with the new target.
Good luck out there trading guys may the market carry on giving us munificent gifts
please share the knowledge and help as many people as we can!
 Long
Long