XAUUSD: Weak Structure Under Trendline, Downside Likely To 4,570Hello everyone, here is my breakdown of the current XAUUSD setup.
Market Analysis
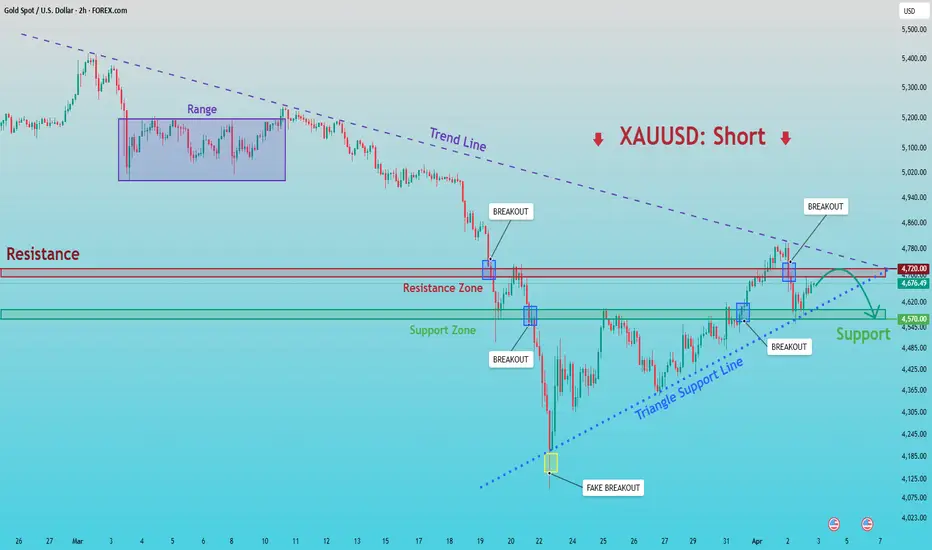
Gold is in a bearish structure under a descending trend line after breaking down from a range.
Price reacted from 4,570 support (fake breakout) and is now moving up in a short-term ascending structure.
Currently, price is approaching the 4,720 resistance zone, which aligns with the descending trend line and acts as a key supply area. The structure shows compression between rising support and overhead resistance.
My Scenario & Strategy
As long as price remains below the 4,720 resistance and respects the descending trend line, the bearish bias stays valid. A rejection from this area could push price back toward the 4,570 support (TP1) as the next downside target.
However, if price breaks and holds above 4,720, the bearish scenario would weaken and the market could shift into a broader recovery.
That’s the setup I’m tracking. Thank you for your attention, and always manage your risk.  Short
Short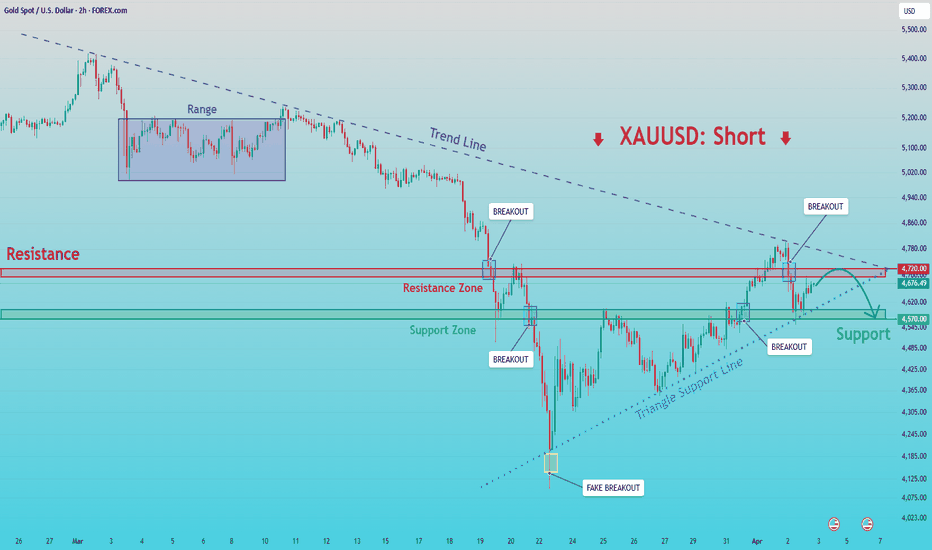
BTC Gathers Strength Below Resistance – Watch 70K LevelHello traders! Here’s my technical outlook based on the current BTCUSDT (4H) chart structure. Price moved from a range into a bullish phase, then faced rejection from a descending resistance line and entered consolidation. After finding strong support, BTC started forming higher lows along an ascending support line, signaling recovery momentum. Currently, price is holding above the 68,200 demand zone and approaching the 70,000 resistance (seller zone), while building pressure beneath it. The structure shows a potential continuation within an ascending channel. As long as BTCUSDT holds above the 68,200 support and respects the ascending support line, the bullish bias remains valid. A breakout above the 70,000 resistance could trigger continuation toward higher levels (TP1). Please share this idea with your friends and click Boost 🚀  Long
Long
XAUUSD Recovery Continues - 4,800 Break in SightHello traders! Here’s my technical outlook based on the current XAUUSD (2H) chart structure. Gold moved from a downtrend into consolidation, then found strong support and started forming higher lows along an ascending support line, signaling recovery momentum. Currently, price is holding above the 4,580 demand zone and approaching the 4,800 resistance (seller zone), while building pressure beneath it. As long as XAUUSD holds above the 4,580 support and respects the ascending support line, the bullish bias remains valid. A breakout above the 4,800 resistance could trigger continuation toward higher levels (TP1). Please share this idea with your friends and click Boost 🚀 Long 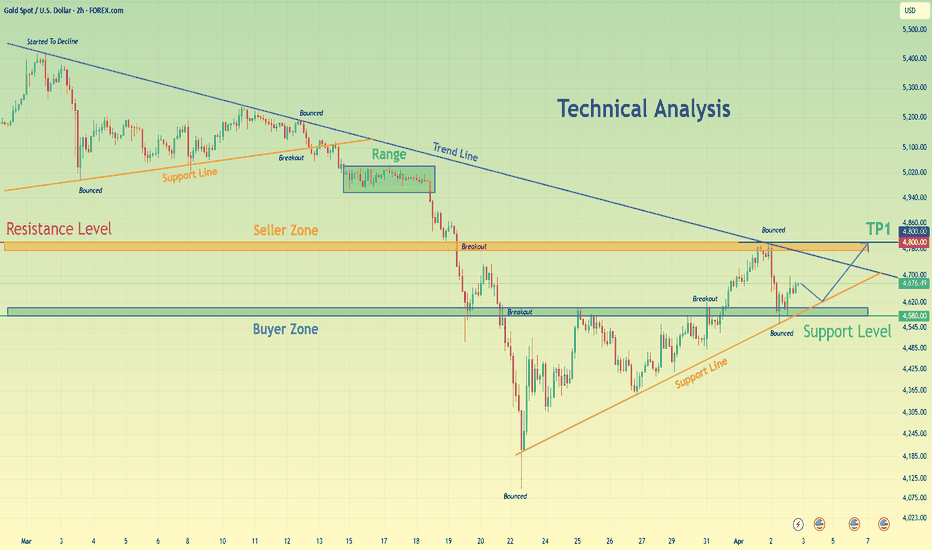
GOLD - Consolidation amid a bullish trend. Trigger at 4700 ICMARKETS:XAUUSD is consolidating above 4,600 as part of a local uptrend. The dollar is in a correction, and the market is picking up on subtle hints of potential negotiations regarding the Middle East...
There are hints of potential negotiations; Trump may withdraw his ultimatum. If this is confirmed, the market may react positively.
The dollar has been in a correction for two days, which is supporting the metal’s price. Focus on the local range of 4601–4700. Gold is retesting resistance (trigger) at 4700; the reaction is important to me. If there is no pullback and the market holds near this zone, a break above 4700 could trigger further growth toward 4800.
Resistance levels: 4700, 4793, 4800
Support levels: 4650, 4600, 4555
Further growth depends on geopolitics. A retest of 4600 before a rally cannot be ruled out, as a large liquidity pool has formed below 4600
Best Regards, R. Linda! Long 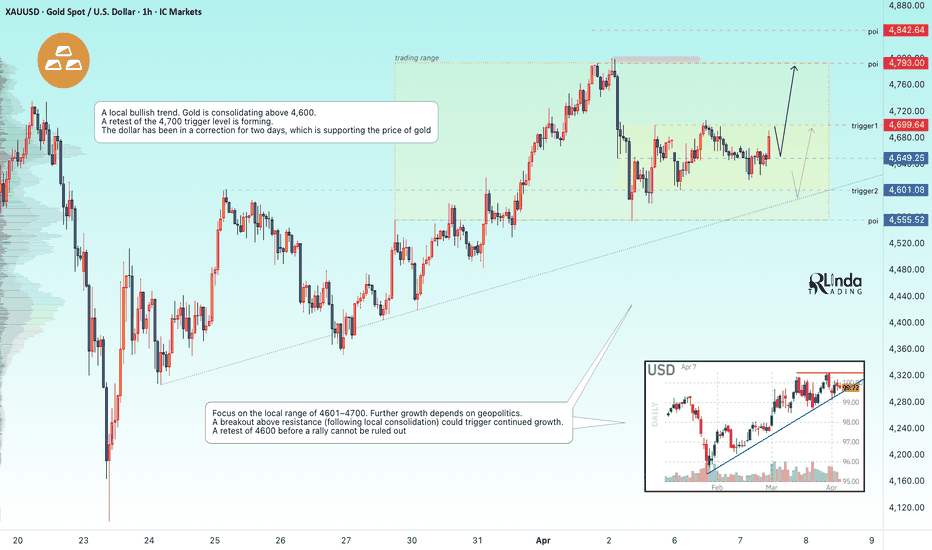
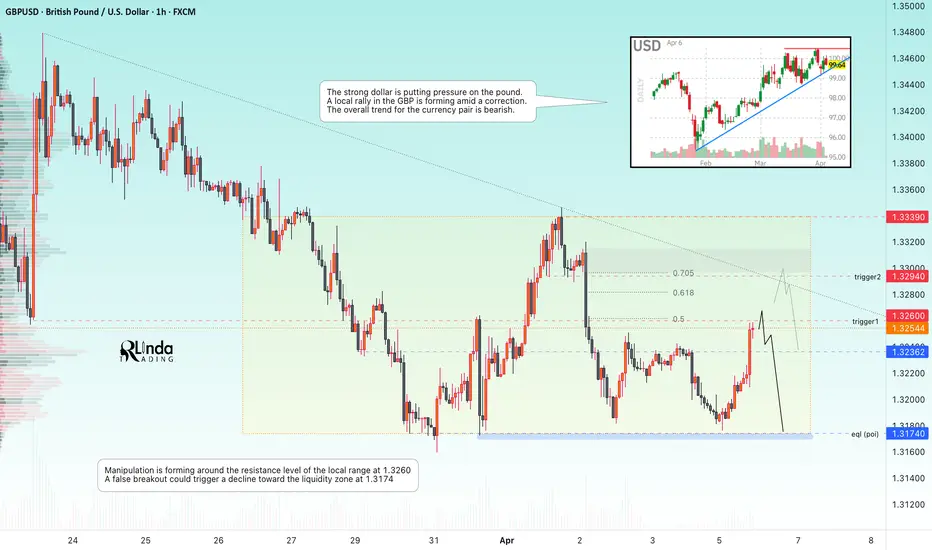
GBPUSD - The hunt for liquidity amid a downtrend FX:GBPUSD has been in a downtrend for three months. The strong dollar is putting pressure on the currency pair. The overall backdrop remains unchanged...
The dollar is forming a local correction amid a bullish trend, while the British pound is testing liquidity zones. Earlier on the daily chart, the market broke through the upward support structure, indicating weakness in the pound. The currency pair has been in a downtrend since late January, and from a technical perspective, the market is heading toward the liquidity zone of 1.3139–1.3010.
Locally, the focus is on the first trigger—resistance at 1.3260—where manipulation and the formation of a reversal pattern relative to this zone could trigger a drop toward the liquidity zone at 1.3174.
Resistance levels: 1.3260, 1.3294, 1.3339
Support levels: 1.3236, 1.3174
However, if the dollar continues its correction, the pound will head toward a further zone of interest—the second trigger at 1.3294 (an imbalance zone)—with the aim of retesting before a decline. Against the backdrop of a downtrend, I give priority to short positions...
Best regards, R. Linda! BTCUSDT: Triangle Pattern on BTC - Watching 68K ResistanceHello everyone, here is my breakdown of the current BTCUSDT setup.
Market Analysis
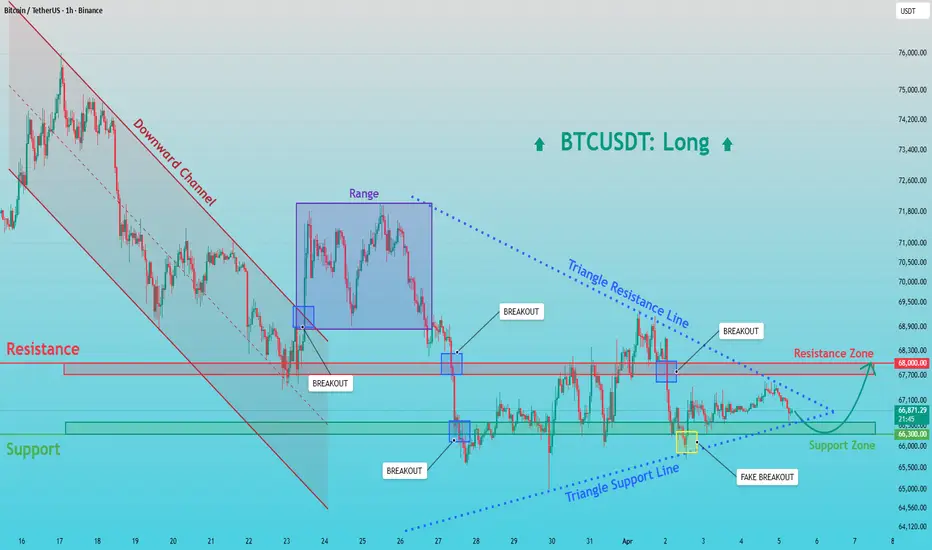
BTC previously traded inside a downward channel, confirming bearish pressure with consistent lower highs. After a breakout from the channel, price entered a range, showing consolidation and accumulation.Following this, the market formed a triangle structure, where price is compressing between a descending resistance line and a rising support line.
Currently, price is approaching the 68,000 resistance zone, while holding above the 66,300 support zone, with structure tightening.
My Scenario & Strategy
As long as BTCUSDT holds above the 66,300 support and continues respecting the triangle structure, a bullish breakout remains possible. A move above the 68,000 resistance could trigger continuation toward higher levels (TP1).
However, if price breaks below 66,300, the bullish scenario would weaken and downside pressure could return.
That’s the setup I’m tracking. Thank you for your attention, and always manage your risk. Long 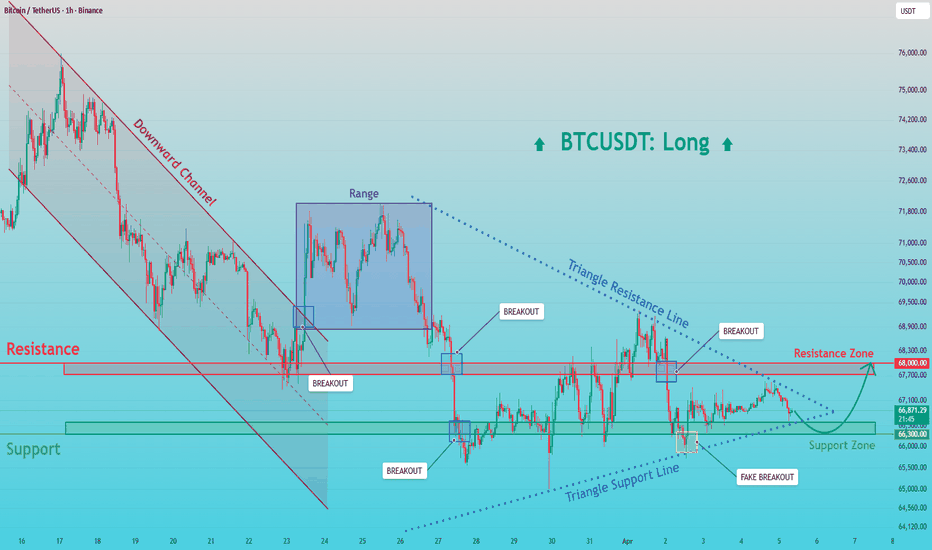
GOLD - Price within a range, retesting resistance...ICMARKETS:XAUUSD ended last week on a mixed note, with half of the sharp decline recovered. The fundamental backdrop is complex; technically, there are bearish indicators.
On Friday, NFP data (+178K instead of -133K) and unemployment figures (4.3% instead of 4.4%) were released. The dollar closed the week on a generally positive note. Oil will continue to rise. Regarding economic data, it can be said that gold is under pressure.
Geopolitics: The situation in the Middle East is not going according to Trump’s plan. The Strait of Hormuz remains closed, and oil prices are rising. There are hints of a closure of the Bab el-Mandeb Strait, which would only accelerate the rise in oil prices; this would lead to a rise in the dollar, higher inflation, and pressure on metals.
Technically, gold could bounce off the nearest resistance zone to 4580–4550, but if the market maintains its local bullish trend, the price could test the 4842 zone of interest. However...
Resistance levels: 4700, 4735, 4793
Support levels: 4580, 4555, 4479
However, the markets were closed for three days; during this time, much was said and done, which could generally impact the situation. There is a possibility of a gap opening, but we will need to monitor the Asian and European sessions.
Best regards, R. Linda!  Long
Long
BITCOIN - The hunt for liquidity ahead of a drop to 65000BINANCE:BTCUSDT.P is struggling to fulfill its role as a hedge asset. Consolidation continues amid a global bearish trend. The local market is seeking liquidity ahead of a decline.
The global structure is strongly bearish. Consolidation is forming ahead of an anticipated distribution phase. Locally, the price is forming a rebound from 66,200 within the trading range, aiming to hunt for liquidity before a decline. The market is currently not interested in the 66,200 support level; a local ascending cascade of lows is forming, and this structure could support an upward move toward zones of interest.
The liquidation on April 2 formed an imbalance zone, which Bitcoin may test before declining to 65K. Zones of interest: 67,535 – 67,884
Resistance levels: 67,500, 57,900, 68,600
Support levels: 66,200, 65,500
A short squeeze and consolidation below the key resistance zone could trigger a sell-off and a drop to 65K–64K
Best regards, R. Linda! Short 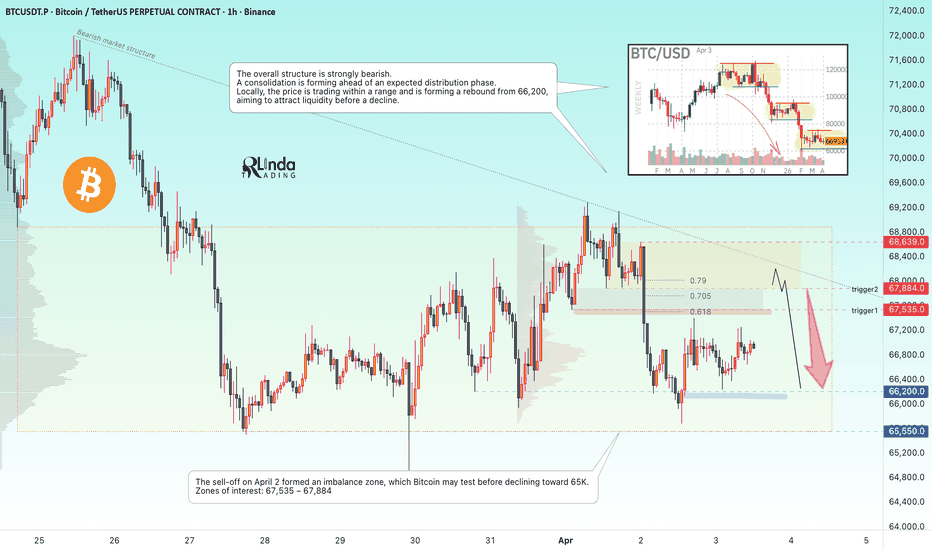
GOLD - Trend Breakdown and countertrend correction ICMARKETS:XAUUSD made a sharp reversal and pullback from its two-week high of 4,800 and shifted to heavy selling following Trump’s tough remarks on Iran. The escalation continues. The dollar and oil are rising....
Trump continues to manipulate the situation, but not very successfully. Iran has rejected a request for a ceasefire, insisting on its own plans. The UAE is lobbying for a military operation to open the Strait of Hormuz through the UN Security Council → risk of conflict escalation.
The dollar is strengthening as a global reserve currency. Expensive oil is fueling inflation expectations. The market is pricing in a Fed rate hike.
The fundamental backdrop remains bearish for gold. Any rebound will likely be used as an opportunity to sell. The market is awaiting NFP data, but the main driver remains the development of the conflict
Resistance levels: 4651, 4677, 4713
Support levels: 4553, 4529
Technically, a counter-trend correction is forming. If bears keep the price below the key resistance zone of 4677–4651, this could intensify the sell-off amid a rising dollar. Gold is under pressure. Zone of interest: 4530–4430
Best regards, R. Linda! Short 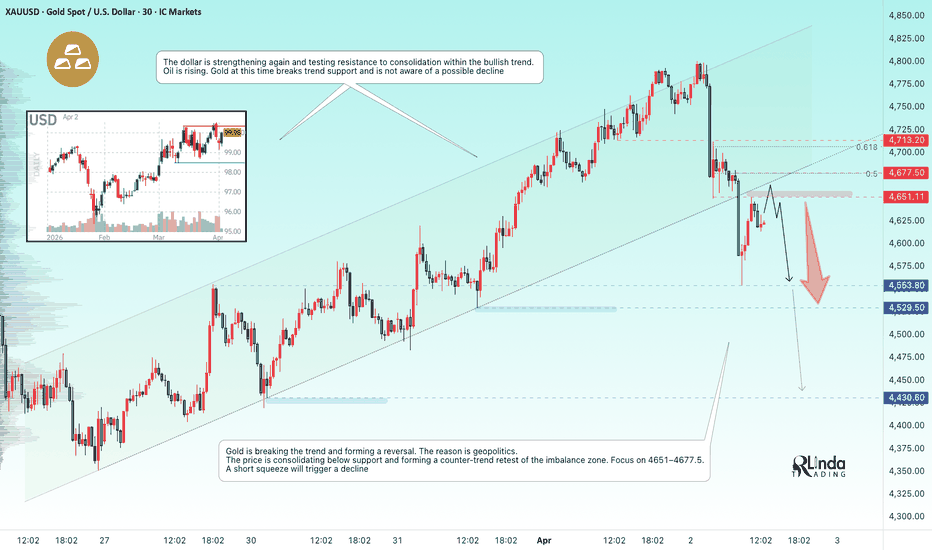
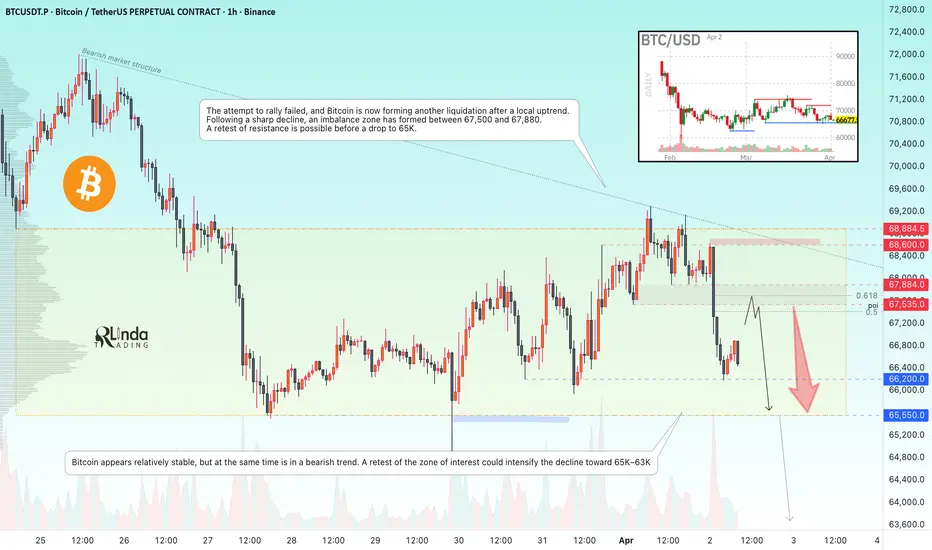
BTCUSDT - Retest resistance before a drop to 65K BINANCE:BTCUSDT is consolidating amid a global downtrend (crypto winter). At the same time, the price is holding below the upward support line, indicating market weakness...
Bitcoin looks relatively stable, but at the same time is in a bearish trend. A retest of the zone of interest could intensify the decline toward 65K–63K
The attempt at growth ended in failure, and Bitcoin is forming another liquidation after a local bullish trend. Following a sharp decline, an imbalance zone has formed at 67,500–67,880. A retest of resistance is possible before a drop to 65K.
Resistance levels: 67,545, 67,884, 68,600
Support levels: 66,200, 65,550
Technically, the price is testing the 66,200 support level and may form a correction toward the imbalance zone formed within the trading range. The 67,500–67,800 short squeeze may end with a reversal and a decline to 65K–63K
Best regards, R. Linda! Short 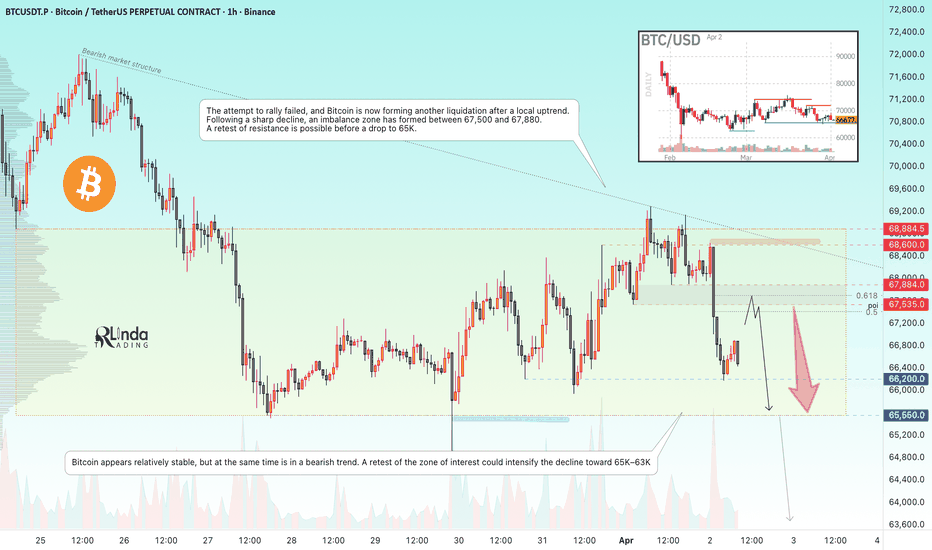
Long 
#AAVE Setting a Trap: Descending Triangle + Channel Confluence
Yello Paradisers! Are you prepared for a potential #AAVE price breakdown before the next major crypto market move unfolds?
💎#AAVE is currently forming a descending triangle pattern within a broader descending channel, which significantly increases the probability of a bearish continuation. We are likely seeing an Elliott Wave ABC or ABCDE structure developing. At this stage, we are patiently waiting for the completion of wave E, followed by a strong reversal candle with clear price action structure before considering any high-probability trade setup.
💎From a technical analysis perspective, triangles commonly form in wave 4, indicating that one more downside impulse wave is likely pending for #AAVE. This aligns perfectly with the current structure, where the entire correction is respecting the boundaries of the descending channel, adding strong confluence to our bearish outlook.
💎Moreover, the presence of hidden bearish divergence on the RSI indicator during the formation of this descending triangle further supports the likelihood of trend continuation to the downside. This is a critical signal in trading, suggesting that momentum still favors the bears and the market may not yet be ready for a bullish reversal.
💎Looking at key #AAVE price levels, the minor support is located around $92, which corresponds to the previous swing low. A confirmed breakdown below this level could accelerate selling pressure toward the major support at $72, which also aligns with the lower boundary of the descending channel and serves as a strong technical confluence zone.
💎On the upside, minor resistance is found near $126, around the high of wave C. The major resistance level sits at $150, a key flip zone where the market previously broke down, making it a critical area for potential rejection if the price revisits it.
💎Descending triangle patterns in trading are known for offering excellent risk-to-reward opportunities, but only when traded with patience, confirmation, and proper risk management. Entering trades prematurely within such structures often leads to getting caught in false breakouts or market traps.
Paradisers, that is why with a disciplined trading approach, we are waiting for confirmation at key support and resistance levels, which is essential for consistent profitability. Strive for consistency, not quick profits. Treat the market as a businessman, not as a gambler.
MyCryptoParadise
iFeel the success🌴
 Short
Short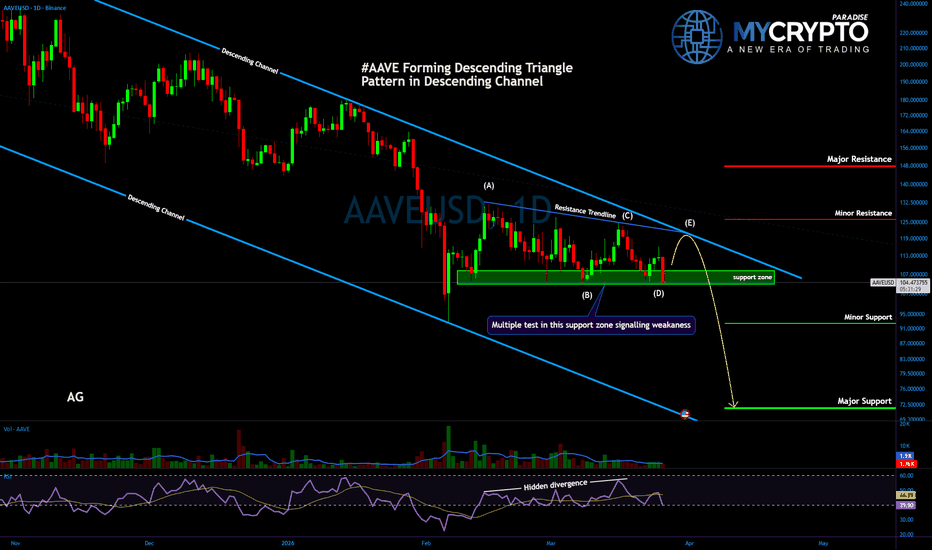
GOLD - Consolidation near the trigger. Uptrend and newsFX:XAUUSD is trading near key resistance at 4,735, finding support from a weaker dollar amid hopes for a de-escalation of the conflict in the Middle East
Key factors: Trump did not anticipate this turn of events in the Middle East, shifting responsibility for the strait to NATO countries. Earlier this week, the president stated that he was ready to end the war even without opening the strait.
A lot of economic news is expected today.
ADP Employment Change – a reading below the forecast will increase pressure on the dollar and lower expectations for a Fed rate hike.
The main event of the week: Nonfarm Payrolls (NFP) on Friday (Good Friday).
Risk appetite has reduced demand for the dollar as a safe haven, which has supported gold.
Gold is recouping its March losses amid a combination of geopolitical optimism and weak signals from the U.S. labor market. Holding above $4,700 will pave the way for further recovery
Resistance levels: 4735, 4866
Support levels: 4683, 4600
The false breakout of resistance elicited virtually no reaction (drop). Gold is consolidating near this level. If, during this consolidation, the market manages to break through 4735 and close above that level, the market will have an opportunity to rally. Otherwise, a retest of 4600 is possible amid news-driven volatility.
Best regards, R. Linda! Long 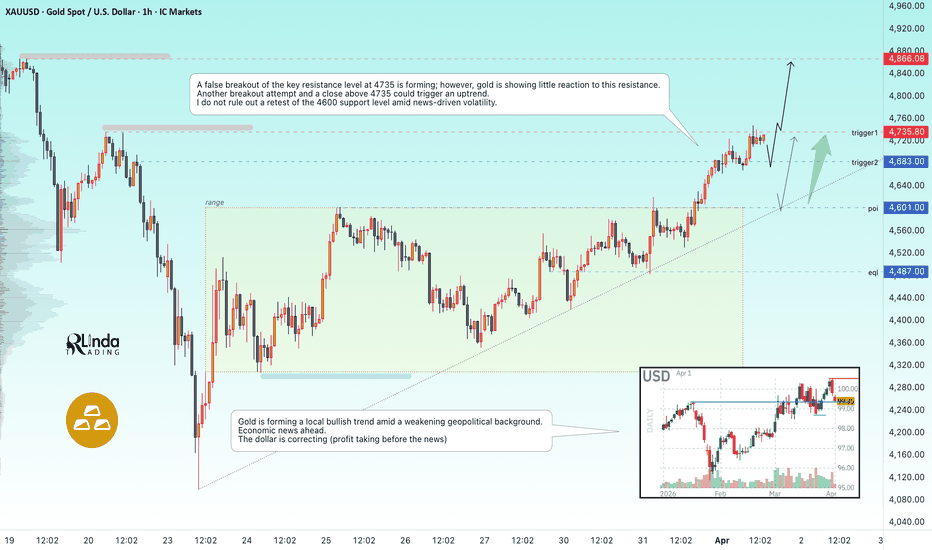
XAUUSD Long: Bounce from Demand - Bullish Scenario BuildingHello traders! Here’s my technical outlook based on the current XAUUSD (3H) chart structure. Gold broke down from an ascending channel after a rejection at the pivot point, shifting into a bearish phase. However, price found support near the 4,480 demand zone and is now forming higher lows along a rising demand line.
Currently, price is holding above the demand zone and forming higher lows along a rising demand trend line. At the same time, the market is testing a descending supply line, which acts as dynamic resistance.
As long as XAUUSD holds above 4,480 and respects the rising demand line, a bullish move is possible. A breakout above the descending supply line could push price toward the 4,700 resistance (TP1). If price breaks below 4,480, the bullish scenario weakens. Manage your risk!
Long 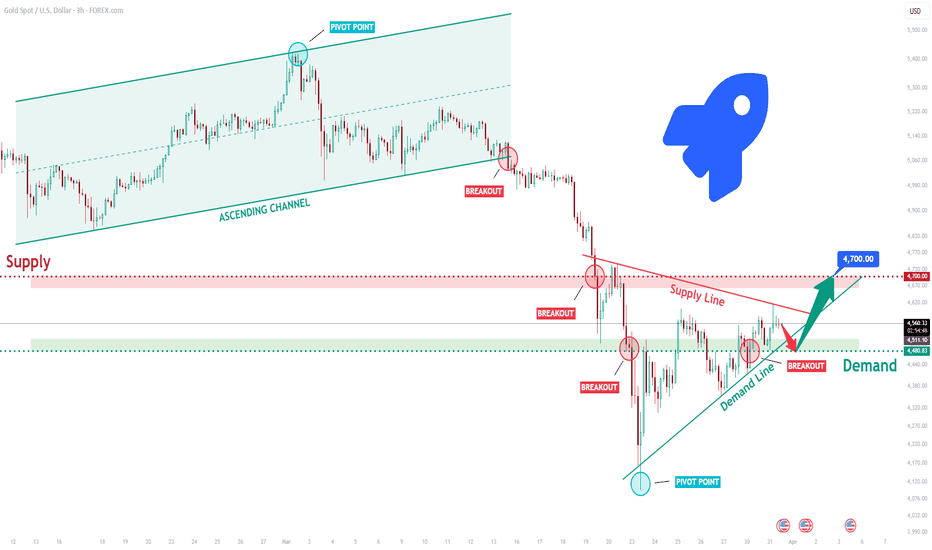
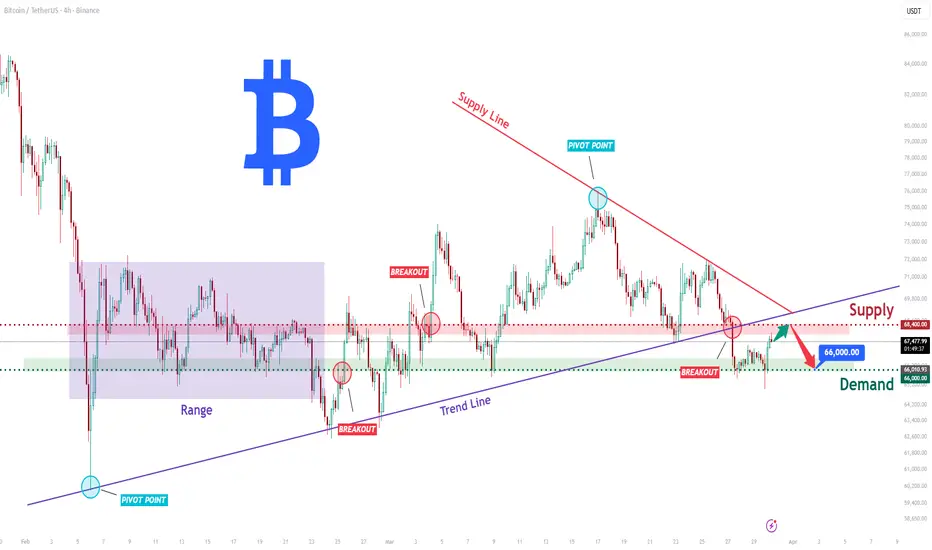
BTCUSDT Short: Weak Demand Signals Liquidity Sweep to 66KHello traders! Here’s my technical outlook based on the current BTCUSDT (4H) chart structure. BTC previously traded inside a range, after formed a rising trend line. The market faced rejection from a pivot high under a descending supply line, BTC broke below the trend line and the 68,400 supply zone.
Currently, price is trading below resistance and approaching the 66,000 demand zone, where a short-term reaction may occur. The structure now shows lower highs forming, indicating weakening bullish momentum.
As long as BTCUSDT remains below the 68,400 resistance and respects the descending supply line, the bearish bias stays valid. A continuation lower could push price toward the 66,000 support (TP1) as the next downside target. Manage your risk!
Short 
MarketBreakdown | EURUSD, GBPUSD, GBPCHF, DXY
Here are the updates & outlook for multiple instruments in my watch list.
1️⃣ #EURUSD Daily time frame 🇪🇺🇺🇸
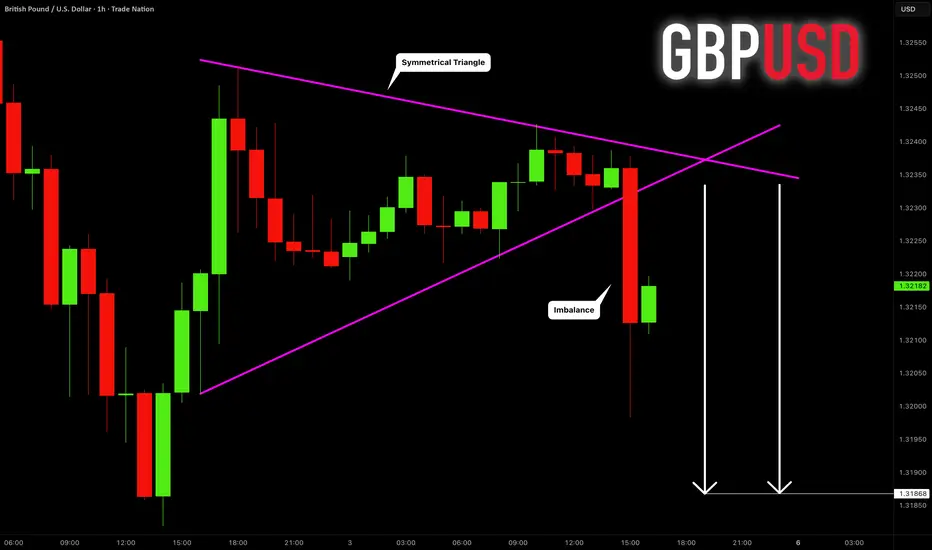
EURUSD is trading within a huge symmetrical triangle pattern.
The price is currently moving towards its resistance line.
The price will likely retrace from that.
Alternatively, its bullish breakout will trigger a further recovery,
2️⃣ #GBPUSD daily time frame 🇬🇧🇺🇸
The price is going to retest a recently broken support line
of a bearish flag pattern.
With a high probability, another bearish wave will start from there.
3️⃣ #GBPCHF daily time frame 🇬🇧🇨🇭
The price is approaching a support line of a symmetrical triangle pattern.
Its bearish breakout and a daily candle close below that will trigger a down-movement.
Alternatively, you can look for a pullback trade from that with a confirmation
on intraday time frames.
4️⃣ Dollar Index #DXY daily time frame 💵
The market is testing a solid rising trend line.
Taking into consideration that the trend is strong bullish,
chances will be high that the index will start rising soon.
Alternatively, a breakout of that trend line will push the market lower.
Do you agree with my market breakdown?
❤️Please, support my work with like, thank you!❤️
I am part of Trade Nation's Influencer program and receive a monthly fee for using their TradingView charts in my analysis.  Short
Short