W-pattern
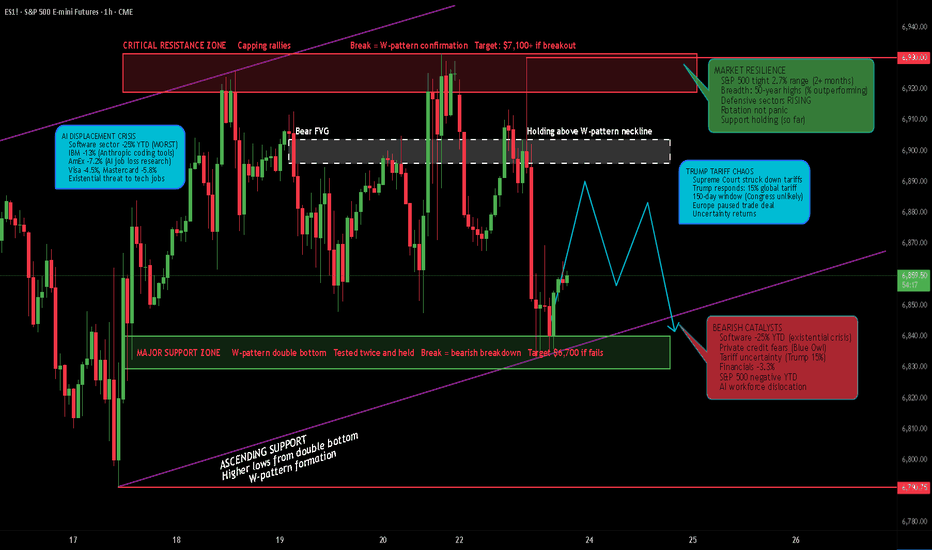
ES1! - W-Pattern Reversal at $6,850 or Breakdown? Tariffs??
What's up traders! 👋
The S&P 500 E-mini futures are at a CRITICAL decision point after Monday's brutal selloff. We've got AI displacement fears crushing software stocks, Trump raising tariffs to 15%, and private credit concerns spreading. Let me break down what's happening on the 1-hour chart and why the next move could be MASSIVE.
The Setup
ES1! is trading around $6,900 after Monday's -1.04% dump. Price is forming a potential W-pattern (double bottom) with support at $6,820-$6,850, while
Bitcoin’s Next Bear Market: Mapping the Bottom with DataWhenever Bitcoin pushes into new all-time highs, the same uncomfortable question eventually returns:
“Okay… but where could it fall to next cycle?”
No one can predict exact bottoms. Calling the absolute low is luck, not skill. However, we can look at how previous CRYPTOCAP:BTC cycles behaved to map out realistic probability zones rather than just throwing out random numbers.
If we assume a hypothetical cycle top around $125,000, here are three data-driven ways to estimate the subsequent flo
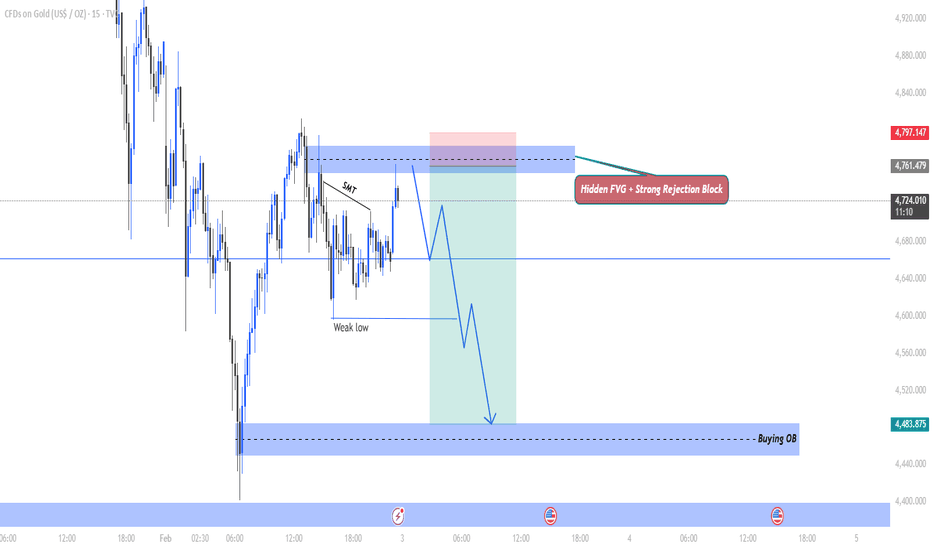
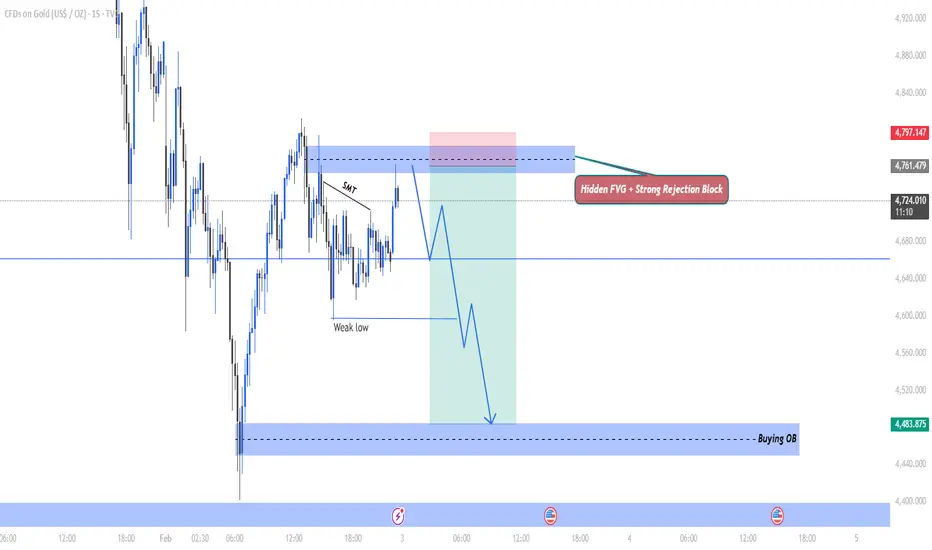
SMC Hidden FVG + Rejection Block Road MapSell Trade is ready..
Sell trade is ready according to SMC. If price reaches this sell area then we'll look for rejection candle combine with clear Mss. Let's conquer this trade with precision. This XAUUSD analysis is built on structure, liquidity and smart money logic, not on guesswork.
🧠 Final Thought
If you understand liquidity, imbalance and structure, you stop chasing price —
you start letting price come to you.
👉 Do you agree with this bearish roadmap, or do you see a different liquidity
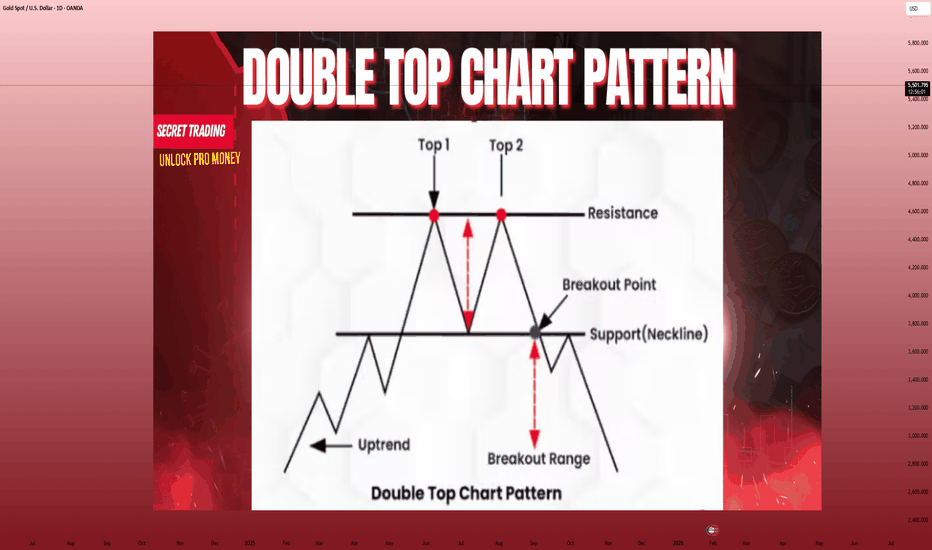
Double Top Pattern – A Classic Bearish Reversal Structure📚 Double Top Pattern – A Classic Bearish Reversal Structure
The Double Top is one of the most widely recognized and reliable bearish reversal patterns in technical analysis. It typically forms after a well-established uptrend and reflects a gradual loss of bullish momentum as market control transitions from buyers to sellers. Understanding the structure, confirmation rules, and market logic behind the Double Top helps traders avoid false signals and improve overall trade accuracy.
🔍 Structura
BTCUSD H1 – Compression Inside Range, Expansion Is ComingOn the H1 timeframe, Bitcoin is currently trapped in a well-defined sideways range after a sharp impulsive sell-off from the higher resistance area. That initial drop clearly shifted short-term momentum bearish, but instead of continuation, price has transitioned into range-bound behavior, signaling absorption and indecision between buyers and sellers. The market is now oscillating cleanly between the upper range resistance (~90,200–90,300) and the lower support zone (~87,800–88,200), with repea
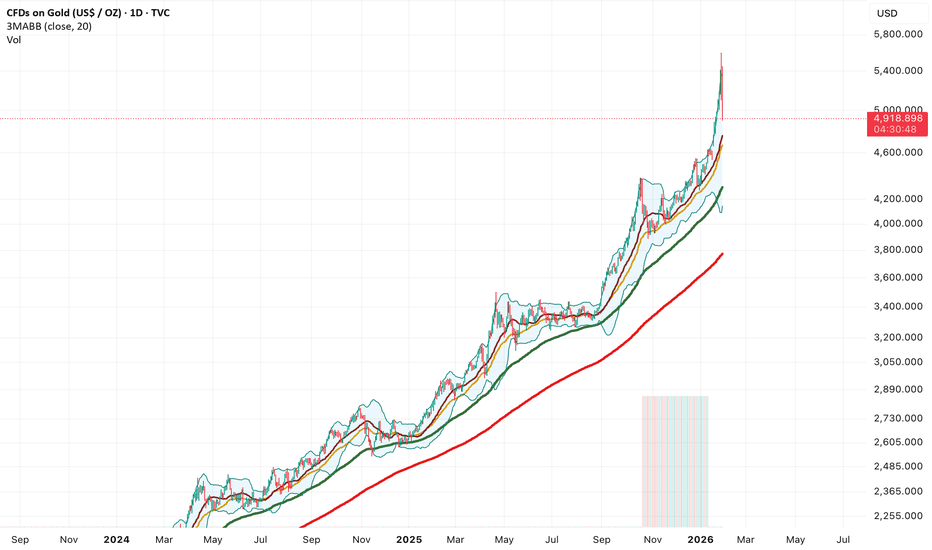
ATH Under Pressure: Continuation or Distribution?Gold is currently trading at a critical inflection point near the All-Time High (ATH) after completing a strong impulsive rally from the lower accumulation zone. The bullish leg was clean and well structured, driven by sustained higher highs and higher lows, confirming strong buyer control throughout the advance. However, upon reaching the ATH region, price has begun to stall and reject, signaling that supply is actively responding at this premium area.
Structurally, the market is now compresse
ETH After the Flush — Correction Phase or Just a PauseETHUSD H4 — Capitulation Complete, Is a New Impulse Wave Loading?
ETH on the H4 timeframe has completed a clear distribution → breakdown → impulsive sell-off, followed by a developing Elliott Wave corrective structure at lower prices. The prior accumulation range at the top failed decisively, triggering a strong bearish impulse that unfolded cleanly into a 5-wave decline (1–2–3–4–5), confirming a completed impulsive leg to the downside.
Price is now transitioning into a corrective phase, curre
ETHEREUM H4 — Decision Point Inside Premium DemandOn the ETH 4H chart, price has completed a full Cup & Handle expansion and topped at the pivot high before transitioning into a sharp corrective leg. The selloff was impulsive, not corrective, confirming that the move is a higher-timeframe pullback, not random volatility. ETH is now trading directly inside a premium demand zone, which is a critical decision area for the next multi-session move.
Structurally, this zone is important because it is the origin of the prior expansion leg. If demand h
EURUSD Rejects Key Resistance – Bearish Continuation On the H1 timeframe, EURUSD is showing a clear rejection from a major resistance cluster, reinforcing the prevailing bearish structure. After a sharp impulsive rally, price failed to sustain acceptance above the 1.1695–1.1705 resistance zone, which aligns with prior structure resistance and the downward trendline from the recent swing high. The strong bearish reaction from this area confirms that the upside move was corrective rather than the start of a new bullish trend. Structurally, the marke
Breakout Reaction Completed, Market Now At Decision PointOn the H4 timeframe, EURUSD has just delivered a clean bullish break from the prior consolidation, marked by a strong impulsive candle that displaced price above multiple intraday resistance levels. This move represents a short-term structure break, shifting momentum bullish after an extended downtrend. However, the market has not confirmed continuation yet instead, price is pulling back and retesting the 1.1665–1.1600 support zone, which now acts as the key decision area. From a structure persp
Healthy Pullback or Trap Before the Next Push Higher?On the EURUSD H1 chart, price remains in a bullish intraday structure, but the market is currently transitioning into a corrective pullback phase after the strong impulsive rally. The initial breakout leg was clean and aggressive, confirming buyer dominance and shifting structure decisively to the upside. Since then, price has failed to make new highs and has begun rotating lower, signaling profit-taking rather than full trend reversal.
Technically, EURUSD is now trading between the short-term
ATH Rejection or Just a Pause Before the $5,000 Run?On the Gold (XAUUSD) H1 chart, price is firmly holding a bullish market structure, despite the recent rejection from the ATH zone near 4,880–4,900. The prior move into ATH was a strong impulsive expansion, signaling aggressive institutional buying rather than a weak breakout. The pullback that followed is orderly and corrective, not impulsive a key distinction that keeps the bullish thesis intact.
Technically, price is now reacting inside a clearly defined support zone around 4,760–4,780, align
BTC at a Decision Point — Relief Bounce or Lower High?On the BTCUSD H1 chart, price remains firmly in a short-term bearish structure following the sharp impulsive sell off from the 95,000 region. The breakdown from the prior consolidation occurred with strong momentum, slicing cleanly below the EMA and confirming a shift from balance to markdown. Since then, Bitcoin has been trading beneath a well-defined resistance zone around 93,200–93,500, where previous support has now flipped into supply a classic bearish market behavior.
The recent reaction
ETH Liquidity Sweep Complete: Accumulation or Trap On the ETHUSD H1 timeframe, the market has just completed a clean liquidity sweep below value, and the structure now transitions into a very sensitive decision zone.
Ethereum previously traded inside a high-volume liquidity range around 3,280 – 3,350, where price repeatedly stalled and failed to expand higher. The sharp bearish impulse candle slicing through this range was not random it was a distribution break, confirmed by strong momentum and a decisive loss of the EMA 89. Once price accepted
Bearish HTF Bias with Short-Term Bullish Flag CorrectionGold is still trading under a bearish higher-timeframe structure, and the dominant trend remains to the downside. However, after the recent impulsive move, price appears to be forming a bullish flag / corrective structure, suggesting the possibility of one more short-term upward pulse before continuation.
This setup is counter-trend relative to the higher timeframe, therefore confirmation is mandatory. The bullish move is considered only as a corrective rally, not a trend reversal.
Key observ
ETH Just Collapsed Into Support — Relief Bounce or Start Break1. Market Structure & Impulse Context
ETH has just printed a strong bearish impulse from the upper range, breaking decisively below the EMA cluster (fast + slow EMAs). This move is not corrective — it is an impulsive sell-off, signaling aggressive distribution from the resistance zone near 3,360–3,380.
When price leaves a range with this level of momentum, the first reaction into support often determines whether the move is: a trend continuation, or a liquidity sweep before reversal
Right now,
EURUSD Pressed Against the Downtrend On the H4 timeframe, EURUSD remains firmly locked in a bearish market structure, with price continuing to respect a well-defined descending trendline that has capped every recovery attempt. The broader picture is clear: this is a controlled downtrend, not a capitulation move.
Structurally, the market has been printing lower highs and lower lows, while price consistently trades below the EMA cluster, reinforcing bearish trend alignment. Each bullish swing has been corrective in nature, lacking i
ETH Lost the Accumulation – This Breakdown Shifts the BearishHello Traders....On the H1 timeframe, Ethereum has just delivered a critical structural signal by breaking decisively below the prior accumulation zone, confirming that the range was not continuation but distribution. The sharp impulsive sell off from the upper boundary of the range is not random volatility it reflects a clear rejection from value and a transition into a bearish phase.
For an extended period, ETH was compressing inside the 3,260–3,400 region, where price respected the EMA and r
EURUSD Trapped in a Descending ChannelOn the H4 timeframe, EURUSD continues to respect a well-defined descending price channel, confirming that the broader structure remains bearish. Since topping near the 1.1800 region, price has consistently printed lower highs and lower lows, with each recovery leg being capped by the upper boundary of the channel.
From a price action standpoint, every bullish push is corrective in nature. We can clearly see sharp impulsive sell-offs followed by weaker, overlapping pullbacks — a textbook sign th
EURUSD Compresses at Demand — Breakdown Trap or Reversal Setup?EURUSD on the H1 timeframe remains in a clear short-term downtrend, defined by a descending trendline and a sequence of lower highs. Each bullish attempt into the trendline has been firmly rejected, confirming sellers remain in control of structure.
Price is now pressing into a well-defined demand zone around 1.1590–1.1600, where selling momentum has slowed and candles are beginning to compress. This behavior suggests selling pressure is being absorbed, rather than accelerating lower, which is
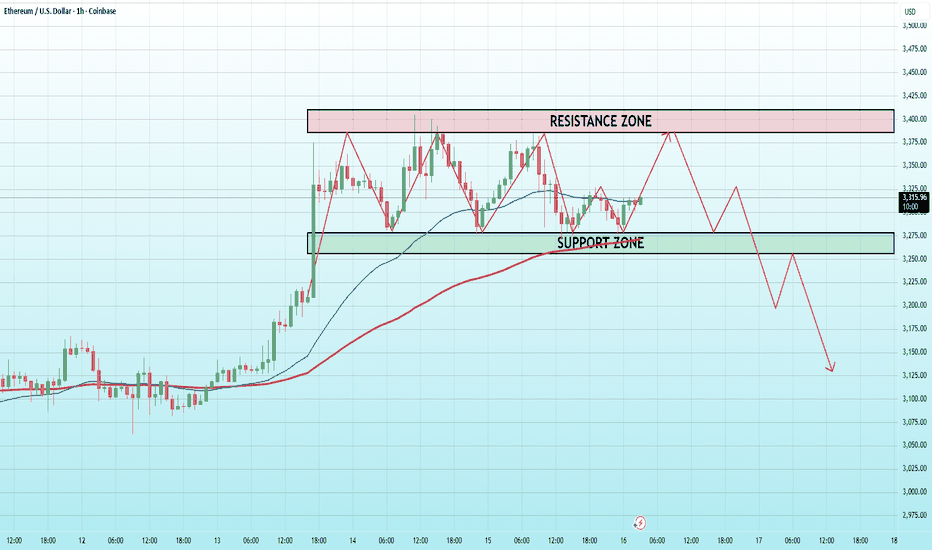
ETH Trapped Between Supply & Demand On the H1 timeframe, Ethereum is clearly transitioning from impulsive strength into a balanced range environment. After a sharp bullish breakout, price stalled inside a well-defined resistance zone around 3,380–3,420, where repeated attempts to push higher have been rejected. This behavior confirms that sell-side liquidity is actively defending the highs, preventing continuation for now.
Structurally, ETH is printing overlapping swings with equal highs and shallow pullbacks, a textbook sign of
EURUSD Is Still Trapped in a Bearish Channel On the H4 timeframe, EURUSD is clearly trading inside a well-respected descending price channel, confirming that the broader market structure remains bearish by trend and by behavior. Every bullish attempt over the past sessions has failed to break the channel resistance, reinforcing the idea that buyers are reacting defensively rather than taking control.
Structurally, the market continues to print lower highs and lower lows, which is the defining characteristic of a downtrend. Price is curren