USDCHF – Bearish Pressure Building at Resistance?USDCHF is approaching a strong confluence zone where the upper bound of its falling wedge pattern intersects with a major resistance zone marked in red. 🔴
This area has already proven its importance multiple times in the past, making it a key decision point for the pair.
As long as this resistance intersection holds, we will be looking for shorts, anticipating another bearish leg lower within the overall corrective structure. 📊
The falling wedge remains intact for now, and sellers continue to defend the upper boundary of the pattern.
A clear rejection from this zone could provide the trigger for the next bearish impulse. ⚡
Will the bears defend resistance once again? 🤔
⚠️ Disclaimer: This is not financial advice. Always do your own research and manage risk properly.
📚 Stick to your trading plan regarding entries, risk, and management.
Good luck! 🍀
All Strategies Are Good; If Managed Properly!
~Richard Nasr
Wedge
OPEN - Falling Wedge Breakout After 7 Months of ConsolidationThe structure formed in OPEN since November 2025 is a falling wedge, a classic bullish pattern that breaks upward in approximately 70% of cases. The measured target for a falling wedge typically points to a return to the start of the pattern, around the $9.50 area. Intermediate horizontal resistance levels that may serve as partial profit-taking zones include $5.50, $6.00, $6.50, and $7.50. The primary risk is a failed breakout that returns price into the wedge. A daily close below $4.80 in the coming days would invalidate the thesis.
Not investment advice.
NEARUSD Showing Early Signs of Reversal from Key SupportNEARUSD retested the 2023 lows, but notice that a decline is overlapped, which indicates a wedge pattern within wave C of a higher degree ABC correction from the highs. It's actually already trying to wake up from the projected 0.80 support area, but to confirm support in place, we have to see an impulsive recovery back above the upper wedge line near the 1.90 level. First bullish evidence is above 3.35 level. Invalidation level is at 0.51.
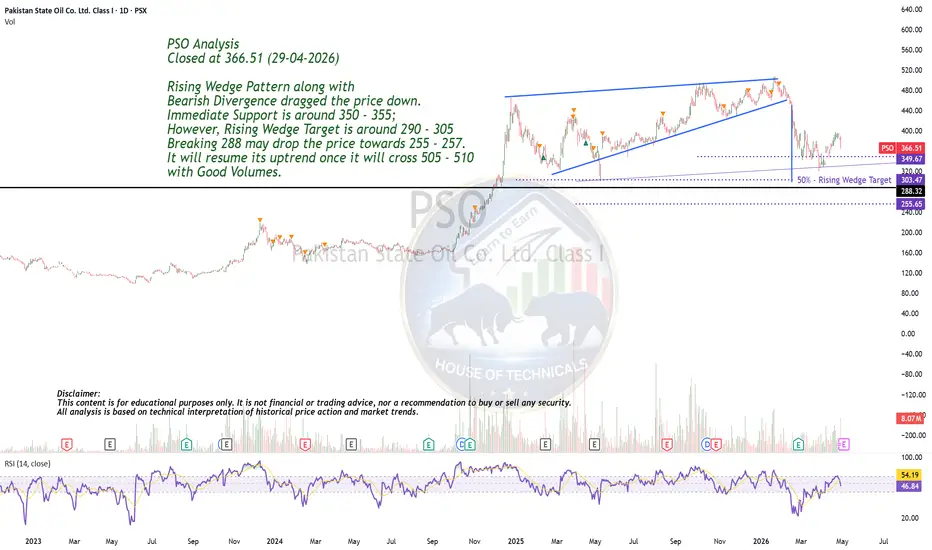
Rising Wedge PatternPSO Analysis
Closed at 366.51 (29-04-2026)
Rising Wedge Pattern along with
Bearish Divergence dragged the price down.
Immediate Support is around 350 - 355;
However, Rising Wedge Target is around 290 - 305
Breaking 288 may drop the price towards 255 - 257.
It will resume its uptrend once it will cross 505 - 510
with Good Volumes.
JUP Update (12H)Since I shared JUP in my previous analysis, JUP did exactly what was expected.
Now there is a possibility for JUP to make another rally.
Many altcoins like LBA (veya hangi coin ise), XLM, etc. are doing the same.
Simple range, breakout test, second accumulation, and breakout.
After JUP cleaned its liquidity areas, the downside momentum has slowed down.
Take a closer look at the volume profile I marked on the right side of the chart.
It simply shows that whoever wants JUP at a higher price already bought it around the first range zone.
Watch the $0.20 area closely; if it breaks, JUP will climb higher.
Thanks for reading.
PALU/USDT – Falling Wedge Breakout, +50% TargetPALU/USDT has been forming a clear falling wedge pattern on the 15-minute chart since its peak above 0.003600. Price is now approaching the apex of the wedge near current levels (~0.002195), with RSI 14 sitting at a neutral ~51 leaving plenty of room for upside momentum.
WARD/USDT – Bullish RSI Divergence Inside Falling WedgeWARD/USDT is printing a textbook bullish setup on the 15-minute chart: a falling wedge pattern combined with a clear bullish RSI divergence. While price has been making lower lows, RSI (14) has been forming higher lows near the oversold zone (~30), signaling weakening bearish momentum and a potential reversal.
CRWV Likes falling wedgeCRWV is beautifully moving in a round bottom shape. It turned bullish since it hit 138. This recent pullback after hitting 138 is a rather buying opportunity. Price has been consolidating in another falling wedge and recently broken out and tested the breakout area near 100. It is bullish as long as it doesn't close below 95 on daily TF. It is likely going to retest 138 again, and breakout will lead to immediate strong resistance at 153. My long term biase will be bullish towards 187 (ATH retest, and I would expect it to hit 240s.
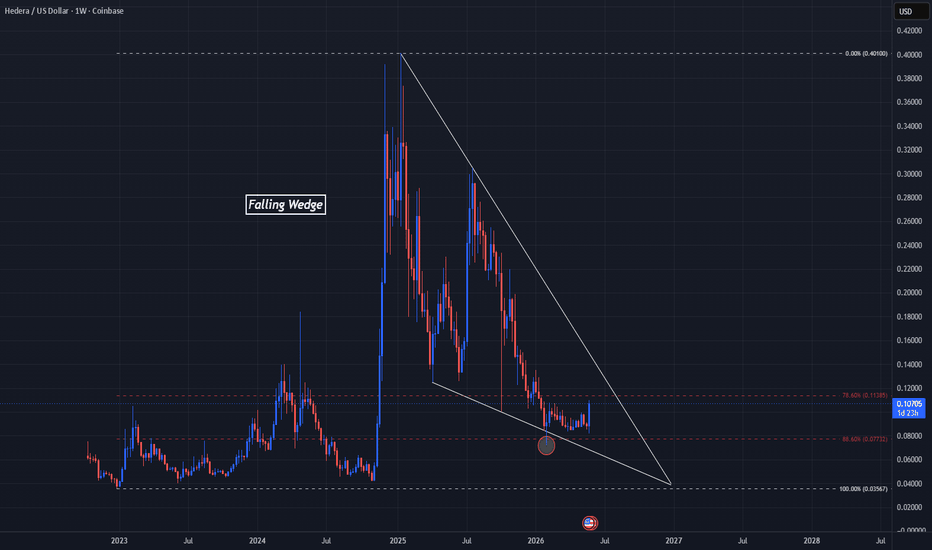
HBAR's Deep Retracement May Be An End To The WedgeCOINBASE:HBARUSD has made leaps and bounds not only in a Technical standpoint, but Fundamentally as well, lets break it down!
Hedera on the Weekly chart has formed what looks to be a Falling Wedge and overlaying a Fibonacci Retracement Tool from the Low of .03 in 2022 to the All Time High of .40, we can see, while price has traded within the pattern, has made an 88.6% retracement and could be pointing to the end of price continuing to fall.
There is still room for price to move to the upside around .14 until we can get the expected proper Bullish Breakout of the pattern.
Once a Breakout happens and a Retest is successful, we can assume that the Breakout move will be equal to that of the price movement of the "Flagpole" or rally in price prior to it falling into the Consolidation Phase it is in now!
Fundamentally, COINBASE:HBARUSD makes sense as a great Alt-coin to invest in with the expansive list of partnerships with Hederas Governing Council like:
- IBM
- Google
- Accenture
- McLaren
- FedEx
- LG
and the list goes on!
Most recently, COINBASE:HBARUSD has made an extension into the Japanese eco-system with being listed on OKCoin.
- www.tradingview.com
Let's not forget, COINBASE:HBARUSD was also 1 of the 16 coins that received "Digital Commodity" status and with the CLARITY Act also helping clear uncertainty in the crypto space with the SEC, COINBASE:HBARUSD should definitely be a coin of interest!
CEG long coming CEG is prepping for a blastoff here as the market is generally bullish. The market sleeps on this play that has a baseline 13% EPS growth with nuclear credits. Any performance from the management team and we sit closer to 20% EPS growth which is an easy double by 2030. Their recent purchase of Calpine allows them to have natural gas exposure to offset nuclear refueling times. They are now the largest private energy provider in the US. Private providers have higher margins and less regulation.
Bajaj Auto Testing ResistanceDaily Timeframe Analysis of Bajaj Auto
The stock is currently facing a strong resistance zone near 10,800 – 10,900 levels. Price action indicates that sellers are active around this area, making it a crucial zone for the next directional move.
For bearish momentum confirmation, a breakdown below the 10,300 support level could trigger further downside pressure, with the stock potentially correcting towards the 10,040 zone in the coming sessions.
View remains bearish until the resistance zone is decisively breached.
Thank You !!
USDJPY: Strong Intraday Confirmation?! 🇺🇸🇯🇵
A quick follow-up for USDJPY.
I see a confirmed breakout of a resistance line of a bullish flag pattern
on an hourly time frame after a retest of a strong support.
We can expect a price rise to 159.45 level.
❤️Please, support my work with like, thank you!❤️
I am part of Trade Nation's Influencer program and receive a monthly fee for using their TradingView charts in my analysis.
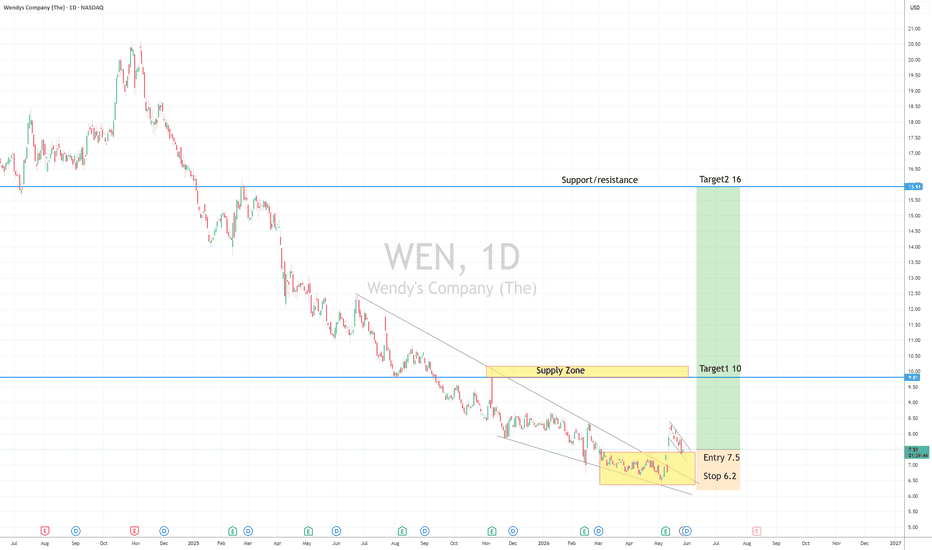
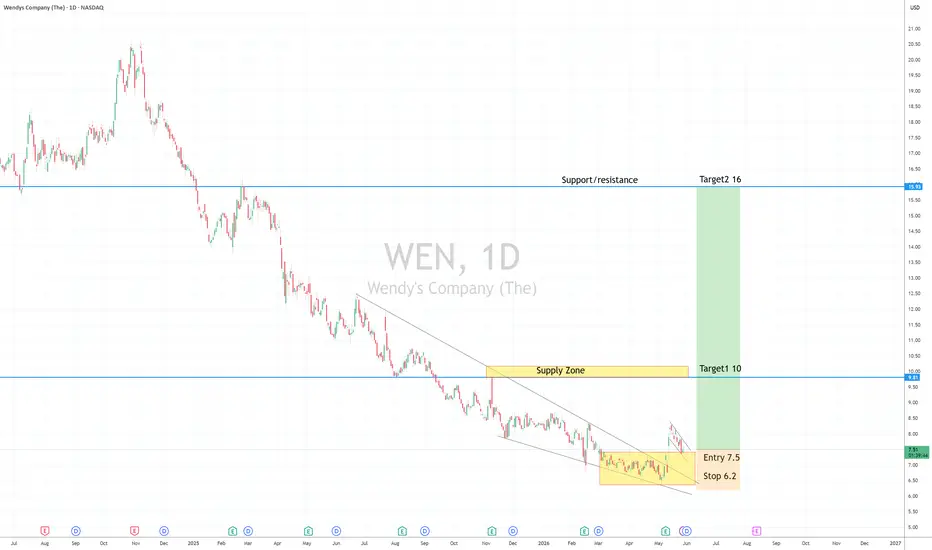
WEN LongWedge Breakout + Flag
Long entry 7.5
stop 6.2
Target 10, 16
Risk management is much more important than a good entry point.
I am not a PRO trader. In 2025, about 25% of my trades had been stopped.
In my trading plan, the Max Risk of each short term trade should be less than 1% of an account.
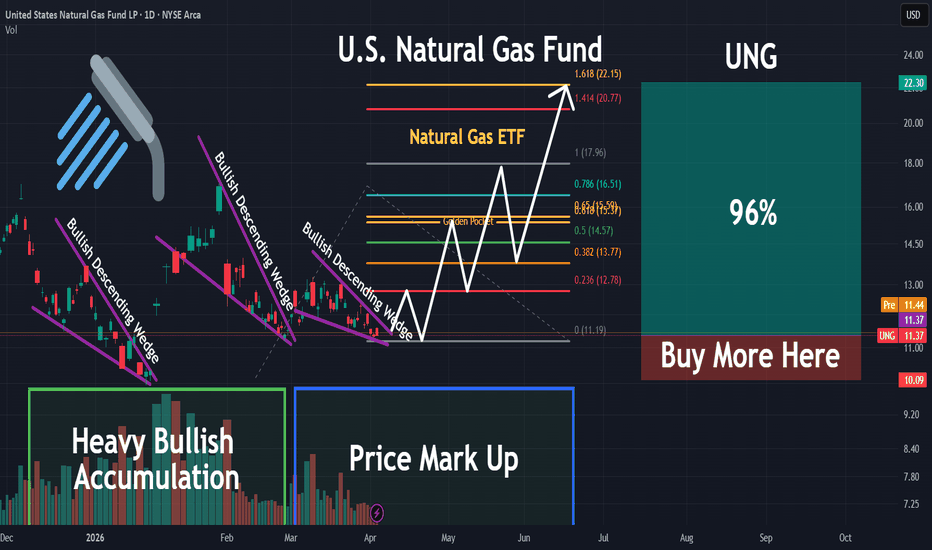
UNG | "Power Plant Day" or Payday? Why UNG is Coiling | LONGIf you thought your wallet felt light after the holidays, buckle up. Natural gas is about to pull a "Phoenix" act, and it’s not just because the groundhog saw its shadow. Between a geopolitical powder keg in the Middle East and the ghost of winter storms past, the "buy the dip" crowd is about to look like geniuses - and everyone else is going to be wearing three sweaters indoors.
1. The "Strait" Jacket: The Trump Deadline
As of this morning, April 7, 2026, the market is holding its breath. President Trump has set a hard 8:00 PM ET deadline for Iran to reopen the Strait of Hormuz or face "decimation" of its energy infrastructure. After the joint US-Israel strikes on February 28, the "will they, won't they" drama has officially pivoted to "they did," and now we’re in the "what next?" phase.
The Math: Roughly 20% of the world’s LNG flows through that narrow strip of water. It’s currently blocked, and Trump is threatening to turn Iran’s power plants into expensive parking lots if the gates don't open tonight.
The Snark: If you thought your gas bill was high, wait until the "Strait" becomes a "Dead End." Analysts are predicting global LNG prices could quadruple. That’s not a "pop"—that’s a moon mission without a flight plan, fueled by a President who treats geopolitical deadlines like a season finale of The Apprentice.
2. "Winter Storm Fern" Left the Cupboard Bare
While Trump is bringing the heat to the Middle East, Winter Storm Fern already brought the cold to our inventories. Remember late January? While you were complaining about the slush, Fern was busy devouring the US natural gas supply.
The Record: We saw the largest weekly storage withdrawal in history (360 Bcf).
The Fallout: Despite the Trump administration’s "Energy Dominance" push to drill everywhere including your backyard, inventories are still struggling to recover from that historic drain. We’re basically running the heater on "E," and the EIA just hiked forecasts because we're one global supply disruption away from a real problem.
3. The Technical "Spring-Load": 3 Mini Bullish Wedges
From a swing trader's perspective, the chart for UNG (Natural Gas) is starting to look like a coiled rattlesnake.
The Triple Threat: We are currently seeing three mini bullish descending wedges forming on the 4-hour chart. For the uninitiated: that’s technical speak for "the sellers are exhausted and the buyers are hiding in the bushes with a net."
The MACD Divergence: The 3D MACD is curving up, flashing a classic divergence. While the "mild weather" crowd hammered prices down to the $2.80 - $3.20 range, the momentum is shifting.
The Gap: With Sunday's open already showing volume spikes, that $3.20 entry looks like a gift-wrapped souvenir from a simpler time.
The Verdict
The market was priced for a "boring" shoulder season. Instead, it got a geopolitical ultimatum and a technical triple-wedge setup. If you haven't looked at UNG or BOIL for a scalp, you're essentially betting that the Middle East will suddenly find its "zen" and Trump will miss a deadline.
Positioning for "The Divergence Seeker": We are watching the divergence between "peace-time pricing" and "war-time reality." If the 8 PM deadline passes without a deal, the "Buy" signal won't just be a bar on your TradingView chart - it’ll be a vertical line.
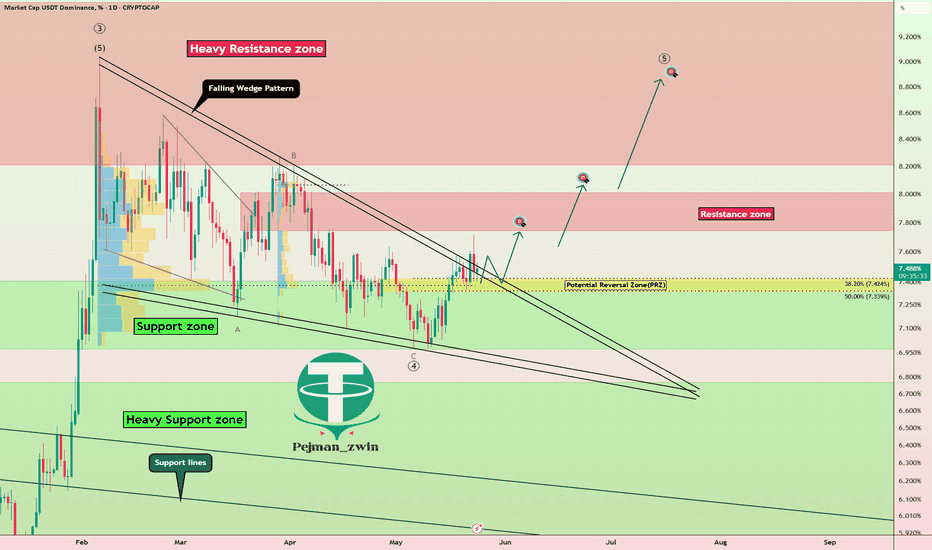
USDT.D% Is Turning Up — Could Crypto Feel the Pressure?The USDT.D% ( CRYPTOCAP:USDT.D ) is, as I’ve mentioned in previous ideas, an important index for crypto market analysis. When it rises, it can lead to a drop in crypto prices, especially Bitcoin ( BINANCE:BTCUSDT ).
At present, the USDT.D% appears to have broken the upper line of a falling wedge pattern and has passed the significant 7.4% level, which is a key trading level for USDT.D%.
From Elliott Wave Theory on the daily timeframe, USDT.D% looks like the main wave 4 is complete, and we might be awaiting the wave 5 upward movement. But wave 4 can sometimes become complex.
I expect USDT.D% to begin a volatile rise from the Potential Reversal Zone(PRZ) and at least reach the resistance zone(8.00%-7.74%).
Of course, news from the Middle East—such as potential military conflicts between Iran and the U.S.—affects both the crypto market and USDT.D%. However, if tensions ease and an agreement is signed, markets might return to their technical trends. Given that U.S. indices, particularly the S&P 500 ( FX:SPX500 ), have recently hit new all-time highs, a correction in those indices could align with a rise in USDT.D%.
First Target: Resistance zone(8.00%-7.74%)
Second Target: 8.04%
Third Target: 8.88%
Stop Loss(SL): 7.40%
What’s your opinion on USDT.D%? Can it start another bullish run or not?
💡 Please respect each other's opinions and express agreement or disagreement politely.
📌Market Cap USDT Dominance% Analyze (USDT.D%), Daily time frame.
🛑 Always set a Stop Loss(SL) for every position you open.
✅ This is just my idea; I’d love to see your thoughts too!
🔥 If you find it helpful, please BOOST this post and share it with your friends.
BTCUSDT Long: Demand Holds at 76,000 – Recovery to 79,000 AheadHello traders! Here’s my technical outlook on BTCUSDT (4H) based on the current chart structure. BTC previously traded inside a broad consolidation range before breaking lower through a key support level near 79,000, confirming a shift in short-term market control.
Currently, BTCUSDT is recovering from the demand area and moving higher toward the 79,000 Supply Zone, which previously acted as strong support before turning into resistance.
My scenario: as long as BTCUSDT holds above the 76,000 Demand Zone and respects the rising demand line, the bullish recovery remains valid. A continuation higher could push price toward the 79,000 Supply Zone (TP1), where sellers may attempt another rejection. Manage your risk!
OUST: When lidar becomes the eye of physical AIOuster builds high performance lidars and software solutions so robots, vehicles and urban infrastructure can see and make decisions in real time. The company trades on NASDAQ and everyone who understands physical AI is watching because this is no longer about automation but about safety, efficiency and control.
Fundamentals
The next earnings report is expected on May 5 2026. On February 26 the company reported fourth quarter results. Revenue reached 62 million dollars including about 21 million in royalty income from IP licensing. Product revenue grew 36 percent year over year to 41 million. Over 8100 sensors were shipped in the quarter and over 25000 for the full year representing 48 percent growth. GAAP gross margin reached 60 percent with adjusted EBITDA positive at 11 million dollars. Cash on hand stands at 211 million dollars with no debt.
Positive developments. On February 4 the company closed the acquisition of StereoLabs for 35 million dollars and 1.8 million shares. Ouster combined its digital lidars with StereoLabs stereocameras and AI software creating the worlds first unified sensor and perception platform for physical AI. StereoLabs brought over 10000 customers and 90000 cameras along with about 16 million in annual revenue and positive EBITDA. On September 15 a strategic partnership was signed with Constellis to deploy Ouster Gemini in physical security systems worldwide. The Ouster OS1 lidar received approval from the US Department of Defense and was included in the Blue UAS Framework as the first high resolution 3D lidar in the program. On March 31 the Department of Defense published a tender for the Astro Max Lidar UAS package with the Ouster OS1 64 sensor for the United States Military Academy at West Point. Guidance for the first quarter of 2026 expects revenue of 45 to 48 million dollars including StereoLabs. Royalties in 2026 are expected to be less than 5 million dollars. The company maintains long term targets of 30 to 50 percent annual revenue growth and 35 to 40 percent GAAP gross margins.
Risks include continued investment in growth and StereoLabs integration, lower royalties impacting short term margins and high competition in the lidar segment.
Technicals
On the weekly chart a falling wedge has formed with a breakout to the upside. Price tested the MA100 zone from below twice at 16.20 which was the optimal entry point. On Thursday April 16 price closed at 24.17. On the weekly chart ADX indicates no strong trend while DI+ is above DI- showing a bullish bias. MACD gives a buy signal. Volume is below average but confirms interest. A pullback to the 20.20 zone is possible before further upside.
Targets from the chart are 36.16 and then 57.61.
The market values OUST on its ability to integrate StereoLabs, scale the physical AI platform and achieve sustainable profitability. The technical breakout is confirmed and targets are above.
Faliing wedge patternFaliing wedge pattern has already formed and broken out, followed by a low-volume retest — a classic bullish confirmation signal.
This area appears to offer a favorable entry opportunity, with a defined stop-loss at 2.22 to manage risk.
If momentum continues and the structure holds, the upside potential could exceed 11x from current levels.
As always, wait for confirmation and manage your position accordingly.
Faliing wedge patternA descending wedge appears to be forming on the weekly chart, accompanied by a noticeable influx of liquidity.
The bottom seems to have been established around $0.32 , which could act as a strong base for a potential reversal.
If the pattern confirms, the projected target is around $7.5 , representing a potential upside of over 17x from current levels.
This outlook is further supported by emerging positive developments surrounding the company, which may act as a catalyst for momentum.
As always, confirmation and risk management are key.
NLong