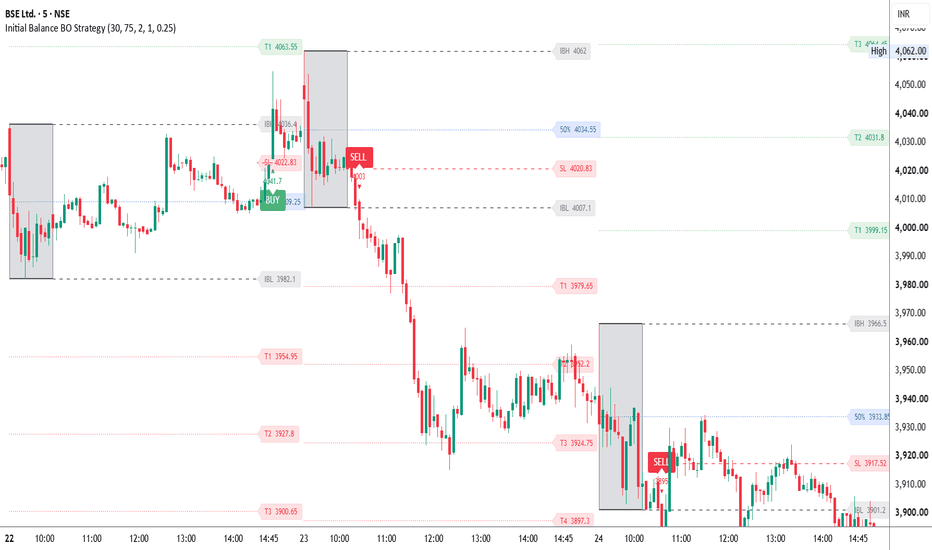
McGinley T3 Flow Campaign [NICK789] v.1McGinley T3 Flow Campaign is a trend-following strategy built around an adaptive signal trail and a campaign-style trade management model.
The script is designed to identify confirmed trend-flow transitions, open a long or short campaign, and then display entry, target, and optional stop levels directly on the chart. It is not intended to predict tops or bottoms. Instead, it waits for the selected flow engine to shift direction and then manages the trade as a structured campaign.
━━━━━━━━━━━━━━━━━━━━━━
CORE IDEA
━━━━━━━━━━━━━━━━━━━━━━
The main concept is to combine an adaptive moving-average engine with an ATR-based trailing structure.
The signal engine can use:
• McGinley Dynamic only
• T3 smoothing only
• A blend of McGinley Dynamic and T3
The McGinley Dynamic is used because it adapts to changes in price speed more smoothly than a standard moving average. T3 smoothing is included as an optional alternative for traders who prefer a smoother trend basis. The blended mode averages both curves to create a balanced engine between responsiveness and smoothness.
After the engine basis is calculated, the script builds an ATR signal trail around it. The trail updates using volatility distance and then locks in a directional path. A confirmed transition in this trail creates the long or short signal.
This means the signal is not based on a simple moving-average crossover. The strategy waits for the adaptive trail itself to shift direction.
━━━━━━━━━━━━━━━━━━━━━━
HOW SIGNALS ARE GENERATED
━━━━━━━━━━━━━━━━━━━━━━
A long signal occurs when the ATR signal trail confirms an upward transition.
A short signal occurs when the ATR signal trail confirms a downward transition.
Signals are confirmed on closed bars. This helps avoid reacting to unfinished candle movement.
The script separates main signals from continuation signals:
• Main BUY / SELL labels appear when a new direction starts
• Smaller continuation triangles appear when the same direction refreshes
This keeps the chart cleaner while still showing when the flow continues in the same direction.
━━━━━━━━━━━━━━━━━━━━━━
CAMPAIGN TARGET MODEL
━━━━━━━━━━━━━━━━━━━━━━
Instead of using only fixed ATR targets, this strategy uses a campaign target system.
There are two target modes:
1. Flow Trail Based
Targets are projected from the distance between price and the active ATR signal trail. This makes the target model expand and contract with the current trend structure.
2. ATR Baseline
Targets are projected from a standard ATR baseline for traders who prefer a more traditional volatility target model.
The Flow Trail Based mode is the default because it connects the target spacing directly to the same adaptive trail that produced the signal.
Target levels are displayed as:
• Entry
• TP1
• TP2
• TP3
• Optional SL
Each level includes its price on the chart.
━━━━━━━━━━━━━━━━━━━━━━
TAKE PROFIT EXIT MODES
━━━━━━━━━━━━━━━━━━━━━━
The strategy includes multiple take-profit behaviours:
• TP1 Only
• TP2 Only
• TP3 Only
• Scale Out TP1 / TP2 / TP3
In scale-out mode, the position is reduced across TP1, TP2, and TP3 using the percentage settings.
In single-target modes, the strategy exits the full position at the selected target.
This allows the same signal engine to be tested with different trade management styles.
━━━━━━━━━━━━━━━━━━━━━━
STOP MODE
━━━━━━━━━━━━━━━━━━━━━━
The stop system has three modes:
• Off
• Visual Only
• Visual + Strategy Exit
By default, Stop Mode is set to Visual Only.
This means the SL line is shown as a campaign reference, but it does not close the strategy trade unless the user changes Stop Mode to Visual + Strategy Exit.
This is intentional because some traders use the stop line as a visual invalidation reference while others want the strategy tester to execute the stop automatically.
━━━━━━━━━━━━━━━━━━━━━━
DASHBOARD
━━━━━━━━━━━━━━━━━━━━━━
The dashboard shows:
• Selected engine mode
• Selected target mode
• Current flow state
• Current strategy position
• Win rate
• PNL and drawdown
━━━━━━━━━━━━━━━━━━━━━━
HOW TO USE
━━━━━━━━━━━━━━━━━━━━━━
1. Choose the engine mode
McGinley Only is the default and gives a responsive adaptive trend read. T3 Only is smoother. Blend mode combines both.
2. Adjust ATR Trail Length and ATR Trail Multiplier
These settings control how sensitive the signal trail is. Lower values react faster but may create more signals. Higher values create smoother signals but can be slower.
3. Choose the Target Mode
Flow Trail Based uses the distance from price to the signal trail. ATR Baseline uses a standard ATR distance.
4. Choose the Take Profit Exit Mode
Use TP1, TP2, or TP3 only for full exits, or use Scale Out mode for partial profit-taking.
5. Choose the Stop Mode
Use Visual Only for chart reference. Use Visual + Strategy Exit if you want the strategy tester to close trades at the stop level.
6. Use the Backtest Start setting
The Backtest Start input lets users control the test period without changing the script.
━━━━━━━━━━━━━━━━━━━━━━
WHAT MAKES THIS SCRIPT DIFFERENT
━━━━━━━━━━━━━━━━━━━━━━
This script is not a simple collection of unrelated indicators.
The components are connected in a single workflow:
• The McGinley/T3 engine creates the adaptive trend basis
• The ATR signal trail converts that basis into a directional flow line
• Confirmed trail transitions create campaign entries
• The target system projects trade levels from the active flow structure
• The dashboard summarizes the active engine, target model, trade state, and performance
The main purpose of the script is to turn an adaptive trend transition into a structured trade campaign with visible entry, targets, stop reference, and performance context.
━━━━━━━━━━━━━━━━━━━━━━
IMPORTANT NOTES
━━━━━━━━━━━━━━━━━━━━━━
This is a strategy script for backtesting and study. It is not financial advice.
Past performance does not guarantee future results.
Results will vary by symbol, timeframe, spread, commission, session, and market condition.
The script works best when users test different settings for the market they trade instead of assuming one preset fits every asset.
Because this is a trend-following model, it can perform well during directional moves but may produce weaker results during sideways or choppy conditions.
전략

지표
지표

Market Regime & Trend Filter🚀 MARKET REGIME & TREND FILTER PRO
The Market Regime & Trend Filter Pro (MRTF), engineered by gunebak4n, is an institutional-grade multi-dimensional trend classification and market structure isolation framework. It is designed to visually map macro price regimes, isolate structural expansions, and filter out low-liquidity market noise without a single pixel of signal repainting.
MRTF operates on the core principle that directional price movement cannot be evaluated in a vacuum. True, sustainable trends are defined by the mathematical convergence of statistical linear regression velocity and validated swing market structures (Higher Highs / Lower Lows). By unifying an asset-agnostic, normalized slope calculation with a lag-free swing matrix, MRTF projects multi-state market environments directly onto the user's chart.
Unlike traditional moving averages or standard trend-following tools that suffer from severe lag or generate devastating false signals during prolonged sideways consolidations, MRTF dynamically shifts across five distinct market regimes—instantly distinguishing a high-conviction breakout from a dangerous, low-velocity trap.
💡 CORE DESIGN PRINCIPLES
🧭 Normalized Statistical Velocity Engine
Standard linear regression slopes fail when comparing different assets or volatile timeframes because their raw values depend entirely on the asset's nominal price. MRTF solves this by processing the raw slope (Beta Coefficient) through a dynamic ATR (Average True Range) normalization matrix. This transforms ordinary regression into a universal, percentage-based momentum tracker that remains stable across Bitcoin, Apple, or Gold.
🧬 Non-Repainting Multi-Layer Validation
The framework continuously evaluates two distinct algorithmic layers:
Statistical Trend Component: A localized rolling covariance engine that measures the geometric slope of the price index over a user-defined lookback window.
Structural Swing Component: A strict, non-repainting pivot tracking system that marks qualified market structures based on strict historical confirmations.
The structural intersection of these layers determines the definitive macro market regime.
💡 KEY FEATURES
📊 Five-State Market Regime Matrix
Instead of a binary "bull or bear" output, MRTF classifies the market into 5 actionable phases to optimize strategy execution:
Strong Bullish: Market structure is breaking higher (HH/HL) and the normalized channel slope is expanding aggressively upward.
Weak Bullish: Structural trend is upward but momentum is flattening, OR macro momentum is extremely bullish despite temporary structural breaks.
Ranging / Choppy: The absolute trend slope is compressed inside the dead-zone threshold. Capital preservation mode.
Weak Bearish: Structural trend is downward but selling momentum is stalling, OR macro momentum is sharply negative despite minor upward structural retracements.
Strong Bearish: Market structure is breaking lower (LH/LL) and the normalized channel slope is accelerating aggressively downward.
🧪 Advanced Chart-Scale Alignment (Log/Linear)
A critical feature engineered into MRTF is its manual Price Scale Mode switch. Because Pine Script cannot natively detect whether a user's visual chart layout is set to Logarithmic or Linear, MRTF provides an input enum to match your chart. This prevents the mathematical distortion of regression slopes on long-term logarithmic charts, ensuring accurate momentum readings.
🛡️ Non-Repainting Historical Swing Mapping
The indicator utilizes advanced pivot logic to identify valid structural peaks and troughs. By utilizing a fixed right-bar confirmation offset, the system completely eliminates the risk of signal repainting. Shapes are placed historically precisely where the structural pivot occurred, offering an uncorrupted look back at structural market transitions.
🔬 MATHEMATICAL ARCHITECTURE
If Scale Mode is Logarithmic:
Y_val = ln(Close)
If Scale Mode is Linear:
Y_val = Close
• Mean_X = SMA(bar_index, Length)
• Mean_Y = SMA(Y_val, Length)
• Mean_XY = SMA(bar_index * Y_val, Length)
• Cov_XY = Mean_XY - (Mean_X * Mean_Y)
• Variance_X = Variance(bar_index, Length)
• Raw_Slope = Cov_XY / Variance_X
• ATR_Val = ATR(Length)
If Scale Mode is Logarithmic:
Normalized_Slope = Raw_Slope * 100
If Scale Mode is Linear:
Normalized_Slope = (Raw_Slope / ATR_Val) * 100
🛠️ USAGE FRAMEWORK
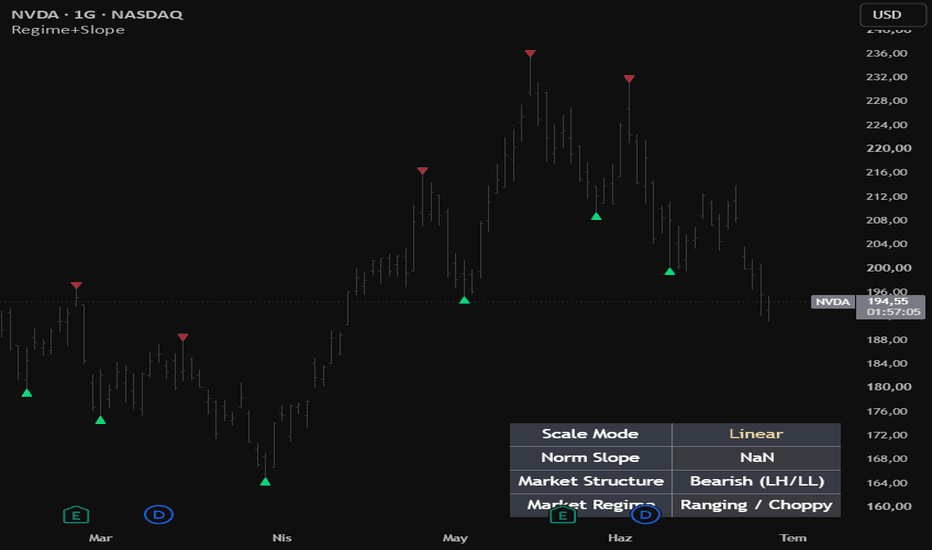
1. Candlestick Regime Coloring
Monitor the color shifts of the live candlesticks to instantly identify the dominant institutional phase:
Bright Lime Candles: Strong Bullish Expansion. (Ideal for riding strong macro trend extensions).
Muted Green Candles: Weak Bullish Phase / Potential Exhaustion or Minor Retracement.
Gray Candles: Ranging / Choppy Environment. Tighten stop-losses, avoid breakout chasing, and look for mean-reversion setups.
Muted Maroon Candles: Weak Bearish Phase / Defensive Posture.
Bright Red Candles: Strong Bearish Expansion. (Ideal for capital preservation or short-side exposure).
2. Analytical Control Dashboard
The real-time HUD (Heads-Up Display) in the corner of your chart provides a synchronized summary of market health:
Scale Mode: Confirms whether your mathematical engine is aligned with your visual chart scale.
Norm Slope: Displays the exact normalized statistical momentum score. Values crossing outside your threshold indicate volatility expansions.
Market Structure: Shows the structural orientation based on valid pivot series (Bullish, Bearish, or Undetermined).
3. Structural Pivot Turning Points
The small red and lime triangles plotted on the chart mark confirmed structural swing points. Because they are fully non-repainting, they represent concrete psychological levels where institutional order flow shifted, making them excellent levels for placing structural stop-losses or identifying major support/resistance zones.
⚙️ SYSTEM CHARACTERISTICS
Zero Repainting: All background calculations, candlestick color shifts, and swing markers are mathematically locked upon bar close.
Fully Parameterized Controls: Seamlessly adjust regression lengths, swing confirmations, and slope thresholds to adapt the script to Scalping, Day Trading, or Macro Swing Trading.
Asset-Agnostic Engine: Works flawlessly across Equities, Forex, Crypto, Indices, and Commodities by converting absolute price tracking into standardized volatility metrics.
Custom Visual Themes: Every single regime color and dashboard location parameter can be customized within the user settings panel to fit clean dark or light chart aesthetics.
📌 CREDIT
The Market Regime & Trend Filter Pro (MRTF) is officially engineered and published by gunebak4n on TradingView.
This script is built for professional traders who prioritize statistical clarity and structural confirmation over erratic, lagging indicators or noise-heavy lagging moving averages.
⚠️ DISCLAIMER
MRTF is a probabilistic statistical mapping model designed for data visualization. It does not issue absolute trading recommendations, financial advice, or automated profit guarantees. Always backtest your parameters and manage your risk exposure strictly according to your personal trading plan. 지표
전략
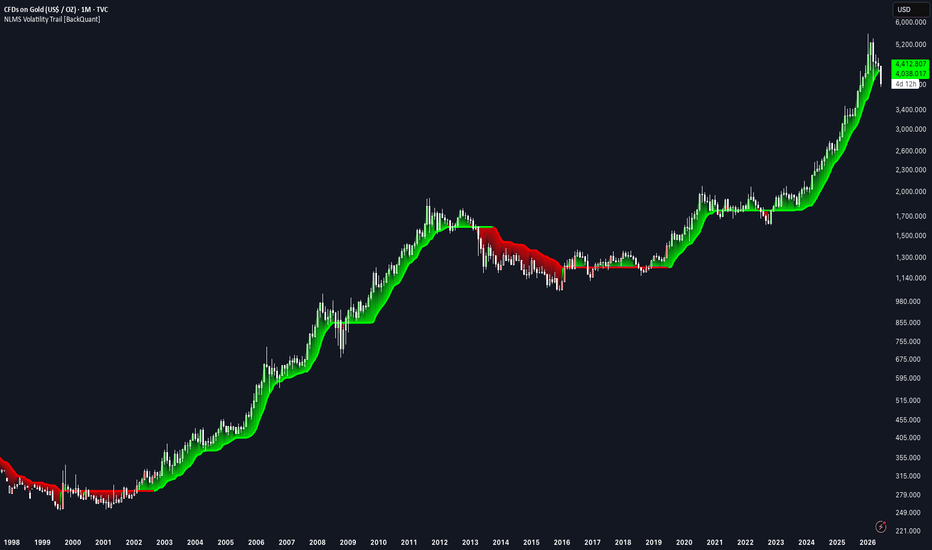
NLMS Volatility Trail [BackQuant]NLMS Volatility Trail
Overview
NLMS Volatility Trail is an adaptive trend-following overlay that combines a machine-learning style adaptive filter with a volatility-based trailing structure. It is built around the Normalized Least Mean Squares (NLMS) algorithm, then converts that adaptive estimate into an ATR-based trailing line designed to follow directional regimes while filtering out minor noise.
The indicator has two core layers:
An NLMS adaptive filter , which learns a dynamic price estimate from prior bars.
An ATR volatility trail , which converts that learned estimate into a step-like directional trailing structure.
The goal is to produce a trend line that is more adaptive than a traditional moving average and more structured than a raw adaptive filter. The NLMS engine learns the underlying price path, while the ATR trail adds volatility-aware confirmation so trend shifts only occur when the adaptive estimate moves meaningfully.
Core idea
Most trend filters use fixed smoothing rules. An EMA, SMA, WMA, or HMA always applies the same mathematical weighting scheme regardless of whether the market is trending, ranging, expanding, or compressing.
NLMS is different. It continuously updates its internal weights based on prediction error.
This means the filter is not just averaging price. It is constantly asking:
How well did the previous weighting structure predict the current bar?
How large was the error?
How should the weights adjust to reduce future error?
The second layer then takes that adaptive estimate and applies an ATR-based trailing mechanism around it. This creates a volatility-adjusted trend trail that reacts to confirmed shifts while ignoring smaller movements that do not exceed the range structure.
What NLMS is
NLMS stands for Normalized Least Mean Squares . It is an adaptive filtering algorithm from digital signal processing. It is closely related to the original LMS algorithm developed by Bernard Widrow and Ted Hoff, which became one of the foundational online learning methods used in adaptive systems.
Adaptive filters have historically been used in:
Noise cancellation
Echo cancellation
Telecommunications
Radar and sonar processing
Signal prediction
Control systems
The basic purpose is to estimate or predict a signal while continuously adapting to changing conditions.
In trading terms, this indicator uses NLMS to build a learned estimate of price from prior bars.
How the NLMS filter works
The filter uses a set of historical inputs called taps .
If taps = 72, the model uses the previous 72 bars:
source
source
source
...
source
Each tap has a learned weight.
The prediction is calculated as:
prediction = w1 × source + w2 × source + ... + wM × source
The filter then compares the prediction to the actual current source:
error = source - prediction
That error drives the weight update.
If the prediction was poor, the weights adjust more.
If the prediction was accurate, the weights adjust less.
This creates an adaptive estimate that evolves with market behavior.
Why it is normalized
The normal LMS algorithm updates weights based on the raw input and prediction error. The issue is that if the input signal becomes large or volatile, updates can become unstable.
NLMS solves this by dividing the update by the input power:
power = sum(source ²)
The update becomes:
w = w + (μ / (ε + power)) × error × input
This normalization makes the learning process more stable across different volatility environments.
When the input power is high:
Updates are scaled down.
The filter avoids overreacting.
When the input power is low:
Updates are allowed to remain meaningful.
This is why NLMS is better suited to markets than a basic adaptive filter. Markets constantly shift between quiet and volatile regimes.
Weight initialization
The script initializes all weights equally:
weight = 1 / M
This means the filter starts with an SMA-like prior. Before learning begins, every historical bar contributes equally.
Over time, the filter adapts away from that equal-weight baseline and learns its own weighting structure.
Inputs that control the NLMS engine
Filter Taps (M)
Controls how many historical bars the model learns from.
Higher taps:
More memory
Smoother adaptive estimate
Slower response to regime change
Lower taps:
Less memory
Faster reaction
More noise sensitivity
Step Size (μ)
Controls the learning rate.
Lower μ:
Slower learning
Smoother output
More stable
Higher μ:
Faster learning
More responsive
Can become noisy if too aggressive
This is one of the most important settings. It controls how quickly the model changes its internal weights.
Regularization (ε)
Prevents instability when input power is very low.
It acts as a stabilizer in the denominator:
ε + power
Higher values make updates more conservative.
Lower values allow stronger adaptation but can become less stable in quiet conditions.
From adaptive filter to volatility trail
The raw NLMS output is not plotted directly as the main trend line. Instead, it is passed into a volatility trailing structure.
The script builds an ATR band around the NLMS estimate:
Upper band = NLMS output + ATR × factor
Lower band = NLMS output - ATR × factor
Then it creates a trailing value that only updates when the NLMS band structure forces it to move.
This creates a trail that behaves similarly to a volatility stop, but the center is not price or hl2. It is the learned NLMS estimate .
ATR volatility trail logic
The trail starts from the NLMS output, then carries forward its previous value:
nlmsAtr := previous nlmsAtr
Then:
If lower band rises above the trail, the trail moves up.
If upper band falls below the trail, the trail moves down.
This creates a directional trailing structure:
In bullish regimes, the trail ratchets upward.
In bearish regimes, the trail ratchets downward.
It filters out small movements because price must move enough relative to ATR and the adaptive estimate to change the trail direction.
Why combine NLMS with ATR
NLMS alone gives an adaptive estimate, but it can still wiggle as the model learns.
ATR alone gives volatility structure, but it is usually tied to raw price and fixed smoothing.
Combining them gives:
Adaptive intelligence from NLMS.
Volatility confirmation from ATR.
Cleaner trend state transitions.
Less dependence on fixed moving-average assumptions.
The NLMS model learns the underlying price behavior, while ATR decides whether movement is large enough to matter.
Trend direction
Trend flips are detected from the trail itself:
Bullish when nlmsAtr crosses above its previous value.
Bearish when nlmsAtr crosses below its previous value.
This means signals are generated when the volatility trail changes direction, not when price simply crosses the line.
That is important because:
The trail must structurally move.
The signal is tied to confirmed trail direction.
Noise around the line does not automatically create a flip.
Visual design
The indicator includes several visual layers.
Main trail line
The central plotted line is the NLMS ATR trail. It changes color based on the current trend state:
Green for bullish trail direction.
Red for bearish trail direction.
Gray before a trend state is established.
Gradient fill
The script fills the space between price and the trail:
If price is above the trail, bullish fill is shown.
If price is below the trail, bearish fill is shown.
The fill is stronger near the trail and fades toward price, making the trail feel like the active structural reference.
Trail glow
A soft glow is drawn around the trail using a small ATR offset:
glow = ATR(14) × 0.06
This highlights the trail visually without cluttering the chart.
Trend candles
Candles are colored by trend state:
Bullish trend = bullish candles.
Bearish trend = bearish candles.
This allows the script to function as a complete regime overlay.
How to interpret the indicator
Bullish state
A bullish state occurs when the NLMS volatility trail turns upward.
This suggests:
The adaptive filter is shifting higher.
The ATR trail has confirmed upward structure.
Trend pressure has turned bullish.
Bearish state
A bearish state occurs when the NLMS volatility trail turns downward.
This suggests:
The adaptive estimate is shifting lower.
The volatility trail has confirmed downside structure.
Trend pressure has turned bearish.
Price above the trail
Generally indicates bullish structure.
Price below the trail
Generally indicates bearish structure.
But the most important signal is the direction of the trail itself, not every price touch.
How to use it in practice
1) Trend following
Use the trail direction as the primary bias:
Favor longs when the trail is bullish.
Favor shorts when the trail is bearish.
2) Dynamic support/resistance
The trail can act like a dynamic structural level:
In uptrends, pullbacks toward the trail can act as support.
In downtrends, rallies toward the trail can act as resistance.
3) Trade management
The trail can be used as:
A trailing stop guide.
A regime invalidation level.
A trend continuation reference.
4) Regime filtering
Because the line adapts using NLMS and only flips when the volatility trail turns, it can be used to filter other entries:
Take only long setups during bullish trail regimes.
Take only short setups during bearish trail regimes.
Avoid countertrend trades when the trail is strongly directional.
Difference from normal Supertrend or ATR trails
A normal ATR trail is usually built directly from price or hl2.
This indicator is different because the trail is built around an adaptive learned estimate.
That means:
The centerline is not raw price.
It is not a fixed moving average.
It is a continuously learned NLMS estimate.
So the trail has a different character:
More adaptive than a standard moving average trail.
More stable than a raw price-based ATR stop.
More responsive to changing market structure than fixed filters.
Difference from the NLMS Adaptive Trend Filter
The NLMS Adaptive Trend Filter plots the learned estimate directly and reads trend from its slope.
NLMS Volatility Trail goes one step further:
It uses the learned estimate as the base.
Then wraps it with ATR structure.
Then turns that into a trailing regime line.
So this version is more structure-oriented and better suited for trailing trend behavior.
Parameter tuning
Taps
Use higher taps for smoother trend structure.
Use lower taps for faster adaptation.
Step Size
Use lower step size for stability.
Use higher step size for responsiveness.
Regularization
Use higher regularization when the filter feels unstable.
Use lower regularization when the filter is too sluggish.
ATR Period
Controls volatility estimate:
Shorter = more reactive trail.
Longer = smoother trail.
ATR Factor
Controls band width:
Higher factor = wider trail, fewer flips.
Lower factor = tighter trail, more flips.
Strengths
Combines adaptive filtering with volatility trailing logic.
Learns from market structure instead of using fixed weights.
Uses ATR to reduce noise and confirm meaningful movement.
Good for trend following and trailing stop frameworks.
Visually clean with gradient fill and candle coloring.
Limitations
Still reactive, not predictive.
Can lag during violent reversals.
High learning rates may create noise.
Low ATR factors may cause whipsaws.
Requires tuning for timeframe and asset volatility.
Summary
NLMS Volatility Trail combines an adaptive NLMS predictor with an ATR-based trailing structure. The NLMS layer continuously learns a dynamic estimate of price from historical bars, while the ATR trail converts that estimate into a cleaner directional regime line. This makes the indicator more adaptive than a traditional moving average and more structured than a raw adaptive filter. It is best used as a trend-following overlay, dynamic support/resistance guide, and volatility-aware trailing framework.
지표
지표

지표

지표

지표

Multi-Timeframe Trend Table (Weighted)**Multi-Timeframe Trend Table (Weighted) — Market Bias Dashboard**
This indicator is a **multi-timeframe trend analysis system** designed to evaluate overall market direction using a weighted combination of **ATR trend structure, Stochastic RSI momentum, and Moving Averages** across multiple timeframes.
It aggregates data from higher to lower timeframes into a single **bias scoring table**, giving traders a clear, structured view of market sentiment and directional strength.
---
### 🔍 Core Concept
Instead of relying on a single timeframe or indicator, this tool builds a **composite market bias model** by:
* Analysing trend strength across multiple timeframes (Monthly → 1M)
* Applying weighted importance to each timeframe
* Combining three key systems:
* ATR-based trend direction (volatility structure)
* Stochastic RSI momentum shifts
* Moving Average bias filter
---
### 📊 Key Features
• **Multi-Timeframe Structure**
* Monthly, Weekly, Daily, 4H, 1H, 30m, 15m, 1m analysis
* Hierarchical trend evaluation from macro → micro
• **Weighted Bias System**
* Assigns importance to each timeframe (customisable)
* Higher timeframes dominate overall market direction
* Produces a final **bullish / bearish bias score**
• **Triple Indicator Confirmation**
Each timeframe uses:
* ATR trend logic (volatility direction)
* Stochastic RSI (momentum confirmation)
* Moving Average filter (trend bias)
• **No Repainting Logic**
* Uses confirmed higher timeframe closes only
* Prevents false real-time signal shifts
* Ensures stable, reliable bias readings
• **Signal Threshold System**
* Custom X-signal trigger based on bias strength
* Highlights strong directional conviction zones
---
### 📊 How to Use
**Bullish Bias**
* Higher timeframes align bullish
* Weighted score exceeds threshold
→ Market favours long setups
**Bearish Bias**
* Higher timeframes align bearish
* Weighted score exceeds threshold
→ Market favours short setups
**Neutral / Mixed Bias**
* Conflicting multi-timeframe signals
→ Avoid directional trading or wait for alignment
---
### ⚠️ Best Practice
This is a **market context tool**, not a standalone entry system.
For best performance combine with:
* Liquidity zones
* Market structure (BOS / CHoCH)
* Support & resistance levels
* Entry triggers from lower timeframe setups
---
### 🚀 Ideal For
* Swing traders
* Position traders
* Smart money / structure-based trading
* Multi-timeframe confirmation strategies
* Crypto, Forex, indices
---
### 🧠 Trading Philosophy
**Higher timeframes define direction.
Lower timeframes define execution.
This tool bridges both into one bias model.**
---
**Trade with alignment, not randomness.** 지표

지표

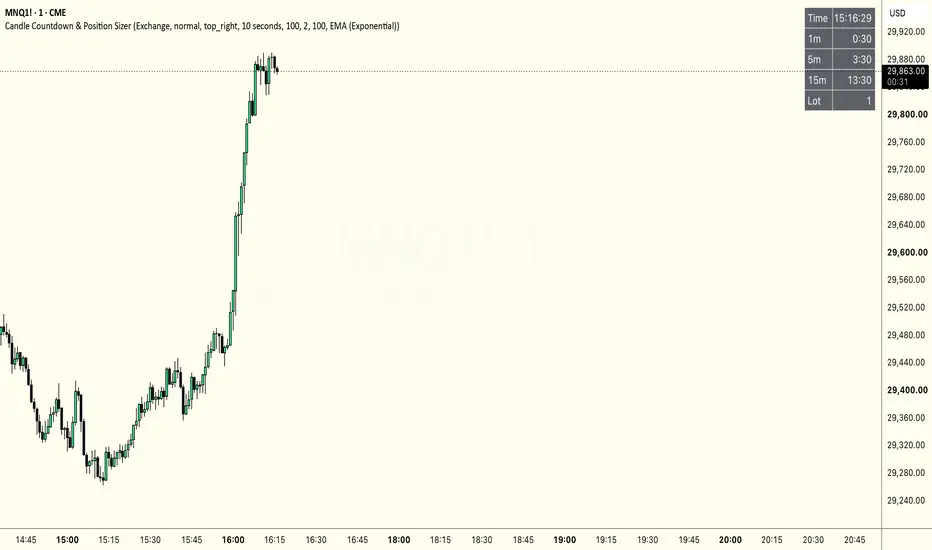
Candle Countdown & Position SizerCandle Countdown & Position Sizer
A compact on-chart table that keeps the two things a scalper checks most in one place: time and size.
It shows:
- Live clock with seconds, in the timezone you pick (Exchange, UTC, NY, London, Tokyo, Sydney).
- Countdown to the next 1m, 5m and 15m candle — so you always know how long the current bar has left. Each row turns to your chosen alert color in the final seconds before the candle closes.
- Suggested lot size based on ATR volatility, so your risk stays constant trade to trade.
How the sizing works
Tell it three things:
- how many dollars you're willing to lose on the trade,
- how wide your stop is, as a multiple of ATR (default 2× ATR),
- the ATR length and smoothing (Wilder or exponential — default EMA 100).
It computes the stop distance from current ATR and returns the lot size that caps your loss at that dollar amount if the stop is hit, rounded to a whole number. Flip on the debug toggle to also see the raw ATR and stop
distance behind the calculation.
Notes
- Updates arrive on price ticks, so during very quiet periods the clock may skip a second.
- Lot size uses the symbol's point value — always confirm it against your broker's contract specs before trading.
- Candle countdowns are anchored to UTC and are exact for intraday timeframes on 24h markets.
Not financial advice — a position-sizing aid. You are responsible for your own risk.
지표

지표

지표

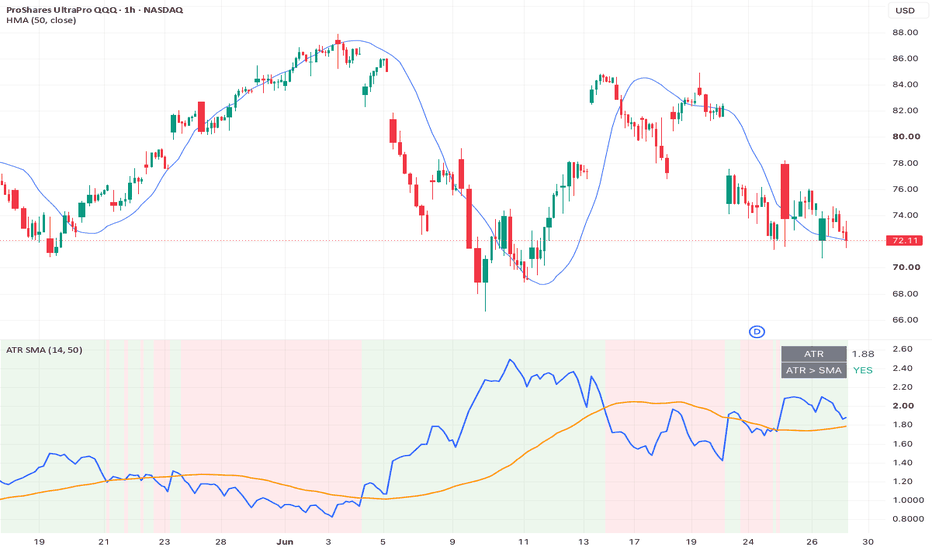
Average True Range PercentATRP expresses Average True Range as a percentage of price instead of an absolute value. Raw ATR is denominated in price, so it can't be used to compare volatility across instruments trading at different price levels — a $10 stock and a $400 stock will have very different ATR values even if they move by the same relative amount. Dividing ATR by close (×100) normalizes it into a percentage, making volatility comparable across any symbol, timeframe, or asset class.
How It's Calculated
True range is smoothed with a selectable moving average rather than a fixed method, so you can match the indicator's responsiveness to your own style.
Settings
ATR Lookback Period — number of bars used in the smoothing calculation (default 14).
ATR Smoothing — RMA, SMA, EMA, or WMA (default RMA, the classic Wilder smoothing used by standard ATR).
ATR Timeframe — calculate ATR on the chart's own timeframe, or pin it to a fixed timeframe (ticks, seconds, minutes, hours, days, weeks, or months) regardless of what chart resolution you're viewing. Useful for gauging a higher-timeframe's volatility while trading a lower one.
Wait for Timeframe Closes — only relevant when ATR Timeframe differs from the chart. Off: the value updates live with the still-forming higher-timeframe bar (can repaint on historical reloads). On: the value only updates once the selected timeframe's bar has actually closed (no repainting, one-bar lag).
지표

지표

3D: Real Smartphone Monitor Pro3D Real Smartphone Monitor Pro: Master Discipline and The Art of "No Position"
IMPORTANT: First-Time Setup and Size Adjustment
Because TradingView automatically scales the Y-axis (price) and X-axis (time) differently depending on the asset and your screen resolution, this 3D monitor may appear stretched, squashed, or incorrectly sized upon initial application. This is a standard limitation of projecting 3D elements onto 2D charts.
How to resolve this immediately:
Open the Indicator Settings.
Navigate to the "3D Manual Scaling & Camera Settings" group.
Adjust the "Y-Axis Scale (Height)" and "X-Axis Scale (Width)" sliders.
Tweak the "Master Scale Multiplier" until the smartphone perfectly fits your screen layout.
Note: Because the optimal scale varies entirely depending on the specific asset, we have provided comprehensive manual scale adjustment settings. If you find any parameters lacking or require further adjustments, please notify us in the comments, and we will respond promptly.
Concept: The Purpose of a Chart Smartphone
Trading is not solely about identifying entries; it is about mastering psychology. Overtrading is a trader's greatest adversary. This monitor serves as a visual anchor to ground you in reality and reinforce the power of discipline.
When compelled to force a trade, look at this monitor and read the scrolling proverbs. Remember that maintaining "no position" is a highly strategic position. Stepping away from the chart is frequently the most profitable decision you can make.
Features and Technical Synchronization:
Time Awareness: A built-in clock keeps you grounded in reality, preventing time distortion while analyzing charts.
Battery Level (RSI Sync): The battery percentage reflects the 14-period RSI, instantly indicating market exhaustion (oversold/overbought conditions).
Antenna Signal (ADX Sync): The signal bars represent the 14-period ADX. A full signal indicates a massive trend, while a weak signal suggests a flat market—ideal for determining whether to engage or step away.
Dynamic Interface: Designed with meticulous attention to realism, featuring titanium-style edges, glass glare, a dynamic top notch, and native emoji app icons.
Stay disciplined, protect your capital, and sometimes, just put the monitor down.
Pine Script Calculation Details
Calculation: int msg_idx = int(bar_index / 20) % 10
Mathematical Rationale: The bar_index (current candle number) is divided by 20 to create a trigger that changes the output every 20 bars. The modulo operator (% 10) ensures the resulting index loops sequentially from 0 to 9, which maps perfectly to the 10 proverb elements stored in the array.
Actual Output Values:
At bar_index 100: int(100 / 20) % 10 outputs 5 (Displays array element index 5).
At bar_index 110: int(110 / 20) % 10 outputs 5 (Message remains the same).
At bar_index 120: int(120 / 20) % 10 outputs 6 (Message switches to the next index). 지표

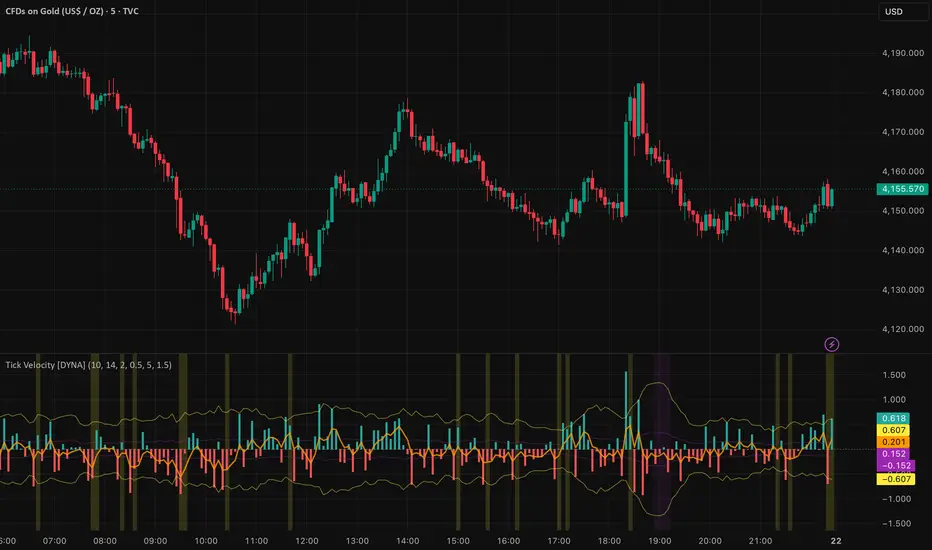
Tick Velocity [DYNA]Tick Velocity measures the speed of price movement on every bar, normalized by ATR and log-compressed so the reading works consistently across any instrument and any timeframe. Instead of asking "did price go up or down?" it asks "how fast did price move?" -- and that distinction makes all the difference when you need to spot momentum bursts and exhaustion in real time.
Most momentum tools tell you the direction of a move but not its intensity relative to normal conditions. A 50-point move on a major index means something very different during a quiet afternoon versus an opening-bell surge. Tick Velocity strips away that ambiguity by expressing every bar's price change as a multiple of recent volatility with log compression, giving you a clean, comparable speed reading that doesn't get crushed by outlier spikes.
Key Features
ATR-Normalized Velocity -- price change divided by ATR, so readings are comparable across instruments and timeframes without manual adjustment
Log-Compressed Scale -- extreme spikes are tamed so the histogram uses its full visual range, making normal-range momentum readable even after outlier moves
Signal Line -- a smoothed EMA overlay shows sustained momentum direction, filtering out bar-to-bar noise
Dynamic Spike Detection -- automatically identifies bars where velocity exceeds a configurable multiple of its recent average, with separate bullish and bearish alerts
Smart Exhaustion Detection -- flags fading momentum only after periods of genuine activity, so you don't get false exhaustion signals during quiet consolidation
Confirmed-Bar Logic -- all signals are evaluated on the completed bar, so what you see on the chart stays on the chart with no repainting
Clean Visual Design -- color-coded histogram with dynamic threshold lines and signal line makes it easy to read momentum state at a glance
How It Works
When you add Tick Velocity to your chart, a histogram appears in a separate pane below price. Each bar in the histogram represents the speed of that candle's price change: green bars mean price moved up, red bars mean price moved down, and the height of each bar shows how fast the move was. Log compression keeps the scale readable -- a massive gap-up spike won't flatten everything else into an invisible line.
An orange signal line (EMA) overlays the histogram, smoothing out bar-to-bar noise to show you the sustained momentum direction. When the signal line holds above zero, bulls are in control; when it dips below, bears are driving.
Two sets of threshold lines frame the histogram. The outer yellow lines mark the spike threshold -- when a bar pushes beyond these lines, price moved significantly faster than normal, indicating a momentum burst. The inner purple lines mark the exhaustion threshold -- when bars shrink inside these lines after a period of elevated activity, momentum is fading and the market may be pausing or preparing to reverse. The smart exhaustion gate ensures purple zones only appear after real momentum -- not during quiet consolidation.
Background shading reinforces these conditions. A yellow tint appears on confirmed spike bars, and a purple tint appears on confirmed exhaustion bars, making it easy to scan through the chart and see where momentum surged or faded.
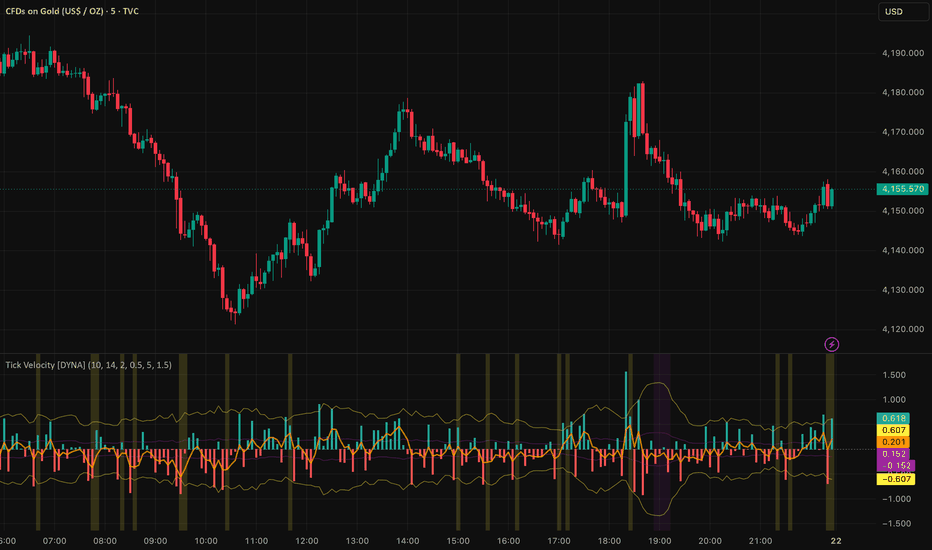
Tick Velocity histogram showing bullish and bearish velocity bars, with spike threshold lines (yellow) and exhaustion bands (purple). Background highlights mark confirmed spike and exhaustion events.
Settings
The core settings control sensitivity. The Velocity Lookback (default 10) determines how many bars are used to calculate the average velocity -- lower values make the indicator more responsive for scalping, higher values smooth it out for swing trading. The ATR Period (default 14) controls the normalization window. The Signal Smoothing (default 5) sets the EMA period for the orange signal line.
The Spike Multiplier (default 2.0) sets how far above average a bar must travel to count as a spike. Raise it to 2.5 or 3.0 if you only want the strongest bursts. The Exhaustion Multiplier (default 0.5) sets how far below average velocity must drop to flag exhaustion. The Exhaustion Gate Multiplier (default 1.5) ensures exhaustion only triggers when recent activity exceeds the longer-term baseline by this factor -- preventing false signals during quiet consolidation. Threshold lines, background highlights, and the signal line can each be toggled independently under Visual settings.
Alerts
Bullish Velocity Spike -- fires when upward velocity exceeds the spike threshold on a confirmed bar. Message: "Bullish velocity spike -- strong upward momentum burst."
Bearish Velocity Spike -- fires when downward velocity exceeds the spike threshold on a confirmed bar. Message: "Bearish velocity spike -- strong downward momentum burst."
Velocity Exhaustion -- fires when velocity drops below the exhaustion threshold after a period of elevated activity. Message: "Tick Velocity exhaustion detected -- momentum fading after active period, possible pause or reversal."
To set up alerts: click the TradingView Alerts button, select "Tick Velocity " from the indicator dropdown, choose "Any alert() function call" as the condition, and set your preferred notification method.
Best Practices
Use velocity spikes at key support and resistance levels to confirm breakouts -- a spike adds conviction that the level break is real
Watch for exhaustion signals after extended trends to time profit-taking or tighten stop-loss placement
Combine with volume indicators for added confirmation -- a velocity spike on high volume is more meaningful than one on thin volume
Adjust the lookback period to match your trading style: 5-7 for scalping, 10-15 for intraday, 20+ for swing trading
On lower timeframes (1-3 minute), consider raising the spike multiplier to reduce noise from normal market fluctuations
Part of the DYNA Ecosystem
Tick Velocity is a free indicator built with the same design standards as the DYNA premium suite. For complete trade management with automatic stop loss, break-even, trailing stops, and multi-target systems, explore the full DYNA indicator collection.
Disclaimer
This indicator is a technical analysis and educational tool only -- it is not financial advice and makes no guarantee of any outcome. Past performance does not predict future results. Always do your own research and use proper position sizing and risk management.
Created by Varun Nidhi · varunnidhi.com
A free DYNA indicator — self-contained, no repainting.
지표
Spread Compression Alert [DYNA]Markets don't move in straight lines -- they alternate between periods of compression and expansion. Spread Compression Alert detects when candle ranges shrink to unusually low levels, warning you that a sharp move is building beneath the surface. Instead of reacting after a breakout has already happened, you can position yourself before it begins.
Most traders miss the quiet before the storm. They stare at flat price action and look away, only to catch the tail end of a big move. This indicator solves that problem by continuously comparing short-term volatility to its longer-term baseline and flagging the exact moments when the market is coiling tightest -- right when you should be paying the most attention.
Key Features
ATR Compression Ratio -- Compares fast ATR to slow ATR to objectively measure how compressed current price action is relative to normal conditions
Diamond Markers -- Small orange diamonds appear above each compressed bar, giving you an instant visual scan of where the market is tightening
Cluster Detection -- When multiple consecutive bars are compressed, the background highlights orange, signaling that expansion pressure is building to extreme levels
Confirmed-Bar Logic -- All signals are calculated on confirmed (closed) bars, so markers never appear and disappear mid-bar
How It Works
As you watch a chart, you will notice small orange diamond markers appearing above certain bars. Each diamond indicates that the bar's range is significantly smaller than the recent average -- the market is compressing. A single diamond is worth noting but not necessarily actionable.
When diamonds appear on several consecutive bars, the background turns a soft orange. This is the cluster highlight, and it tells you the market has been compressing for an extended period. Many traders study these clusters as periods of consolidation that can precede a range expansion. The longer the compression lasts, the more notable the eventual breakout in range can be.
Orange diamonds mark individual compressed bars. The background highlight appears when consecutive compressed bars reach the threshold, flagging an extended period of compression.
Settings
The indicator works out of the box with sensible defaults. The Fast ATR Length (default 5) measures recent candle ranges, while the Slow ATR Length (default 50) establishes the normal volatility baseline. The Compression Ratio (default 0.6) sets how tight the range must get before flagging compression -- lower values require more extreme compression. The Consecutive Bar Threshold (default 3) controls how many compressed bars in a row trigger the cluster highlight and extreme compression alert.
For lower timeframes like 1-5 minute charts, you may want to reduce the Slow ATR Length to 30 so the baseline adapts faster. For stricter signals on any timeframe, try lowering the Compression Ratio to 0.3.
Alerts
Compression Detected -- Fires when a single compressed bar is confirmed. Message: "Spread Compression Alert : Candle range compression detected. ATR ratio dropped below threshold -- watch for expansion."
Extreme Compression -- Fires when consecutive compressed bars reach the threshold. Message: "Spread Compression Alert : Extreme compression -- multiple consecutive compressed bars. Expansion is imminent."
To set up alerts: click the TradingView Alerts button, select "Spread Compression Alert " from the indicator dropdown, choose "Any alert() function call" as the condition, and set your preferred notification method.
Best Practices
Compression tells you when a move is coming, not which direction. Pair this indicator with a trend or momentum tool for directional bias.
Compression clusters near key support or resistance levels tend to produce the most tradeable breakouts.
This indicator is especially useful before scheduled news events or market opens, when volatility is temporarily suppressed.
On higher timeframes (4H, Daily), compression signals can indicate multi-day consolidation patterns worth monitoring for swing entries.
Part of the DYNA Ecosystem
Spread Compression Alert is a free indicator built with the same design standards as the DYNA premium suite. For complete trade management with automatic stop loss, break-even, trailing stops, and multi-target systems, explore the full DYNA indicator collection.
Disclaimer
This indicator is a technical analysis and educational tool only -- it is not financial advice and makes no guarantee of any outcome. Past performance does not predict future results. Always do your own research and use proper position sizing and risk management.
Created by Varun Nidhi · varunnidhi.com
A free DYNA indicator — self-contained, no repainting.
지표

Scalper's Moving Average [DYNA]Scalper's Moving Average is an adaptive overlay line that automatically adjusts its speed based on market conditions. In trending markets it tracks price closely, keeping you in the move. In choppy, sideways markets it flattens out, filtering noise and keeping you from getting whipsawed. It is built on the Kaufman Adaptive Moving Average (KAMA) algorithm, tuned specifically for 1-5 minute scalping charts.
Most moving averages force you to choose between speed and smoothness. A fast MA gives early signals but generates constant false flips in chop. A slow MA filters noise but lags behind real moves, costing you ticks on every entry. Scalper's Moving Average solves this tradeoff by measuring how efficiently price is moving and adjusting its responsiveness in real time.
Key Features
Adaptive Speed -- Automatically speeds up when price is trending and slows down when the market is chopping, so you get one line that does the work of two
Slope Color Coding -- The KAMA line changes color based on its slope direction: teal for rising, red for falling, gray for flat. Instant visual read of trend bias
Distance Fill -- Optional shaded area between price and KAMA shows how far price has stretched from its adaptive mean, helping you spot overextension and pullback entries
Slope Flip Markers -- Small triangle markers appear on the chart when the KAMA slope changes direction, flagging potential trend shifts at a glance. An ATR-based filter and cooldown system suppress noise flips in choppy markets
No Repainting -- Slope flip signals use confirmed-bar logic and will not change once printed
How It Works
When you add the indicator to your chart, you will see a single colored line overlaid on your candles. This is the KAMA line. Unlike a standard EMA or SMA, it does not move at a fixed speed. Instead, it calculates an efficiency ratio on every bar -- comparing how far price has moved in one direction versus how much total back-and-forth movement occurred. When that ratio is high (strong trend), the line speeds up and hugs price closely. When the ratio is low (chop), the line barely moves.
The line color tells you the current slope direction at a glance. A teal line means KAMA is rising and momentum favors the bulls. A red line means KAMA is falling and momentum favors the bears. A gray line means the slope is flat and the market has no clear direction -- a signal to stay patient.
When the slope changes direction, a small triangle marker appears directly on the KAMA line. An "UP" triangle marks a bullish flip, and a "DN" triangle marks a bearish flip. These transitions are the earliest indication that the adaptive trend bias has shifted. To keep the chart clean, flips are filtered by an ATR-scaled minimum slope threshold -- tiny wiggles in chop are ignored -- and a cooldown period prevents rapid-fire labels from stacking up.
KAMA line hugging price tightly during a trending move, with distance fill showing the stretch between price and the adaptive average.
Distance Fill
The optional distance fill shades the area between the close price and the KAMA line. When price is above KAMA the fill is teal; when below, the fill is red. When price is hugging KAMA closely (within the dead-zone threshold), the fill turns neutral gray, giving you an instant visual cue that the market is chopping and there is no meaningful stretch to trade. The width of the colored fill tells you how far price has stretched from its adaptive mean. A wide fill suggests the move may be overextended -- not the ideal time to chase. A narrowing fill as price pulls back toward KAMA can highlight better entry zones where risk-to-reward improves.
Distance fill expanding during a strong move, then narrowing as price pulls back to KAMA -- a potential re-entry zone.
Settings
The core settings control the KAMA calculation. KAMA Length (default 10) sets the lookback window for the efficiency ratio -- lower values make the line more reactive, higher values smooth it out. Fast Constant (default 2) determines the fastest the line can move when the trend is strong. Slow Constant (default 30) determines how sluggish the line becomes in chop. The defaults are tuned for 1-3 minute charts and work well for most scalping scenarios.
The flip filter settings control label quality. Min Slope (ATR %) (default 0.15) sets the minimum slope magnitude as a fraction of ATR -- raise it to filter out more noise flips in choppy conditions. Cooldown Bars (default 5) enforces a minimum gap between flip labels, preventing clusters of rapid UP/DN markers. Both settings also define the neutral dead-zone for slope coloring and fill.
Under visual settings, you can toggle the distance fill on or off and adjust the KAMA line thickness.
Alerts
Slope Flip Bullish -- Fires when the KAMA slope turns from flat or falling to rising. Message: "Scalper's Moving Average : KAMA slope flipped bullish. Trend may be turning up."
Slope Flip Bearish -- Fires when the KAMA slope turns from flat or rising to falling. Message: "Scalper's Moving Average : KAMA slope flipped bearish. Trend may be turning down."
To set up alerts: click the TradingView Alerts button, select "Scalper's Moving Average " from the indicator dropdown, choose "Any alert() function call" as the condition, and set your preferred notification method.
Best Practices
Start with the default 10/2/30 settings on 1-3 minute charts before making adjustments
When the KAMA line is flat and gray, avoid trend-following trades -- the market is chopping
Use the distance fill to time entries: enter on pullbacks toward KAMA rather than chasing extended moves
Combine slope flip signals with volume or support/resistance levels for higher-confidence entries
If trading 5-minute charts, consider increasing KAMA Length to 14 or 20 for smoother signals
Part of the DYNA Ecosystem
Scalper's Moving Average is a free indicator built with the same design standards as the DYNA premium suite. For complete trade management with automatic stop loss, break-even, trailing stops, and multi-target systems, explore the full DYNA indicator collection.
Disclaimer
This indicator is a technical analysis and educational tool only -- it is not financial advice and makes no guarantee of any outcome. Past performance does not predict future results. Always do your own research and use proper position sizing and risk management.
Created by Varun Nidhi · varunnidhi.com
A free DYNA indicator — self-contained, no repainting.
지표

Range Box Scalper [DYNA]Range Box Scalper detects when price compresses into a tight consolidation zone and visually draws a box around it in real time. When price breaks out of the box with above-average volume, the indicator marks the exact breakout bar with a directional arrow, so you can act on the expansion move without second-guessing the setup.
Most traders know that consolidation leads to expansion, but spotting the range in real time and confirming the breakout with volume is tedious manual work. Range Box Scalper automates the entire process: it watches for price to stay within an ATR-defined corridor for a minimum number of bars, draws the consolidation zone as a visible box on the chart, and then waits for a decisive close outside the box backed by strong volume before signaling the breakout.
Key Features
Automatic Range Detection -- Identifies consolidation zones based on ATR-calibrated price width and minimum bar count. No manual drawing required.
Live Box Drawing -- Shaded boxes appear and extend in real time as price continues to range, giving you a clear visual boundary to watch.
Volume-Confirmed Breakouts -- Breakout arrows only appear when volume exceeds a configurable multiple of the 20-bar average, filtering out weak, low-conviction exits.
Breakout Strength Filter -- Requires the breakout candle to close a minimum distance (ATR-based) beyond the range boundary, eliminating marginal breakouts.
Built-in Trend Filter -- Optional EMA-based trend filter ensures breakouts only fire in the direction of the prevailing trend, so you can focus on with-trend setups.
Directional Breakout Arrows -- Green upward triangles for bullish breakouts, red downward triangles for bearish breakouts, placed right at the breakout bar.
No Repainting -- All signals use confirmed-bar logic. Once a box or arrow appears, it stays.
How It Works
As price action unfolds, Range Box Scalper continuously monitors whether recent bars are staying within a narrow corridor. The corridor width is derived from ATR, so it automatically adapts to the volatility of whatever instrument you are trading. When price stays inside this corridor for your configured minimum number of bars, a shaded gray box appears on the chart marking the consolidation zone. You will also see a small orange diamond labeled "Range" on the bar where the consolidation is first confirmed.
The box continues to extend to the right as long as price remains inside the boundaries. The moment price closes decisively outside the box and the breakout bar carries above-average volume, the indicator marks the breakout with a colored arrow: a green triangle below the bar for a bullish breakout, or a red triangle above the bar for a bearish breakout. The box border also changes color to match the breakout direction, giving you a quick historical reference for which zones broke which way.
If price drifts out of the range on weak volume, no breakout signal fires. The indicator simply resets and begins looking for the next consolidation. This volume filter is what separates genuine expansion moves from false exits that quickly reverse.
A consolidation box forming over several bars, followed by a bullish breakout arrow when price closes above the range with strong volume.
Settings
The core settings control how the indicator defines a consolidation zone. Min Range Bars (default: 6) sets how long price must stay compressed before a box is drawn -- lower values on fast timeframes, higher values on daily charts. ATR Multiplier (default: 1.5) controls the maximum allowed range width relative to ATR; lower values mean tighter, more compressed boxes, while higher values detect more consolidation zones. Volume Confirmation (default: 1.2x) sets the volume threshold for breakout signals; increase this if you want only the strongest breakouts.
Min Breakout Strength (default: 0.1x ATR) requires the breakout candle to close at least this distance beyond the range boundary, filtering out marginal breakouts that barely clear the box edge. The Trend Filter (default: off, EMA 50) optionally restricts breakouts to the trend direction -- bullish breakouts only fire above the EMA, bearish breakouts only below. Enable this if you want to filter counter-trend setups.
Visual toggles let you show or hide the consolidation boxes and breakout arrows independently. Each alert type can also be toggled on or off.
Alerts
Consolidation Forming -- Fires when price has ranged for the minimum number of bars and a new consolidation zone is confirmed. "Range Box Scalper: Consolidation zone detected. Price is ranging in a tight range."
Breakout Up -- Fires when price closes above the consolidation box with volume confirmation. "Range Box Scalper: Bullish breakout from consolidation zone with volume confirmation."
Breakout Down -- Fires when price closes below the consolidation box with volume confirmation. "Range Box Scalper: Bearish breakout from consolidation zone with volume confirmation."
To set up alerts: click the TradingView Alerts button, select "Range Box Scalper " from the indicator dropdown, choose "Any alert() function call" as the condition, and set your preferred notification method.
Best Practices
On lower timeframes (1m-5m), reduce Min Range Bars to 5-6 to catch shorter consolidation periods that match the faster price action.
On higher timeframes (4H and above), increase Min Range Bars to 12-15 so only significant consolidation zones are flagged.
Increase the Volume Confirmation multiplier or Min Breakout Strength if you are getting too many signals -- this ensures only the strongest breakouts are marked.
The built-in trend filter (EMA 50) ensures breakouts align with the prevailing trend. Disable it if you want to trade counter-trend setups.
After a breakout, the box boundaries (top and bottom) often act as support or resistance on a retest.
Part of the DYNA Ecosystem
Range Box Scalper is a free indicator built with the same design standards as the DYNA premium suite. For complete trade management with automatic stop loss, break-even, trailing stops, and multi-target systems, explore the full DYNA indicator collection.
Disclaimer
This indicator is a technical analysis and educational tool only -- it is not financial advice and makes no guarantee of any outcome. Past performance does not predict future results. Always do your own research and use proper position sizing and risk management.
Created by Varun Nidhi · varunnidhi.com
A free DYNA indicator — self-contained, no repainting.
지표

Micro Support Resistance [DYNA]Micro Support Resistance automatically identifies the most important short-term support and resistance levels on your chart. It finds swing highs and swing lows, clusters nearby price reactions together, and draws clean horizontal lines where price is most likely to react next.
Most traders draw support and resistance by hand, which is slow and subjective. This indicator does it for you in real time, updating as new pivots form. It also shows you which levels are strongest -- thicker lines mean more touches, so you can instantly tell the difference between a fresh untested level and a well-established zone that price has bounced off multiple times. When price breaks through a level, the indicator automatically removes it so only active, relevant zones remain on your chart.
Key Features
Automatic Pivot Detection -- Identifies swing highs and swing lows using a configurable lookback window, so levels are always based on actual price structure
Smart Clustering -- Merges nearby levels within an ATR-based threshold into a single zone, avoiding cluttered charts with redundant lines
Touch Count Visualization -- Line thickness grows with each touch, giving you an instant read on level strength without any interpretation
Automatic Level Invalidation -- When price closes through a support or resistance level, it is removed from the chart. No stale or broken levels cluttering your view
Distance-Based Decay -- Levels that drift too far from current price automatically lose touches and eventually disappear, keeping all level slots focused on actionable zones near price
Dynamic Level Management -- Keeps only the strongest levels on screen. When new pivots form, weak untested levels are replaced automatically
First-Approach Alerts -- Get notified the moment price first reaches a key level, not on every bar it stays nearby
Data Export -- All level values appear in the TradingView data window and are included in CSV exports for further analysis
How It Works
As price moves across your chart, the indicator continuously scans for swing highs and swing lows on confirmed bars. When it detects a confirmed pivot -- a point where price reversed direction with bars on both sides confirming the swing -- it checks whether this level is near any existing support or resistance zone. If it is, the existing level absorbs the new touch and its line gets thicker. If not, a new level is drawn. When price closes through a level decisively, that level is automatically invalidated and removed.
Green lines mark support zones where price has bounced upward. Red lines mark resistance zones where price has been rejected downward. Each line carries a small label showing its level number and touch count -- for example, "S1 (3)" is the first support level with three touches, and "R2 (1)" is the second resistance level with a single touch. Thicker lines correspond to higher touch counts, so a bold line with "S1 (4)" is a well-tested support, while a thin line with "R3 (1)" is a fresh, untested resistance. If a green line disappears, it means price closed below that support and the level is no longer valid.
Micro Support Resistance on a 3-minute chart. Green support lines and red resistance lines are drawn automatically, with thicker lines indicating more touches.
Line Thickness and Level Strength
The visual weight of each line tells you how significant the level is. One touch produces a thin hairline. Two touches make it slightly thicker. Three or four touches produce a bold, unmistakable line that commands attention. This means you never need to count bounces or remember which levels have been tested -- the chart shows you directly.
When the maximum number of levels is reached on either side (support or resistance), the indicator automatically removes the weakest level to make room for a new one. Levels that have been broken through -- where price has closed on the other side -- are also removed automatically. This keeps your chart clean and focused on the levels that actually matter right now.
Notice the difference in line thickness: S2 (3) is a thick, well-tested support, while R1 (1) is a thin single-touch resistance.
Settings
The default settings work well for most intraday charts on the 1-minute to 15-minute timeframe. The Pivot Lookback controls how many bars on each side are required to confirm a swing -- the default of 5 captures short-term micro-structure. Increase it to 7 or 10 for slightly broader levels on 30-minute or 1-hour charts.
The Cluster Threshold determines how close two levels need to be before they are merged into one. It uses a multiple of the 14-period ATR, so it automatically adapts to different instruments and volatility conditions. The default of 0.5 provides a good balance between merging nearby levels and keeping distinct zones separate. Lower it if you want finer granularity; raise it if you see too many lines stacked close together.
Max Levels Per Side caps how many support and resistance lines appear at once. The default of 3 keeps the chart clean. You can increase it up to 10 if you want to see more of the price structure.
The Decay Distance setting controls how far a level can be from price before it starts losing relevance. Levels beyond this ATR multiple lose one touch per confirmed bar. Once a level's touches reach zero, it is removed and the slot opens up for a fresh nearby level. The default of 10x ATR keeps levels focused on the current trading range while ensuring slots stay populated. Increase it if you want levels to persist longer on swing or position trades.
Alerts
Approaching Support -- Fires once when price first comes within a configurable percentage of a support level. Does not repeat while price remains in the approach zone. "Micro Support Resistance : Price is approaching a support level. Watch for a potential bounce or breakdown."
Approaching Resistance -- Fires once when price first comes within a configurable percentage of a resistance level. Does not repeat while price remains in the approach zone. "Micro Support Resistance : Price is approaching a resistance level. Watch for a potential rejection or breakout."
To set up alerts: click the TradingView Alerts button, select "Micro Support Resistance " from the indicator dropdown, choose "Any alert() function call" as the condition, and set your preferred notification method.
Best Practices
Use on lower timeframes (1m to 15m) for scalping and intraday setups. The levels are designed to capture micro-structure, not weekly zones.
Pay attention to thick lines -- levels with 3 or more touches tend to produce stronger reactions when retested.
Combine with a momentum or volume indicator to judge whether a level will hold or break.
If your chart looks too busy, reduce Max Levels Per Side or increase the Cluster Threshold to merge nearby zones.
Set approach alerts so you can step away from the screen and still catch the moments that matter.
Part of the DYNA Ecosystem
Micro Support Resistance is a free indicator built with the same design standards as the DYNA premium suite. For complete trade management with automatic stop loss, break-even, trailing stops, and multi-target systems, explore the full DYNA indicator collection.
Disclaimer
This indicator is a technical analysis and educational tool only -- it is not financial advice and makes no guarantee of any outcome. Past performance does not predict future results. Always do your own research and use proper position sizing and risk management.
Created by Varun Nidhi · varunnidhi.com
A free DYNA indicator — self-contained, no repainting.
지표