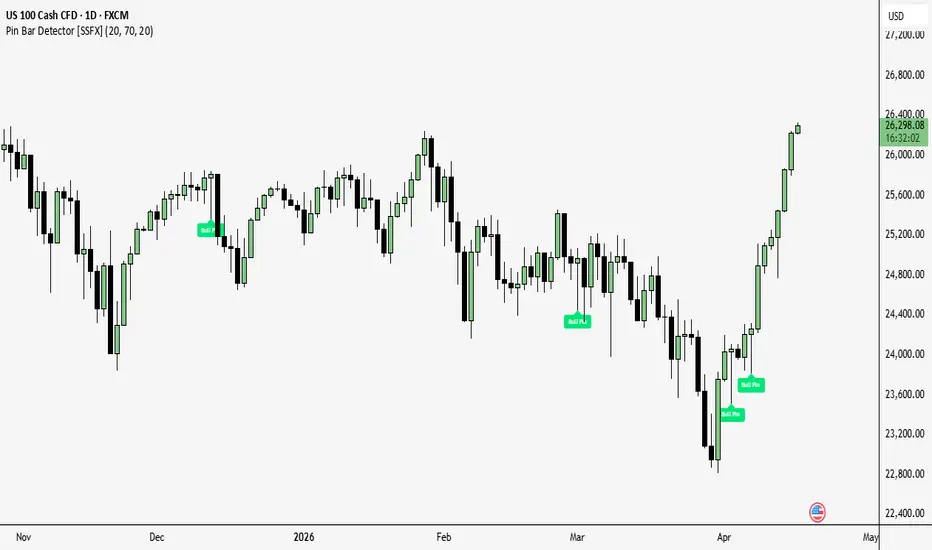
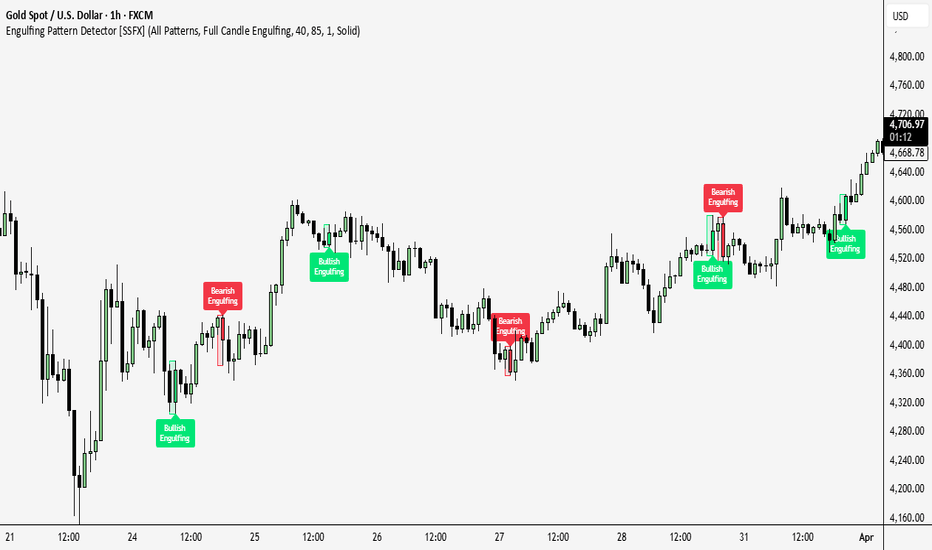
Engulfing Pattern Detector [SSFX]Engulfing Pattern Detector is candlestick analysis indicator designed to detect and highlight bullish and bearish engulfing patterns directly on the price chart.
The indicator focuses on two-candle engulfing formations. A bullish engulfing pattern is identified when the current bullish candle engulfs the previous bearish candle based on the selected engulfing method. A bearish engulfing pattern is identified when the current bearish candle engulfs the previous bullish candle based on the selected engulfing method.
The script provides two engulfing detection modes:
Body Engulfing: This mode checks whether the body of the current candle covers the body of the previous candle.
Full Candle Engulfing: This stricter mode checks whether the current candle also covers the full high-low range of the previous candle, in addition to meeting the body engulfing condition.
To reduce weak or unclear signals, the indicator includes a minimum body percentage filter. This allows users to require the current engulfing candle to have a minimum body size relative to its total candle range. This can help avoid candles with very small bodies or excessive wicks.
Key Features:
Detects bullish engulfing patterns
Detects bearish engulfing patterns
Option to display all patterns or only bullish/bearish patterns
Option to require opposite candle colors
Body engulfing and full candle engulfing modes
Minimum body percentage filter
Box highlight around the two-candle engulfing formation
Optional labels
Optional candle coloring
Optional background highlight
Custom bullish and bearish colors
Alert conditions for bullish, bearish, and any engulfing signal
How to Use:
Bullish engulfing patterns may be used as a visual clue that buying pressure is increasing after a prior bearish candle. Bearish engulfing patterns may be used as a visual clue that selling pressure is increasing after a prior bullish candle.
The box highlight is drawn around the full two-candle pattern, making it easier to visually identify where the engulfing structure occurred. Green boxes represent bullish engulfing formations, while red boxes represent bearish engulfing formations.
This indicator is intended to be used as a visual candlestick pattern tool. It does not predict future price movement and should not be used as a standalone trading system. Users may combine the signals with their own market structure, support and resistance, trend, volume, or risk management analysis.
Alerts:
The script includes alert conditions for:
Bullish Engulfing Detected
Bearish Engulfing Detected
Any Engulfing Pattern Detected
These alerts can be used to notify users when a new engulfing pattern appears on the chart.
지표
Shark Hunt | AnonycryptousShark Hunt | Anonycryptous
Description & user manual
(Some chart snapshots below)
Why makes this indicator different?
Most liquidity indicators show you levels. They draw a box where a swing high or low formed and wait for price to return. They do not tell you whether the return matters. They do not filter what is noise from what is a genuine institutional event. They do not confirm whether the move that touched the level was a stop hunt or just a graze. They show you where. Not what.
Shark Hunt works differently.
It does not just detect liquidity zones. It hunts what happens at them — mechanically, bar by bar, through a multi-layer confirmation engine that evaluates wick penetration, volume, rejection strength, and optional pattern confluence before a signal fires. Every condition has a purpose. Every filter reflects something that institutional order flow actually leaves behind.
Most traders can look at a chart in hindsight and spot a liquidity sweep. They see the wick, they see the reversal, they understand what happened. The challenge is identifying it as it forms, before the move is over. That is what Shark Hunt is built to do.
And then there is the Failure Entry engine.
Not every meaningful institutional move starts at a marked zone. Sometimes price sweeps a structural pivot mid-chart — no zone, no prior markup — and reverses sharply. These are swing failure patterns: a wick through a recent high or low, a close back inside, and the market moving the other way. Shark Hunt includes a complete standalone engine for detecting and trading these setups, with its own signal system, trade block, and performance tracking. It is an indicator within an indicator. When you enable it, the entire color scheme shifts to make the mode change unmistakable.
Most indicators are built for one idea. Shark Hunt is built for two ways of reading the same market — and it tells you clearly which mode you are in.
Important notice
Shark Hunt generates trading signals based on pattern detection and volume analysis.
These signals are not financial advice.
They do not predict the future.
They do not guarantee profitability.
All trading decisions are made entirely by the user.
Always manage your own risk. Always apply your own judgment.
1. Overview
Shark Hunt is a liquidity zone detection and sweep confirmation indicator built around the behavior of institutional participants — how they build positions, how they run stops, and how that activity shows up on a chart.
What it includes:
- Impulse-scored liquidity zone detection at swing highs and lows
- Three-tier zone significance: scalp, intermediate, and major
- Multi-layer sweep confirmation: wick penetration, volume, rejection, and pattern gates
- Zone flip logic: broken support becomes resistance and vice versa
- Zone hold statistics with percentage display and liquidity value per zone
- Five price pattern detections: imbalances, absorption bars, price failures, level break retests, and wick traps
- Trade block visualization with configurable RR ratio, SL mode, and width
- Failure Entry engine: standalone SFP signal system with independent settings and trade blocks
- Sweep and failure mode color switching: fluor green/red for zone mode, fluor cyan/red for failure mode
- Neon glow rendering for both candles and zones: independently configurable
- Live dashboard showing active mode, zones, trade statistics, and PnL in R
- Alerts for zone sweep longs, zone sweep shorts, failure longs, and failure shorts
2. How zones are built
Shark Hunt detects liquidity pools at confirmed swing highs and lows using a pivot-based engine. Every zone is scored at the moment of formation using a composite impulse quality score — a weighted combination of body strength, volume relative to average, and bar range relative to ATR. Higher scores mean the move away from the zone was more decisive. When two zones form too close together, the weaker one is removed. Only the more significant level survives.
Zone significance is configurable in three modes:
-Scalp
Short pivot lookback. More zones formed, closer to current price. Suited for fast timeframes and intraday scalp setups.
-Intermediate
Balanced detection. A practical default across most instruments and timeframes.
-Major
Extended pivot lookback. Only the most significant structural levels qualify. Fewer zones, higher conviction per zone.
Each zone extends to the right in real time. A stats label shows the percentage of touches where price held without sweeping — the hold rate — and the estimated liquidity value at the formation bar, calculated as volume multiplied by price. These two numbers tell you how historically respected a zone is and how much institutional interest was present when it formed.
When price closes decisively through a zone, the zone flip logic converts it to the opposite side. A broken demand zone becomes supply. A broken supply zone becomes demand. This mirrors how smart money re-uses levels.
3. Sweep confirmation
A sweep fires only when all enabled conditions are satisfied on the same bar at close.
Wick penetration
The wick must break through the zone boundary by at least a configurable percentage of price. This filters grazes from genuine stop hunts. At 0.05%, small but intentional penetrations qualify. At 0.2% and above, only decisive spikes are counted.
Volume confirmation
The sweep bar must have volume at or above a configurable multiple of the rolling average. Institutional sweeps require size to move price and collect stops. A sweep on below-average volume is usually noise. This filter is toggleable.
Wick rejection
The wick that swept the zone must represent a minimum percentage of the bar's total range. A high rejection percentage means the bar closed far from its sweep extreme — price was pushed back hard. A low percentage means price drifted through and kept going. This filter is toggleable.
Pattern confirmation gates
Three optional gates can be added on top of the base sweep conditions:
- Require Price Failure (SFP): the sweep bar must also close back inside a recent pivot. Stop hunt confirmed by structure.
- Require Wick Trap: the sweeping wick must be at least twice the body size and larger than half an ATR. Pin-bar quality required.
- Require Absorption Bar: the sweep bar must fully engulf the previous candle. One-sided institutional commitment on the sweep itself.
Each gate is independent. Any combination can be active simultaneously. When all three are off, the base filters apply. When one or more are on, they stack as AND conditions — all must pass.
A cooldown setting prevents duplicate signals on the same level by requiring a minimum number of bars between confirmed sweeps.
When a sweep confirms, the zone is marked as swept and fades. A trade block is drawn showing the SL zone and TP zone based on the configured stop loss mode and RR ratio.
4. Price patterns
Five independent price pattern detections run continuously alongside the zone engine. Each can be toggled on or off.
-Price imbalances
Three-candle gaps where price moved too fast for two-sided trading. The gap between the first and third candle is visible as a small filled box. These areas act as magnets — price tends to return. A bull imbalance forms when a bullish candle leaves a gap above. A bear imbalance forms the same way in the opposite direction.
-Absorption bars
A candle that fully engulfs the previous candle in body. The current bar opened inside the prior bar's body and closed beyond it on the opposite side. This shows one side overpowering the other in a single bar — a sign of directional commitment. Marked with a small dot above or below the bar.
-Price failures
A bar that breaks a recent swing pivot with its wick but closes back inside. The market attempted a breakout, ran the stops beyond the pivot, then reversed. This is the mechanical signature of an institutional stop hunt at a structural level. Marked with a clean "F" label in bull or bear color.
-Level break and retest
When price closes through a recent pivot level and then returns to test it from the other side, a retest marker fires. Broken resistance retested as support, and vice versa. The cross marker appears at the retest bar.
-Wick traps
Candles with a wick at least twice the body size and larger than half an ATR. These mark areas of strong rejection. When a wick trap appears at or near a zone, it adds weight to the setup. Marked with a directional arrow.
5. Trade block
When a zone sweep confirms, a trade block is drawn from the signal bar forward. It shows the SL zone in red and the TP zone above or below entry.
Two stop loss modes are available:
-Zone mode
The stop is placed at the zone boundary plus a configurable ATR buffer. Consistent across setups — the SL is anchored to the structural level that defined the zone.
-Wick mode
The stop is placed at the deepest point of the sweep wick plus a configurable ATR buffer. Tighter, and closer to the actual sweep extreme. Can vary significantly bar to bar depending on wick size.
The RR ratio scales the TP distance as a multiple of the SL distance. At 1.0, TP equals SL distance — a 1:1 setup. At 2.0, TP is twice the SL distance. The trade block width in bars is configurable.
The backtest engine runs alongside the live chart. Every confirmed signal is tracked. When TP or SL is reached, the result is recorded as positive or negative R and accumulated in the dashboard.
6. Dashboard
The dashboard is displayed in a configurable position at tiny, small, or normal size.
It shows:
- Active mode: Sweep — on or off. Failure — on or off. Immediately visible at a glance.
- Depth: the current zone significance setting.
- Bull liquidity: number of active bull zones, with fresh zone count.
- Bear liquidity: same for bear zones.
- ATR: current ATR value for the active calculation period.
- Trades, longs, shorts, wins, losses, win rate: cumulative signal statistics.
- Total PnL in R: cumulative result across all signals.
- Expected value in R: average result per trade.
Mode colors are active throughout. In zone sweep mode, bull elements appear in fluor green. In failure entry mode, everything bull switches to fluor cyan. Bear elements remain in fluor red in both modes. The mode switch is visible across every element on the chart — zones, candles, markers, trade blocks, and the dashboard simultaneously.
7. Neon glow
Two independent glow systems are available under the Visuals section.
Neon glow candles
Three stacked plotcandle layers render the candles in fluor color with a soft outer glow. Body transparency and wick and border transparency are separately adjustable — softer body, harder wicks gives the most readable result. Two glow layers control the diffuse outer glow and the inner primary glow independently.
For best results: open chart settings, go to the Style tab, and set the default candle body, border, and wick to fully transparent. This removes the standard TradingView candle rendering and lets only the glow candles show.
Neon glow zones
Four stacked box layers per zone produce a layered neon glow from the zone boundary outward. A single Zone Glow Strength slider controls all layers simultaneously — lower values produce a more intense neon effect, higher values produce a softer ambient glow.
Both systems work in both modes. When failure entry mode is active, the glow shifts to fluor cyan for all bull elements.
8. ⚡ The Failure Entry engine — the Bonus 🦈
Zone sweeps are the core of Shark Hunt. But not every institutional move starts at a marked level.
Sometimes price sweeps a structural pivot that has no zone drawn on it — a recent swing high or low that formed mid-session, between established zones. The move is decisive: a wick beyond the pivot, a close back inside, and price accelerating in the opposite direction. These are swing failure patterns. They are one of the cleanest institutional signatures available — a stop hunt at a structural level, confirmed by the bar's own price action.
The Failure Entry engine is a fully independent system inside Shark Hunt, built specifically to detect and trade these setups.
When Failure Entry mode is enabled, the zone sweep signal system is suspended. Zones remain on the chart as structural context — they often align with logical TP levels for failure trades. But entries come only from the failure engine.
The failure engine uses its own pivot lookback, separate from the zone detection engine. A dedicated wick size filter measured in ATR is the primary quality gate — it controls how large the failure wick must be relative to current volatility. Small values allow minor structural failures. Larger values require significant spike reversals. This is the primary lever for tightening or loosening signal quality.
A separate wick rejection percentage filter ensures the sweep bar closed convincingly away from its extreme. Volume confirmation with its own multiplier can be applied independently. A cooldown prevents duplicate signals on the same pivot.
The failure engine has its own trade block: fluor cyan for TP, fluor red for SL. The SL can be placed at the wick tip or at the pivot level itself, each with its own ATR buffer. The RR ratio and block width are independently configurable.
Performance is tracked separately. The failure PnL, win rate, and expected value accumulate in their own records and are reflected in the total dashboard figures. Every failure trade contributes to the overall session result.
Enabling failure entry mode changes the entire visual environment. All bull elements — zones, candles, markers, trade blocks — switch from fluor green to fluor cyan. The mode status rows in the dashboard confirm what is active at a glance. Switching modes is one toggle. The chart responds immediately across every element.
The failure engine is not a replacement for the zone sweep system. It is a complementary tool for catching institutional moves that do not begin at a pre-mapped level. Used in combination with the zone context still visible on the chart, it gives Shark Hunt coverage of both types of setup — the anticipated sweep at a known level, and the opportunistic reversal at an unmarked pivot.
9. Settings reference
9.1 Zone detection
- Pivot lookback: bars each side to confirm a swing high or low
- Zone significance: scalp, intermediate, or major
- Max active zones per side: upper limit on tracked zones
- Zone ATR width: zone height as a multiple of ATR
- Min zone separation (ATR): minimum distance between zones of the same type
- Show fresh zones only: hide swept zones or keep them faded
- Enable zone flip: convert broken zones to the opposite side
9.2 Sweep confirmation
- Min wick penetration (%): minimum wick break through zone boundary
- Volume confirmation: toggle volume filter on or off
- Min volume multiple: minimum sweep bar volume relative to average
- Volume average period: rolling volume baseline length
- Wick rejection filter: toggle wick size filter on or off
- Min wick rejection (%): minimum wick as percentage of bar range
- Cooldown bars between sweeps: minimum gap between signals
- Require price failure (SFP): optional pattern gate
- Require wick trap: optional pattern gate
- Require absorption bar: optional pattern gate
9.3 Price patterns
- Show price imbalances
- Show absorption bars
- Show price failures
- Show level breaks and retests
- Show wick traps
9.4 Trade block
- Show trade block on sweep
- RR ratio
- SL mode: zone or wick
- SL buffer (ATR)
- Trade block width (bars)
9.5 Visuals
- Bull and bear liquidity zone transparency
- Show zone stats label
- Show % hold
- Show liquidity value
- Zone label size
- Min % hold to show zone
- Enable neon glow candles
- Body transparency (soft)
- Wick and border transparency (hard)
- Primary glow strength
- Secondary glow strength (diffuse)
- Enable neon glow zones
- Zone glow strength
9.6 Failure entry
- Enable failure entry mode
- Pivot lookback
- Min failure wick (ATR)
- Min wick rejection (%)
- Volume confirmation
- Min volume multiple
- Cooldown bars between failures
- SL mode: wick or pivot
- SL buffer (ATR)
- RR ratio
- Trade block width (bars)
- Show trade block on failure
9.7 Dashboard
- Show dashboard
- Position: top left, top right, bottom left, bottom right
- Size: tiny, small, normal
10. How to use
10.1 Initial setup
1. Set zone significance to match your timeframe. Major works well on 3m and 15m as a starting point.
2. Enable the filters you want active. Volume confirmation and wick rejection are on by default — these are the minimum recommended filters.
3. Set your RR ratio. The default of 1.0 is conservative. Adjust based on your own risk management rules.
4. Decide whether to use zone mode or failure entry mode. Both can be tested and compared using the dashboard statistics.
5. If you want neon glow rendering, set default chart candles to transparent first, then enable the glow toggles.
10.2 Reading the chart
Zones in fluor green are bull liquidity pools — unfilled stop clusters below recent swing lows. Zones in fluor red are bear liquidity pools above swing highs. The opacity and label show how historically respected each zone is.
When price approaches a zone, watch the sweep confirmation criteria. A qualifying bar at close triggers the signal and draws the trade block.
"F" labels mark price failure patterns. When an F appears near a zone boundary, it strengthens the setup. A price failure at a liquidity zone is the clearest confluence available in Shark Hunt — a structural stop hunt confirmed by both the zone engine and the failure pattern simultaneously.
Imbalance boxes, absorption dots, retest crosses, and wick trap arrows all provide additional context. None of them are trade signals by themselves. They are confluence indicators — the more of them align with a zone sweep, the higher the contextual quality of the setup.
10.3 Illustrative bull scenario
Educational example only. Not a trading recommendation.
A swing low forms with strong impulse score. A bull liquidity zone is drawn below it, showing 100% hold and a high liquidity value. Several bars later, price dips into the zone with a sharp wick on elevated volume. The wick is larger than the body, covering more than 25% of the bar range. The bar closes above the zone boundary. A fluor green triangle fires below the bar. The trade block appears showing the TP zone above and the SL zone below. An "F" label also appears on the same bar — the zone sweep and the price failure both confirmed simultaneously.
10.4 Illustrative bear scenario
Educational example only. Not a trading recommendation.
Price rallies into a bear liquidity zone marked from a prior swing high. The approach candle is an absorption bar — a dot appears above it. On the next bar, a sharp spike above the zone on high volume forms a wick that covers more than 25% of the bar range, closing back below the zone top. The sweep confirms. A fluor red triangle fires above the bar. The trade block drops from entry to the TP target below. A wick trap arrow also marks the same bar — strong institutional rejection at a known supply level.
10.5 Using failure entry mode
Enable failure entry mode when you want to trade swing failure patterns without requiring a pre-mapped zone.
The zone boundaries remain on the chart. Use them as context. A failure trade that targets a nearby bull or bear zone as its TP has structural justification for the exit level.
The min failure wick (ATR) setting is the primary quality control. Start at 0.4. If you see too many minor failures firing, raise it. If the engine is missing moves you can see visually, lower it.
The dashboard will show failure-specific statistics. Compare the failure win rate and expected value to the zone sweep statistics. Over time, this data tells you which setup type performs better on your instrument and timeframe.
10.6 Timeframe guide
- 1m–2m: scalp depth, loose filters, high zone count, failure mode useful
- 3m–5m: recommended default settings, both engines perform well
- 15m: major depth, tighter wick penetration, fewer but higher quality setups
- 30m and above: increase pivot lookback for both zone and failure engines
11. Tip
The zone hold percentage is information. A zone with 0% hold has been swept every time price visited it. That is a weak zone — it may not hold the next time either. A zone at 95% hold has defended itself repeatedly. That is a level with a track record.
Volume confirmation is your noise filter. On most instruments, genuine institutional sweeps show up on volume. A sweep on below-average volume is usually a retail move or a thin-market spike. Keep volume confirmation on unless your instrument has unreliable volume data.
The pattern confirmation gates stack. Requiring price failure, wick trap, and absorption simultaneously will produce very few signals — but the ones that fire will have three independent confirmations in addition to the base sweep conditions. Use the gates selectively based on how many signals your timeframe normally generates.
Zone glow and candle glow are independent. You can use zone glow without candle glow, or both together. The neon rendering is a visual choice — it does not affect signal logic.
Failure mode changes everything visually. When you enable it, the entire chart shifts to fluor cyan for bull elements. This is intentional — it makes the mode switch obvious. There is no ambiguity about which engine is active.
The dashboard expected value is the most useful long-term metric. A positive expected value means the average signal generates profit over time. A negative value means the current settings lose on average even if the win rate looks reasonable. Track it across sessions to validate your configuration.
Chart snapshots:
12. Disclaimer
This indicator is provided for educational and informational purposes only. Nothing in this document constitutes financial advice or any form of recommendation. Trading financial instruments involves substantial risk of loss. Past performance is not indicative of future results. You may lose all of your invested capital.
Anonycryptous accepts no responsibility or liability for any losses incurred as a result of using this indicator.
지표

Morning & Evening Star Detector [SSFX]Morning & Evening Star Detector is an open-source candlestick pattern indicator designed to identify two classic 3-candle reversal formations: the Morning Star and the Evening Star.
The Morning Star is a bullish reversal pattern that typically appears after bearish pressure. The indicator identifies it using a 3-candle structure:
A strong bearish first candle
A small-bodied middle candle, representing hesitation or loss of momentum
A strong bullish third candle that closes back into the body of the first candle
The Evening Star is the opposite bearish reversal pattern. It is detected when the market forms:
A strong bullish first candle
A small-bodied middle candle
A strong bearish third candle that closes back into the body of the first candle
To make the patterns easier to read on the chart, the script automatically draws a box around the full 3-candle formation:
Green box = Morning Star
Red box = Evening Star
The box covers the full high-to-low range of the entire pattern, helping traders visually study where the reversal structure formed.
Main features:
Detects Morning Star bullish reversal patterns
Detects Evening Star bearish reversal patterns
Draws visual boxes around valid 3-candle patterns
Green highlight for Morning Star formations
Red highlight for Evening Star formations
Optional labels for detected patterns
Optional background highlighting
Adjustable candle body percentage filters
Adjustable middle candle size filter
Adjustable third candle close requirement
Optional gap requirement for more traditional pattern detection
Built-in alert conditions for both pattern types
The pattern logic is fully customizable. Users can adjust the required body size of the first candle, the maximum body size of the star candle, the minimum body size of the confirmation candle, and how deeply the third candle must close into the first candle’s body.
The optional gap setting is included for traders who prefer a more classical definition of Morning Star and Evening Star patterns. Since many markets such as forex, gold, crypto, and index CFDs often do not produce clean session gaps, the gap requirement can be turned off for more flexible detection.
This indicator is intended for educational and analytical use. It does not predict future price movement and should not be used as a standalone trading system. Morning Star and Evening Star patterns are best interpreted together with market structure, support and resistance, trend context, volume, and proper risk management.
지표

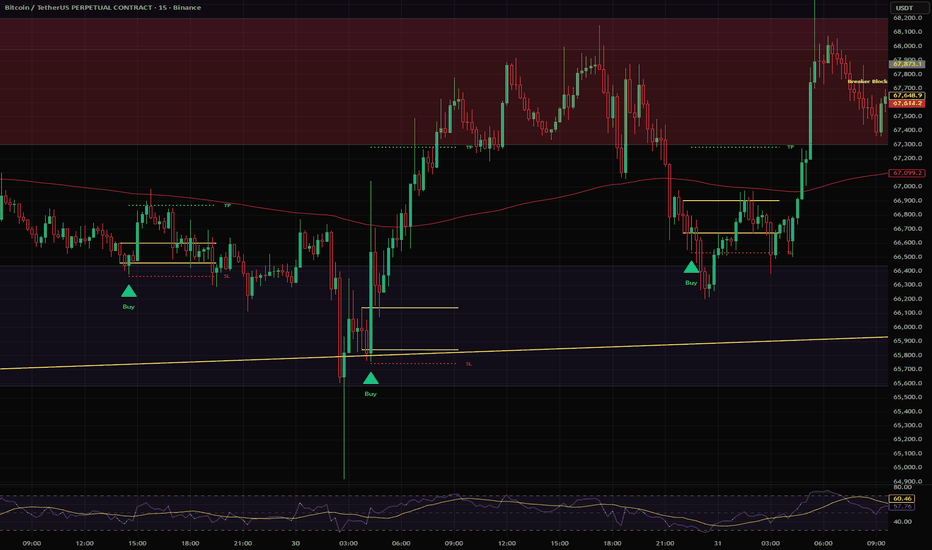
Bullish Sweep & Reclaim for BTC M15Bullish Sweep & Reclaim — Indicator Summary
Disclaimer:
This indicator is tuned and tweaked to find entries on the bitcoin 15 minute time frame only, I have not tested it on any other asset or time frames. use it wisely and manage your TP and SL as the patterns form.
i have back tested this strategy till 2020 and have tweak the numbers to give the cleanest most promising setup, i suggest keeping all values in the settings the same. or if you're a pro, feel free to tweak it more and test it further and share back with me if you find better values.
Although this is a fractal setup which works on most time frames, it is only tuned to catch setups on the M15 Chart
Overview
The Bullish Sweep & Reclaim indicator is a pattern-based tool built for the 15-minute timeframe, designed primarily around Bitcoin (BTC) price behavior. It identifies a specific three-leg liquidity grab sequence where the market flushes out stops below a recent low before reversing sharply back upward. The indicator marks these moments on the chart in real time, plotting a buy signal, a take profit level, a stop loss level, and the key price zone that anchors the setup.
The Core Pattern
The setup is built on three distinct candles, each playing a specific role.
The first leg is called the Drop Candle. This is a bearish candle that acts as the origin of the setup. It represents a meaningful downside move where sellers were in control. The Drop Candle establishes the key price range — its high and low are used later to define the take profit target and the zone that price must reclaim.
The second leg, C2, is any candle after the Drop Candle whose close falls below the Drop Candle's low. This confirms that selling pressure continued and that liquidity — in the form of stop loss orders from buyers — has been building up beneath that level.
The third leg, C3, is the signal bar. This is the current candle, and for the pattern to fire it must do two things simultaneously: its low must sweep below the C2 low, and it must close back above the Drop Candle's wick low. This combination signals that the market reached down to grab the liquidity sitting below those stops, then rejected sharply, with buyers stepping in and closing price back inside the prior range. This is the classic sweep and reclaim structure.
Drop Candle Filters
Because not every bearish candle is worth trading, the indicator includes a layered filter system to qualify the Drop Candle before it is used as the setup anchor. Each filter is independently toggled, giving full control over how strict the criteria are.
The RSI filter requires the RSI to be below a user-defined threshold at the time the Drop Candle forms, ensuring it occurred during genuine bearish momentum rather than a minor pullback. The default threshold is 54, which can be tightened to 45 or lower for fewer but higher-conviction signals.
The SMA filter requires the Drop Candle's low to pierce below a simple moving average — defaulting to the 100-period SMA. This ensures the candle pushed into a statistically significant area of price, filtering out shallow dips that lack structural importance.
The VWAP filter requires the Drop Candle to close below the session VWAP. Since VWAP represents the average price weighted by volume, a close below it confirms the candle formed in a bearish value zone rather than above fair value.
The Bollinger Band midline filter requires the Drop Candle's low to be below the BB basis — the 20-period SMA at the center of the Bollinger Bands. This adds a volatility-adjusted confirmation that the candle extended meaningfully below the midpoint of recent price action.
Optional filters include an EMA close filter and a volume multiplier filter, both disabled by default but available for further precision.
Exit Levels
When the pattern fires, the indicator automatically calculates and plots both a take profit and a stop loss.
The stop loss is placed just below the sweep low with a small configurable buffer.
The take profit has four options: the Drop Candle's high, or the Drop Candle's range extended by 1.5×, 2.5×, or 3× from the entry close.
Two solid yellow horizontal lines mark the Drop Candle's high and low zone on the chart for visual reference.
Alerts
A built-in alert condition fires on every valid signal, making it straightforward to set up TradingView notifications for any ticker or timeframe without needing to watch the chart continuously. 지표
MTF Mirror Candles + SMTMTF Mirror Candles + SMT displays higher-timeframe mirror candles directly on the chart, allowing traders to monitor broader market structure without changing timeframes.
The indicator includes customizable HTF mirror candles, candle countdown timer, adjustable spacing, candle colors, and automatic mapping between lower and higher timeframes.
It also includes an SMT divergence module designed to compare correlated markets such as MNQ/MES, EURUSD/GBPUSD, NAS100/US500, XAUUSD/XAGUSD, BTC/ETH, or custom pairs.
Main features:
• Higher-timeframe mirror candles
• HTF candle countdown timer
• Adjustable candle quantity, spacing, and visual style
• SMT bullish and bearish divergence detection
• Manual or automatic correlation mode
• Custom correlation pairs
• Clean SMT labels with monitored pair names
• Designed for multi-timeframe and correlation-based analysis
This indicator is intended as a visual analysis tool and does not provide financial advice or buy/sell signals. 지표

전략

NY Engulfing StrategyThis backtesting indicator is a rule-based trend strategy designed to identify high-probability engulfing setups during the New York session while enforcing strict trade filters to improve consistency. It combines a moving average for trend direction (with optional slope confirmation), engulfing candle logic based on candle bodies (with optional two-candle patterns), and an optional proximity filter to ensure entries occur near the moving average. Trades are only allowed within a defined session window (default 9:40 AM–4:45 PM EST), with limits on the number of trades per day and optional rules like stopping after the first win or forcing a close at 4:55 PM. The indicator simulates trade outcomes using fixed SL/TP values (with manual inputs always overriding presets), tracks performance over a customizable lookback period, and displays key metrics such as win rate, drawdown, profit percentage, average R per day, streaks, and counts of strong performance days (3 win days and 3 loss days). It also includes intrabar “sticky” entry logic so signals are preserved once price touches an entry level during a candle, providing more realistic backtesting results. 지표

Institutional Candle Detector [AGPro Series]🕯️ Institutional Candle Detector
Every trader has stared at a massive candle and asked the same question: "Was that the start of a move, the end of one, or just noise?" Most indicators stop at detection — they paint the candle, drop a label, and walk away. This one keeps watching.
Institutional Candle Detector uses a dual-track engine. The body-driven track flags high-conviction candles where ATR-normalized body size and relative volume both expand together, then classifies each event by body/wick geometry. The independent absorption track captures a different signature entirely — low-body candles on extreme volume, the classic aggression-absorbed footprint that body-only detectors miss. Every detected event is then re-evaluated over the following bars to produce a measurable outcome scorecard.
🔹 OVERVIEW
The script scans each bar for two separate, mutually-exclusive institutional signatures:
• Body-driven events. Body must exceed a multiple of ATR AND volume must exceed a multiple of its rolling average. Classified by geometry into Continuation, Reversal or Exhaustion.
• Absorption events. Volume extremely elevated BUT body contained — the market paid for a big move and did not get one. Price was absorbed.
Every detected candle is then given a reaction zone projected forward, and its outcome is automatically tagged after the configured look-forward window — Follow-Through (FT), Reverse (RV) or Consolidation (CN). The panel accumulates aggregate statistics across the loaded chart so the trader can see which candle type actually works on their instrument and timeframe.
🔸 UNIQUE EDGE
What separates this tool from generic "big candle" or "volume spike" indicators:
• Dual-track detection. A single filter cannot capture both explosive moves and absorption. This script runs two engines in parallel with independent thresholds.
• Four-class geometric taxonomy, each backed by a distinct detection path. Continuation and Reversal fire from the body-driven track with different geometry. Exhaustion catches the mid-profile edge cases. Absorption runs entirely off its own volume-first track.
• Automatic after-behavior tracking. Each event is re-examined after N bars and tagged with an outcome code. This is the part most scripts omit — and it's where edge lives.
• Aggregate statistics panel. Follow-through rate, reverse rate, consolidation rate, and per-class counts are computed continuously. The panel tells you whether institutional candles on this asset actually extend, reverse, or fade.
• Forward-projected zones, colored by class. Body-driven bull/bear events use state colors. Absorption uses an indigo accent so the rarer signature is instantly recognizable. Reversal zones use the contrarian color to emphasize the expected directional flip.
🔹 METHODOLOGY
Body-Driven Track (produces CONT, REV, EXH)
– Body is measured as absolute (close − open) and required to exceed Body × ATR multiple.
– Volume is required to exceed a configurable multiple of its SMA average.
– An optional wick filter rejects candles where total wick exceeds the body beyond a given ratio, removing wide-range noise that looks institutional but is not.
– Continuation: body% ≥ configured threshold (clean directional close).
– Reversal: opposing wick% ≥ configured threshold (sharp rejection after initial push).
– Exhaustion: passes the dual-gate but falls into neither clean category — mid profile, often late in a move.
Absorption Track (produces ABS)
– Volume must exceed an independently configurable multiple (higher than body-driven default).
– Body must be small — below a max Body × ATR and below a max Body / Range.
– When absorption fires, it takes precedence over body-driven classification.
After-Behavior Layer
– After lookFwd bars, the script compares the extreme price move in each direction against the original body size.
– If same-direction extension ≥ ftPct × body → Follow-Through (FT).
– If opposite-direction retrace ≥ revPct × body → Reverse (RV).
– Otherwise → Consolidation (CN).
Aggregate counters accumulate across the loaded chart, producing a running scorecard visible in the panel.
🔸 SIGNALS, STATES & MARKERS
On-chart signals
• Institutional body recolored by class — bull/bear direction for CONT and EXH; contrarian color for REV; accent color for ABS.
• Directional triangle marker above/below the bar.
• Classification label: INST-Bull 3.2x CONT or INST-Bear 5.4xV ABS format, ASCII only. Labels offset from the candle to stay readable on dense charts.
• Reaction zone box projected forward from the candle's high-low range, color-coded by class.
• Outcome marker (FT / RV / CN) plotted lookFwd bars after the event.
Alerts available
• Institutional Continuation
• Institutional Reversal
• Institutional Absorption
• Institutional Exhaustion
All four alerts fire on confirmed bars only.
🔹 KEY INPUTS
Detection Core (body-driven track)
– ATR Length (default 14)
– Volume Average Length (default 20)
– Min Body × ATR (default 2.0)
– Min Volume Multiple (default 2.5)
– Wick filter toggle and max Wick/Body ratio (default 2.5)
Absorption Track
– Enable Absorption Detection
– Absorption Min Volume Multiple (default 4.0)
– Absorption Max Body × ATR (default 1.5)
– Absorption Max Body / Range (default 0.40)
Classification
– Continuation body% threshold (default 0.60)
– Reversal opposing-wick% threshold (default 0.40)
After-Behavior
– Look-forward bars (default 5)
– Follow-through threshold as fraction of body (default 0.50)
– Reverse threshold as fraction of body (default 0.60)
Visuals
– Show/hide zones, zone projection length, opacity, max active zones
– Label size (default Small; increase if labels feel too compact)
– Institutional border width
– Outcome marker toggle
Panel
– 8-position panel placement
– Dark / Light theme
– Font size (default Normal)
– Recent events mini-list toggle
🔸 HOW TO USE
1. Start with defaults on a liquid asset. 4H is a strong baseline; 1H for active traders; Daily for swing context. On Daily, consider lowering Min Body × ATR to 1.5 if events are too rare.
2. Watch the panel accumulate events over two to four weeks on your instrument. The follow-through rate tells you whether institutional candles on this chart tend to extend or fade.
3. Trade-context usage:
– Continuation with a high historical follow-through rate on this asset → trend trades in candle direction after pullback into the zone.
– Reversal with a high historical reverse rate → fade setups at key levels.
– Absorption → aggressive flow was met by an equal or greater defender; often precedes a reversal or compression phase.
– Exhaustion → proceed with caution; frequently a late-move signature where the trend is losing clean structure.
4. Reaction zones act as provisional supply/demand. A retest of a zone with another institutional event near it is a confluence worth noting.
5. Tune thresholds per asset. High-liquidity instruments may need Body × ATR of 2.5+ to keep events selective; low-liquidity pairs can go down to 1.5. Absorption volume multiple can also be adjusted upward on already-volatile instruments.
🔹 LIMITATIONS & TRANSPARENCY
• This is an analytical indicator, not a strategy. No entry, exit, or stop logic is defined and no performance claims are made.
• Aggregate statistics are computed over the loaded chart window and will shift as more bars load or as timeframes change.
• Volume quality depends on the data feed; exchange-reported volume differs across sources for the same asset.
• Follow-through evaluation uses a fixed look-forward window; real trade management will differ.
• All results are historical and descriptive. Past behavior of any candle class does not guarantee future behavior.
🔸 RISK DISCLOSURE
Trading carries substantial risk. This tool is provided for analytical and educational purposes. Do your own research. Use position sizing and risk management appropriate to your account. Nothing in this script constitutes financial advice. 지표

Volume Climax Detector [AGPro Series]Volume Climax Detector
Volume Climax Detector is an advanced volume analytics tool that identifies extreme institutional volume events using a three-filter VSA (Volume Spread Analysis) methodology. Rather than triggering on simple volume multiples, the script combines Volume Z-Score statistics, Spread analysis, and Close Location to isolate genuine climax bars — the kind of exhaustion moves Wyckoff and VSA traders look for at trend tops and bottoms.
🔹 OVERVIEW
Volume alone is a noisy signal. A "high volume bar" on one instrument is a quiet bar on another, and most volume-based indicators either miss real climaxes or fire on every uptick. This script takes a statistical approach: it measures how extreme each bar's volume is relative to its own recent history (Z-Score), confirms the bar structure makes sense (Spread and Close Location), and then classifies the event as a Buying Climax or Selling Climax using trend context — the Wyckoff way.
The result is a small number of high-conviction labels at exactly the places where large participants tend to exhaust themselves: panic buys at tops, panic sells at bottoms, and hidden absorption in between.
🔹 WHAT MAKES IT DIFFERENT
Most volume indicators apply a single threshold (e.g. volume > 2× average) and stop there. This script layers three independent VSA filters, each addressing a different failure mode:
• Volume Z-Score — adapts to the instrument's own volume distribution. A 3σ event on BTC is genuinely rare, regardless of session or timeframe.
• Spread filter — requires the bar's range to exceed its recent average. Eliminates the common false positive of a high-volume bar that barely moved (compression).
• Close Location — requires the close to sit in the upper or lower third of the bar. Separates conviction from indecision.
Beyond detection, two analytics layers set it apart from typical volume tools:
• Reversal Success Tracking — every climax is tracked forward for a configurable window, and the script records whether a meaningful counter-move actually materialised (measured in ATR). The panel shows a live Reversal Rate, so users get honest feedback on how well climaxes have worked on the current symbol and timeframe.
• Magnitude Scoring (1–10) — every climax receives a strength score derived from its Z-Score, making it easy to distinguish routine spikes from truly extreme events (marked with ★).
🔹 METHODOLOGY
1. Volume Statistics
The script computes a rolling mean and standard deviation of volume over a configurable lookback window (default 50 bars). The Z-Score tells how many standard deviations above the mean the current bar is. A reading of 3.0σ or higher (default threshold) corresponds to the top ~0.27% of bars — statistically rare, not just "above average."
2. Triple Filter Gate
A bar qualifies as a potential climax only when:
• Z-Score ≥ threshold (volume anomaly)
• Bar range ≥ spread multiplier × average range (wide spread)
• Close is in the upper 33% (strength) or lower 33% (weakness) of the bar range
3. Wyckoff Classification
• Buying Climax — qualifying bar during an established uptrend. Interpretation: buyers are exhausting themselves; potential topping action.
• Selling Climax — qualifying bar during an established downtrend. Interpretation: sellers are exhausting themselves; potential basing action.
• When no clear trend exists, classification falls back to close location plus bar direction so that sideways regimes still produce meaningful signals.
4. Confluence Grouping
When multiple same-direction climaxes occur close together in time or price, the script collapses them into a single label representing the strongest event in the cluster. This keeps charts readable without losing information — the panel still counts every individual climax.
5. Effort vs Result (optional)
A companion layer flags high-volume bars with unusually narrow spread — the classic VSA "No Demand" and "No Supply" conditions. These often signal hidden absorption ahead of a reversal and are shown as separate labels.
🔹 SIGNALS & ALERTS
Four built-in alert conditions:
• Buying Climax detected
• Selling Climax detected
• Extreme Climax (Z-Score above the extreme threshold, marked with ★)
• No Demand / No Supply divergence
Each alert payload includes the symbol, Z-Score, and magnitude score, ready for automation or review.
🔹 KEY INPUTS
• Volume Lookback (default 50) — rolling window for statistics.
• Z-Score Threshold (default 3.0σ) — minimum statistical extremity. Lower on intraday, higher for premium signals only.
• Extreme Threshold (default 4.0σ) — above this, climaxes are flagged with a ★.
• Spread and Close filters — each can be toggled independently for flexibility across asset classes.
• Trend EMA Length and Sensitivity — control how the script defines uptrend and downtrend, with an ATR-normalised slope check to avoid misclassifying sideways regimes.
• Reversal Window and Threshold — define what counts as a "successful" reversal for the panel statistic.
• Confluence controls — Time-first (default), Price-first, or Strict mode, plus bar and ATR tolerances.
• Climax Zones (optional, default off) — extends each climax bar's range forward as a reaction zone, similar to S/R.
🔹 HOW TO USE
• Start with defaults on any liquid instrument and timeframe. The script adapts to the local volume distribution automatically.
• On highly volatile intraday timeframes, consider raising the Z-Score Threshold to 3.5σ for fewer, cleaner signals. On slower timeframes, the default works well.
• Treat a ★ Extreme Climax as higher-conviction than a plain climax, and pay attention to the Magnitude Score for fine gradation.
• Use the Reversal Rate panel value as a feedback loop — if it is low on your chosen instrument and timeframe, either adjust thresholds or reconsider the setup.
• Combine with your own structural analysis (support/resistance, HTF trend, market structure) for confirmation. The script identifies the event, not the entry.
🔹 LIMITATIONS & TRANSPARENCY
• This is an indicator, not a strategy. It does not generate buy or sell orders and makes no assumption about position sizing or risk management.
• Climaxes are statistical events. They tend to mark inflection points, but no volume pattern resolves into a reversal every time. The built-in Reversal Rate panel value exists precisely to make this honest — users see the actual hit rate on their own chart.
• The script uses publicly available volume data from the chart's exchange. Volume quality varies by venue; results may differ on symbols with thin or unreliable volume reporting.
• Classification depends on trend context. In strongly sideways regimes, the fallback rules may label climaxes differently than a human analyst would; reviewing the Trend EMA and sensitivity inputs helps here.
• Labels are confirmed on bar close (no repaint). Panel counters and the Current Z-Score value update intrabar for live monitoring.
🔹 RISK DISCLOSURE
Trading involves substantial risk of loss. Past behaviour of any signal or statistic does not guarantee future performance. This script is a research and analysis tool — it is not investment advice, a recommendation, or a solicitation to trade. Users are responsible for their own decisions, risk management, and position sizing. 지표

Candle Fingerprint [TradingIQ]Hello Traders!
🔹 Candle Fingerprint
Candle Fingerprint is a pattern-based analysis tool designed to study how price has typically behaved after specific candle structures.
Instead of treating candles as isolated events, this tool compares current candles to historical ones and shows what has usually happened next in similar situations .
Think of it as a way to find historical matches and outcomes for the current candle , not as a fixed prediction engine.
finds candles with similar structure in the past
compares body size, wicks, volatility, and close position
tracks whether price typically continued or reversed
shows continuation vs reversal rates
displays typical move after similar candles
optional streak-based behavior analysis
🔹 What the tool shows
🔸 Candle similarity matching
The script analyzes the current candle and searches historical data for candles with similar structure.
It compares multiple components such as body size, wick proportions, volatility, and where the candle closed within its range.
This helps reveal:
which past candles looked similar to the current one
how those candles behaved afterward
whether similar setups tended to continue or reverse
Instead of assuming what a candle means, you get a historical reference for how similar structures have behaved before .
🔸 Continuation vs reversal behavior
Once similar candles are found, the script tracks what happened next.
It calculates how often price continued in the same direction versus reversing.
This allows you to see:
whether continuation or reversal has been more common
the relative strength of that tendency
how consistent the behavior has been across samples
This provides context around the current candle, rather than a guaranteed outcome.
🔸 Typical move after the candle
In addition to direction, the script measures how far price typically moved after similar candles.
It calculates median moves for both continuation and reversal scenarios.
This helps show:
the typical size of follow-through moves
the difference between continuation and reversal magnitude
how strong or weak reactions have been historically
This is not about predicting an exact move, but about understanding what has commonly happened in the past .
🔸 Visual similarity mapping
The script highlights the most similar historical candles directly on the chart.
This gives a visual reference for how past setups formed and evolved.
This helps you:
see real examples of similar price behavior
compare structure side by side
understand how the current setup fits into historical context
🔸 Candle streak model
In addition to similarity, the script includes a streak-based model that tracks sequences of consecutive up or down closes.
This allows you to analyze:
what has typically happened after multiple up closes
what has typically happened after multiple down closes
how continuation vs reversal tendencies shift with streak length
This provides a different lens focused on momentum sequences rather than structure .
🔸 Confidence context
The tool evaluates how reliable the observed behavior is based on sample size and consistency.
This helps you understand:
whether the data is meaningful or limited
how much weight to give the observation
when patterns appear more or less stable
🔹 How to read it
Each component gives a different layer of insight:
Candle structure → what the current candle looks like
Similarity matches → where this pattern appeared before
Continuation rate → how often price continued
Reversal rate → how often price reversed
Typical move → how far price typically moved afterward
Streak context → how sequences of candles have behaved
🔹 Why this tool is useful
It gives you:
a structured way to compare current candles to historical ones
context for whether a setup has tended to continue or reverse
typical move expectations based on past behavior
a data-driven alternative to subjective candle interpretation
multiple perspectives using both structure and streak behavior
🔹 Best use cases
analyzing individual candle behavior
comparing current setups to historical patterns
studying continuation vs reversal tendencies
understanding momentum through candle streaks
adding contextual data to price action analysis
🔹 Important note
This tool is based entirely on historical observations and pattern matching.
That means:
it reflects past behavior, not guaranteed outcomes
it should not be treated as a predictive or deterministic model
similar candles can still produce different results
outputs are best used as context, not certainty
🔹 Inputs you can customize
The script includes flexible controls such as:
model selection (similarity or streak)
candle selection method
table display and positioning
similarity weighting (body, wicks, volatility, close)
history table settings
visual offset and layout
Closing Notes
Candle Fingerprint is built to shift the focus from what a candle looks like to how similar candles have behaved historically .
It does not attempt to predict the future, but instead provides a structured view of what has typically happened in comparable situations , allowing you to make more informed, contextual decisions.
Thank you for checking it out! 지표

Rejection Block Quality [AGPro Series]Rejection Block Quality
🔹 OVERVIEW
Rejection Block Quality is an ICT-inspired detector that identifies long-wick rejection candles at swept swing pivots and grades each block by objective quality criteria. Unlike Order Block logic — which anchors to the last opposite-direction body before displacement — a Rejection Block (RB) is born from a wick that pierces a prior swing liquidity pool and closes back inside it, with the body confirming displacement on the follow-through bar. The rectangle is drawn from the wick base to the candle body, capturing the exact zone where smart money absorbed the sweep.
🎯 UNIQUE EDGE
Three design choices separate this tool from generic wick or order block indicators:
• Swing-pivot sweep requirement — a rejection is only counted when price sweeps a confirmed swing high or low before the reversal close. Stand-alone wick patterns without liquidity context are filtered out.
• Displacement confirmation window — the candle following the rejection must travel at least 0.6× ATR in the reversal direction, within a 1–5 bar lookahead. No displacement, no block.
• Quality tiering (A / B / C) from three orthogonal factors — wick-to-body ratio, displacement magnitude, and untested freshness. An exceptional wick ratio (≥5× body) promotes a block to A tier regardless of other scores, preserving rare high-conviction rejections.
🛠️ METHODOLOGY
Detection pipeline on every bar:
1. Confirm a pivot sweep using a user-configurable lookback (default 5 bars each side).
2. Check the wick-to-body ratio against a minimum threshold (default 1.8×), with the dominant wick on the sweep side.
3. Queue the candle as a pending block and wait for displacement confirmation.
4. Measure displacement as price travel from the body reference over 1 to 5 bars, normalized by ATR.
5. On confirmation, draw the RB zone from the wick base to the body, record the tier, and begin lifecycle tracking.
Zone lifecycle tracks four events — test (price enters the zone), hold (price exits without a body close through the far edge), break (body close through the far edge), and near miss (price approaches within a configurable ATR band without entering). All events are edge-detected to prevent inflated counts when price lingers near a zone.
📊 SIGNALS & ALERTS
• New block formation label — A / B / C tier plus wick ratio, placed with anti-collision offset.
• Test markers (T) — one per zone entry event, with cooldown to prevent visual clutter.
• Break markers (B) — placed when a zone is invalidated by a body close.
• Wick border highlight — thick colored line on the originating rejection candle.
• Alerts — configurable minimum tier (A, B, or C) fires once per bar close for each qualifying new block.
⚙️ KEY INPUTS
• Detection — Pivot Length, Min Wick-to-Body Ratio, ATR Length, Min Displacement (× ATR), Displacement Confirm Window.
• Zone Management — Max Active Zones per Side, Zone Right Extension, Near-Miss Distance, Near-Miss Cooldown, Break Requires Full Body Close.
• Visuals — Show Zones, Show Tier Labels, Highlight Rejection Wick Border, Show Test / Hold / Break Markers, Zone Fill Opacity, Label Font Size.
• Panel — Show Panel, Panel Location, Panel Font Size, Panel Theme (Dark / Light).
• Alerts — Minimum Tier for Alerts.
🧭 HOW TO USE
Start on a higher timeframe (4H or 1D) to identify macro RB zones, then drill down to execution timeframes for entries. Treat A-tier blocks as the highest-conviction zones, B-tier as situational, and C-tier as context-only. Combine with trend filters, higher-timeframe structure, and risk management — a Rejection Block is a zone of interest, not a standalone buy or sell signal. Use the panel statistics to evaluate how the selected symbol and timeframe have historically respected these zones before committing to them in live decision-making.
⚠️ LIMITATIONS & TRANSPARENCY
This indicator is a structural detector, not a trading strategy. It does not forecast price direction, generate entry or exit orders, or calculate position sizing. The Success Rate statistic reflects how often past tests on detected zones held versus failed within the visible history — it is a descriptive metric, not a performance projection. Zone detection is historical and reactive: a block only appears after the displacement bar closes, so interpretation on live-forming bars is tentative. Performance varies by symbol, timeframe, and market regime.
⚠️ RISK DISCLOSURE
Trading involves substantial risk of loss. Past behavior of any pattern does not guarantee future outcomes. Use this tool as part of a complete analytical framework that includes your own risk management, position sizing, and broader market context. Nothing in this indicator or description constitutes financial advice. 지표

지표

지표

지표
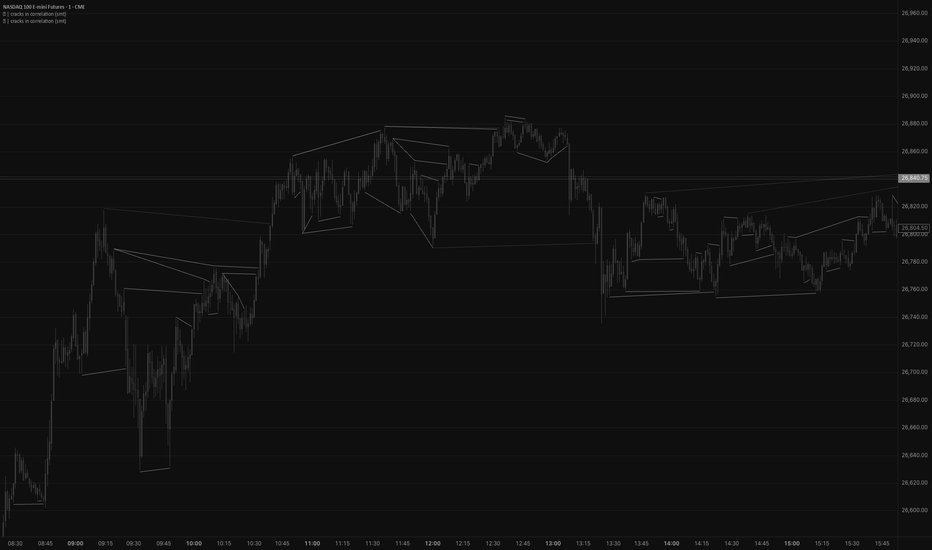
cracks in correlation (smt)introducing what (in my opinion) might be the best open-source smt divergence indicator yet!
as you may know, an SMT divergence forms when 2 correlated pairs' structure diverges (i.e. NQ makes a higher high and ES makes a lower high). when this happens, smart money traders take advantage of the "crack in correlation" and enter positions looking for the assets to converge again. with this indicator, you will NEVER miss an smt again!
allow me to bore you with the technicals for a bit. while most smt indicators only compare 2 pivots, this one (using the amazing ZigZag library by Trendoscope), allows us to compare up to 128 different pivots at once, ensuring that every high is compared with every other high. this setting is controlled using the "memory buffer" counter inside the inputs of the indicator. raising this setting will make the indicator take more time to load, but will also show you more potential smts. using this zigzag, we're able to check whether the corresponding asset's structure is the same as the current one.
all of the other settings should be self-explanatory, but should you have any questions, you can reach out to me in the comments below.
as this indicator is open-source, feel free to reuse it as you wish, but if you are re-using significant portions of it, please credit me. it would mean a lot to me :>
thank you for using my indicator. happy trading! 지표
지표

지표

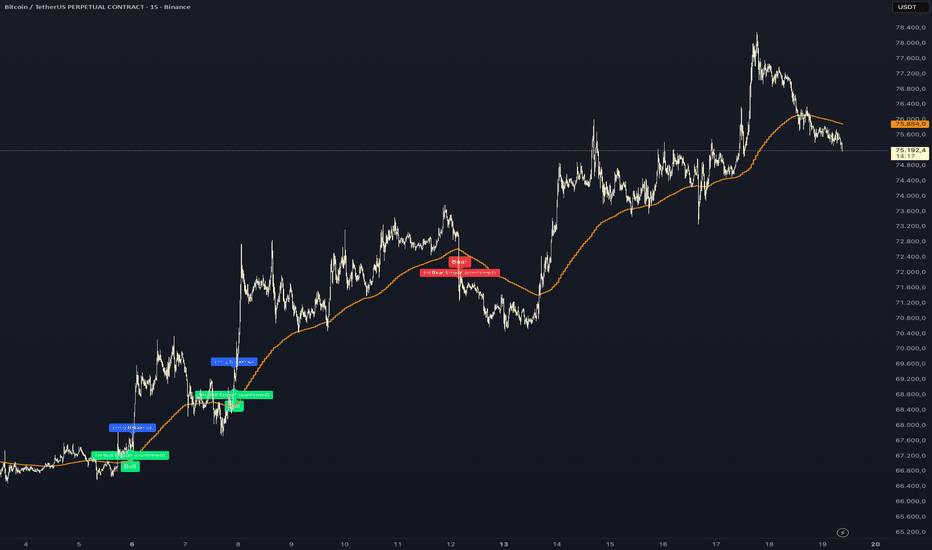
BTC MTF Engulfing Flip Strategy (1H, 2X)BTC Flip Bot V1 — MTF Engulfing + SL-Flip (BTCUSDT 1H 2×)
Author: Jagadeesh Manne
Version: V1 — first public release (April 2026)
A multi-timeframe trend-following strategy with SL-flip extension for BTC perpetual futures.
⚠️ IMPORTANT: This strategy is tested and validated ONLY on BTCUSDT perpetual futures | 1H timeframe | 2× leverage. Do not apply to other pairs, timeframes, or leverage settings without independent testing.
⚠️ TradingView's chart timeframe affects how this strategy calculates. A red banner appears if the chart is not set to 1H — set the top-left TF to "1h" explicitly for results to match the published backtest.
⚠️ TradingView free/basic accounts cache only a limited number of bars (5K–20K). The TV backtest you see will cover only the most recent window of the full 6.5-year test. See the "Full backtest" section below for the authoritative Python numbers.
━━━━━━━━━━━━━━━━━━━━━━━━━━━━━━
HOW IT WORKS
Three timeframes must align simultaneously on a single 1H bar before a trade is taken:
🔹 DAILY — Trend Regime
Close > 50-period EMA for longs (below for shorts). Macro trend safety gate — rejects ~50% of all signals that would trade against the dominant trend.
🔹 4H — Momentum Confirmation
RSI(14) > 50 for longs (below for shorts). Medium-term momentum alignment.
🔹 1H — Entry Trigger (all 5 must be true on the same bar)
• RSI(14) > 45 for longs / < 55 for shorts
• MACD(12,26,9) line above/below signal line
• Bullish or Bearish engulfing candle (body > prior body) — the core trigger
• ATR(14) above 50-period average (volatility expanding)
• Volume above 1.5× 20-period SMA (participation spike)
Only ~1% of all engulfing candles pass all 7 filters across a 5-year period. This extreme selectivity is the edge.
━━━━━━━━━━━━━━━━━━━━━━━━━━━━━━
STOP LOSS & PARTIAL TP
Main SL: Pattern-based (min of entry bar low + prior bar low, with 0.1% buffer). Capped at 2.5% from entry. Whichever is tighter wins.
Partial TP (tuned April 2026):
• At +6R favorable move, 15% of position closes
• After partial TP, SL moves to entry + 0.1% (break-even + fee buffer)
• Remaining 85% continues running with BE stop — captures fat-tail winners while protecting locked-in profit
Why 15%@6R (not 30%@5R)? Grid-search on 5yr data showed this variant lifts CAGR +11 percentage points vs the previous 30%@5R partial, because a small partial lets the runner portion capture the full fat-tail move when a trend plays out.
━━━━━━━━━━━━━━━━━━━━━━━━━━━━━━
SL-FLIP EXTENSION
When main SL hits, the strategy queues an opposite-direction flip trade:
• Waits 1 hour after SL hit (lets whipsaw settle)
• Opens opposite direction with TIGHT 1.5% SL (vs main 2.5%)
• SL placed at swing high/low from last 10 bars OR 1.5% cap from broken SL — whichever is tighter
• No flip-on-flip cascade (prevents revenge trading)
• 24-hour time-stop on flip positions
• Flips respect DD halt + generic post-exit cooldown
Flip trades add a meaningful contribution over the non-flip baseline while keeping max drawdown unchanged.
━━━━━━━━━━━━━━━━━━━━━━━━━━━━━━
EXIT RULES
• Stop Loss hit → close (triggers flip if not already a flip)
• Partial TP at +6R → close 15%, SL moves to BE+0.1%, rest runs
• Opposite direction signal → close only (no flip-open on signals, only on SL)
• Flip time-stop at 24h → close
• Drawdown circuit breaker: -25% from peak halts all trading for 7 days
━━━━━━━━━━━━━━━━━━━━━━━━━━━━━━
RISK MANAGEMENT
• 2× leverage (tested at this level only)
• Position sizing: notional = equity × leverage (deploys full leverage on each trade)
• 24h same-direction cooldown after SL hit
• 2h generic post-exit cooldown (any direction)
• -25% drawdown halt pauses trading for 7 days
• Flip trades use tighter SL (1.5%) + 24h time-stop
━━━━━━━━━━━━━━━━━━━━━━━━━━━━━━
FULL BACKTEST (Python, Binance futures historical data)
Period: September 2019 — April 2026 (~6.5 years)
Starting capital: $5,000
Leverage: 2×
Results (V1 with latest tuning: 15%@6R partial + BE+0.1% + SL-flip):
Start → Final: $5,000 → $181,943 (+3,539%)
CAGR: +105.3%
Max DD: -19.7%
Profit Factor: 4.63
Win Rate: 41.9% (31W / 43L)
Total Trades: 74 (~15/yr) — 38 Long, 36 Short, 9 of which were flips
SL hits: 40
DD halts triggered: 0
Tuning history (each change validated on 5yr data):
• Baseline V5 (no flip): +89% CAGR, PF 4.24, 43 trades
• V6 + SL-flip: +97% CAGR, PF 4.20, 79 trades (flips add more trade opportunities)
• V6 + BE-move after partial TP: PF 4.20 → 4.29 (kills runner-giveback)
• V6 + 15%@6R partial: CAGR 97% → 105%, PF 4.29 → 4.63 (current)
━━━━━━━━━━━━━━━━━━━━━━━━━━━━━━
WHY TRADINGVIEW RESULTS DIFFER FROM PUBLISHED NUMBERS
Two reasons:
1. Bar history limit — TradingView loads a finite number of bars for strategy calculation. Free and basic plans only cover ~6–14 months of 1H data. The chart date header shows the full visible range, but the strategy only computes on the loaded bars. Premium plans load more history but usually still less than 6.5 years.
2. Indicator warmup — the Daily EMA50 filter needs ~50 daily bars (~2 months) of warmup data before producing stable values. Python skips the first 100 bars explicitly; Pine Script does not.
For production-accurate numbers, use the Python backtest values above. For a feel of the strategy's pattern, the TV preview is fine as an indication.
━━━━━━━━━━━━━━━━━━━━━━━━━━━━━━
WHAT TO EXPECT
This is NOT a high-frequency strategy:
• ~15 trades per year including flip trades
• Median wait between main signals: 7–10 days
• Longest historical quiet gap: ~2 months
• ~55% of trades stopped out (by design — fat-tail capture)
• Average winner >> average loser (each win is ~5–8× an average loss)
• Requires patience — extended quiet periods are normal, not a malfunction
• Fat tails matter: a few mega-winners (10%+ single trades) drive most of the CAGR
━━━━━━━━━━━━━━━━━━━━━━━━━━━━━━
SETTINGS (all configurable with tooltips)
Risk Management:
• Leverage: 2× (tested only at this level)
• Risk per trade: 1% (used for dashboard display)
• DD halt: -25% for 168 hours (7 days)
Stop Loss:
• SL max: 2.5% cap
• SL buffer: 0.1%
Partial Take Profit:
• TP trigger: 6R (sweep-verified peak)
• TP close: 15% of position
• SL-to-BE buffer after partial: 0.1% (kills runner-giveback)
Entry Filters:
• RSI long/short zones: 45 / 55
• Engulf body multiplier: 1.0× (any-size engulfing)
• ATR MA length: 50
• Volume SMA length: 20
• Volume spike ratio: 1.5×
Cooldowns:
• Same-dir SL cooldown: 24h
• Generic post-exit cooldown: 2h
SL-Flip:
• Enabled by default
• Flip wait: 1h
• Flip SL cap: 1.5%
• Swing lookback: 10 bars
• Flip time-stop: 24h
Visuals:
• Clean view toggle (default ON — hides dashboard for publishing)
• Daily EMA50 line toggle
• Timeframe advisory banner (red warning if chart TF ≠ 1H)
━━━━━━━━━━━━━━━━━━━━━━━━━━━━━━
DISCLAIMER
• Past performance does not guarantee future results. Backtests can overfit, especially after extensive parameter tuning.
• Live performance will differ from backtest due to real slippage, partial fills, exchange latency, and market regime shifts.
• TradingView free/basic accounts show a limited window; the authoritative full backtest is Python + Binance archives.
• This strategy is designed for experienced traders who understand leverage, futures trading, stop losses, drawdown risk, and position sizing.
• Small sample size (74 trades over 6.5 years) means regime changes could meaningfully degrade performance. A flat 3–6 month period is not a strategy failure.
• The strategy depends on fat-tail winners. Missing one or two large trends can halve expected CAGR.
• 2× leverage amplifies both gains AND drawdowns. Use capital you can afford to lose entirely.
• Not financial advice — use at your own risk.
━━━━━━━━━━━━━━━━━━━━━━━━━━━━━━
CHANGELOG
V1 (April 2026 — first public release):
• Multi-timeframe entry: Daily EMA50 + 4H RSI + 1H (RSI + MACD + Engulfing + ATR + Volume)
• Pattern-based SL with 2.5% cap
• Partial TP: 15% at +6R (small partial for maximum fat-tail capture)
• SL-to-BE move after partial TP (kills runner-giveback)
• SL-flip extension: opposite-direction entry after SL hit with tight 1.5% SL
• 24h same-direction cooldown + 2h generic cooldown
• -25% DD halt for 7 days
• Clean-view toggle for minimal chart display
• Timeframe-mismatch advisory banner
전략

지표

지표
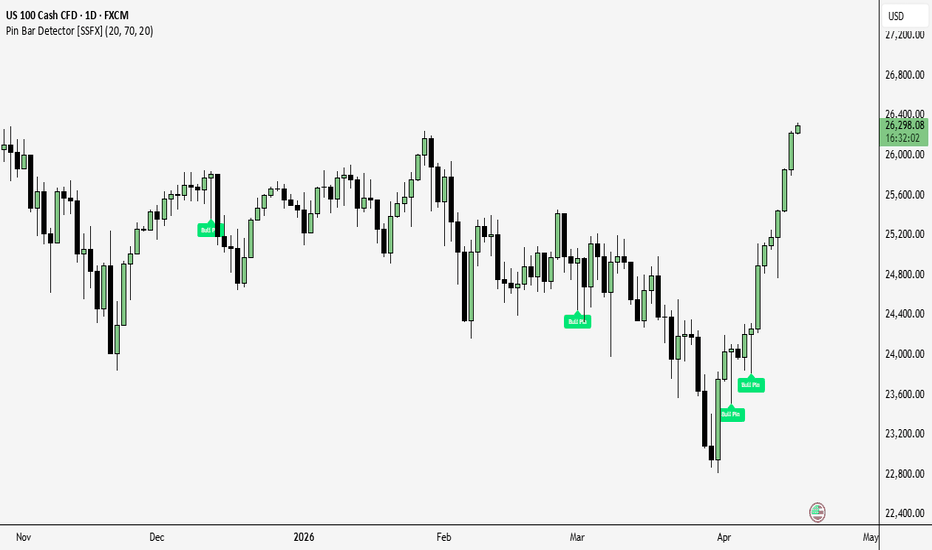
Market Structure Navigator [JOAT]Market Structure Navigator
Introduction
Market structure is one of the most widely discussed concepts in technical analysis, yet most tools that attempt to visualize it reduce swing highs and swing lows to single price points. In practice, price rarely reverses at a precise tick level — it reacts within a zone , which may span several ATR units depending on the instrument and timeframe. This distinction matters: treating a level as a point rather than a zone leads to false breaks being mistaken for genuine structural shifts.
The Market Structure Navigator addresses this by modeling every significant swing high and swing low as an ATR-based zone with measurable thickness. It tracks two layers of structure simultaneously — external (major) pivots that define the larger-degree trend, and internal (minor) pivots that provide context within that trend. Each zone passes through a three-state lifecycle, and structural breaks are automatically classified as either Break of Structure (BOS) or Change of Character (CHoCH), giving you an immediate read on whether a break confirms the existing trend or signals a potential reversal.
This is an overlay indicator — all elements are drawn directly on the price chart.
---
Core Concepts
Dual-Layer Structure: External and Internal
The indicator identifies two categories of structural pivots using TradingView's built-in pivot functions:
External structure (major): Pivots requiring a configurable number of bars on each side (default 20). These are the significant swing highs and lows that define the broader trend context. They update less frequently and represent the higher-degree market structure.
Internal structure (minor): Pivots requiring fewer bars on each side (default 7). These fire more frequently and capture the sub-swings that occur within the larger structural moves.
This dual-layer approach mirrors how institutional analysis treats structure: external levels define the direction of the larger trend; internal levels provide precision context for entries and exits within that trend.
Zone Geometry and ATR Thickness
Rather than marking a pivot as a single horizontal line, each pivot is rendered as a rectangular zone. The zone's top and bottom are calculated as:
zoneTop = pivotPrice + (ATR * zoneAtrMult)
zoneBottom = pivotPrice - (ATR * zoneAtrMult)
The default ATR multiplier is 0.5, meaning the zone extends half an ATR above and below the pivot price. This thickness is dynamic — it adjusts to the current volatility of the instrument rather than using a fixed pip or point value. Zones extend to the right as new bars form, keeping them visible as price approaches.
Three-State Zone Lifecycle
Every zone passes through three possible states:
Active (State 0): The zone has formed and not yet been tested. It extends to the right as bars pass, representing untested support or resistance. This is the most significant state — an active zone has not had its interest absorbed.
Swept (State 1): Price has reached the midpoint of the zone (configurable as either a wick touch or a close through the midpoint). A swept zone has been tested and shows that some activity occurred at that level. It may have weakened but is not yet confirmed as broken.
Broken (State 2): Price has closed decisively beyond the zone boundary (above the top for a resistance zone, below the bottom for a support zone). A broken zone stops extending. This state marks the structural failure of that level.
This lifecycle gives actionable information that a single horizontal line cannot. An active zone is very different from a swept zone even if they appear at the same price level.
BOS and CHoCH Classification
When price breaks through the last significant external high or low, the indicator determines whether the break is:
Break of Structure (BOS): The break occurs in the same direction as the current trend. A bullish BOS is a higher high that extends a confirmed uptrend; a bearish BOS is a lower low extending a downtrend. BOS signals trend continuation.
Change of Character (CHoCH): The break occurs against the current trend direction. A CHoCH in a downtrend means price has broken above the last significant swing high — a structural signal that the trend may be reversing. CHoCH signals a potential regime shift, not a confirmed reversal.
Both external and internal structural breaks are tracked separately. An internal CHoCH during an external downtrend, for example, may represent a short-term countertrend move within a larger bearish structure — context that a single-layer tool would miss.
Momentum Normalization
Momentum is calculated as the normalized price change:
momentum = priceChange / stdev(close, lookback)
This expresses the size of recent price movement in terms of its own standard deviation, making the momentum reading comparable across different instruments and volatility regimes.
Target Arrows
When an internal structural break occurs, the indicator draws a directional arrow label pointing toward the next significant external level. This provides a visual read on where price may be targeting within the larger structural context.
---
Features
Dual-layer structure detection: external major pivots and internal minor pivots tracked independently
ATR-dynamic zone thickness — zones adapt to current instrument volatility
Three-state zone lifecycle: Active, Swept, Broken — each visually distinct
Automatic BOS vs. CHoCH classification for both external and internal breaks
Configurable sweep mode: wick-based (high/low touches midpoint) or close-based (close through midpoint)
Equal high/low detection with configurable ATR tolerance to flag double tops/bottoms
Target arrows on internal breaks pointing toward the next external level
Dashboard table showing trend state, momentum, active zone counts, last known structural levels, and last break type
Full visual toggle controls for all overlay elements
Maximum zone count cap per type to maintain chart performance
---
Dashboard Table
A table displayed at the top-right of the chart provides a live summary of structural conditions:
Ext Trend: Current external trend direction (Bullish / Bearish)
Int Trend: Current internal trend direction
Momentum: Normalised momentum value
Ext Zones Active: Number of currently active external zones
Int Zones Active: Number of currently active internal zones
Last Ext High / Low: Price level of the most recent significant external pivot high and low
Last Break: The most recent break type (eBOS, eCHoCH, iBOS, iCHoCH)
---
Color System
External high zones: red
External low zones: white
Internal high zones: teal
Internal low zones: blue
BOS labels: green
CHoCH labels: red
This color separation allows you to immediately distinguish between the two structural layers without reading labels.
---
Input Parameters
External Pivot Length (default 20) — bars required on each side for a major pivot to confirm
Internal Pivot Length (default 7) — bars required on each side for a minor pivot to confirm
ATR Length (default 14) — ATR period used for zone thickness calculation
Zone ATR Multiplier (default 0.5) — controls how wide each zone is relative to ATR
Equal H/L Tolerance (default 0.3 ATR) — how close two pivots must be to be considered equal highs or lows
Sweep Mode (Wick / Close) — whether zone sweeps are triggered by wick touch or candle close through the midpoint
Max Zones Per Type (default 40) — caps the number of active zones drawn per category to preserve chart performance
BOS Lookback (default 30) — bars looked back when checking for structural breaks
Visual Toggles — individual controls for zones, BOS/CHoCH labels, target arrows, and the dashboard table
---
How to Use
Apply to any chart. The indicator will begin plotting zones as enough bars form to confirm pivots at the chosen lengths.
Allow sufficient historical bars to load so that the external pivots have time to confirm — with extLen set to 20, a pivot requires 20 bars after the swing point before it is officially plotted.
Read the external layer first. The external trend (eBOS/eCHoCH sequence) tells you the larger-degree direction. Trade in alignment with this unless you have strong reason to fade it.
Use the internal layer for timing. Internal CHoCH events within an external uptrend can signal pullback entries; internal BOS events in the direction of the external trend can confirm continuation.
Active zones are the most significant. A first-touch of an active zone is generally more meaningful than a return to a swept or broken zone.
When price approaches a zone, check the sweep mode setting and monitor whether price is reaching the midpoint (sweep) or closing through the boundary (break).
The target arrow on an internal break shows the next external level — this is a reference, not a guaranteed target.
---
Limitations
Pivot detection is inherently lagging. A pivot at bar N is only confirmed after N + extLen (or intLen) additional bars have formed. This means zones appear after the fact — the exact pivot price was in the past by the time the zone is drawn.
With longer pivot lengths, the indicator requires more historical bars to display meaningful structure. On short lookback windows or when first applied to a chart, the initial display may show few or no zones until sufficient pivot confirmation has accumulated.
ATR-based zone thickness means zone width changes with volatility. During high-volatility periods, zones become wider and may overlap. During compressed volatility, zones are narrower. Adjust the ATR multiplier if zones are too wide or too narrow for your preferred trading style.
The BOS/CHoCH classification is based on the direction of the previous break relative to the current one. In choppy, range-bound markets, rapid BOS/CHoCH alternation is possible and does not necessarily indicate a trend — it may simply reflect noise.
Zone lifecycle states reflect price behavior relative to the zone midpoint and boundary. They do not predict whether a swept zone will hold or whether a broken zone will become a new support/resistance level.
Maximum zone count limits (default 40 per type) are necessary to maintain chart performance. On instruments or timeframes with many pivot formations, older zones will be removed as new ones are added.
No indicator can classify market structure with certainty in real time. CHoCH signals a potential reversal; it does not confirm one. Always apply additional judgment.
---
Originality Statement
The distinguishing design decisions in this indicator are: zone-based pivot modeling, the three-state lifecycle, and the integrated dual-layer structure system.
Most structure tools mark a swing high or low as a horizontal line at a single price. This indicator models each pivot as a zone with ATR-derived thickness, acknowledging that price reactions do not occur at a tick but within a range that varies with the instrument's current volatility. A 0.5 ATR zone around a pivot is a more honest representation of where liquidity and interest are likely to cluster.
The three-state lifecycle (Active → Swept → Broken) adds information that static horizontal lines cannot convey. An active zone that has never been tested is categorically different from one that has seen a wick test — and both are different from a zone that has been fully broken. Treating these three states identically discards relevant context.
The dual-layer architecture (external major + internal minor) is not simply running the same algorithm twice at different sensitivities. The external layer provides the trend framework; the internal layer provides the tactical sub-structure within it. The BOS/CHoCH classification connects these two layers — an internal CHoCH is interpreted in the context of the external trend direction, not in isolation.
---
Disclaimer
This indicator is provided for educational and informational purposes only. It does not constitute financial advice, investment advice, or a recommendation to buy or sell any security. All trading involves risk, including the possible loss of principal. Past indicator performance does not guarantee future results. Always conduct your own research and consult a qualified financial professional before making any trading decisions.
-Made with passion by officialjackofalltrades
지표
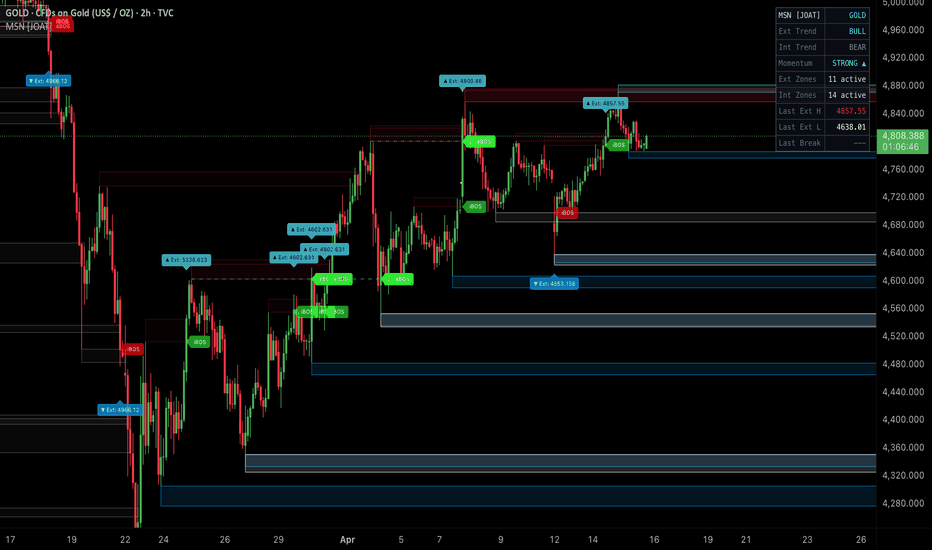
HTF Power of Three ProHTF Power of Three Pro
Overview
Power of Three (PO3) is a Smart Money Concepts framework developed by ICT / Inner Circle Trader. It models every higher-timeframe candle as a three-stage institutional campaign: Accumulation (price consolidates near the open), Manipulation (a liquidity sweep in one direction), and Distribution (expansion and close in the opposite direction). Recognising this structure on higher timeframes gives traders a narrative for where price has been and where it is likely to go within the current candle.
This indicator renders the HTF PO3 candle directly on your lower-timeframe chart as a body box with full wicks, a live countdown timer, and a projection panel to the right of price. Beyond the basic candle, it integrates real footprint delta data from `request.footprint()` to flag whether the net order flow inside each candle supports its directional move — separating candles with genuine institutional conviction from those that closed in a direction without confirming buy or sell pressure.
How It Works
The indicator requests OHLC and time data from a user-selected higher timeframe using `request.security()` with `lookahead_on` so the open is always known at the start of each HTF candle. On each lower-timeframe bar, it accumulates the running high, low, close, and footprint delta. When the HTF candle closes, the completed candle is drawn as a body box with wick lines and a delta label. A live box redraws on every tick to show the in-progress candle.
For footprint data, each lower-timeframe bar requests a `footprint` object via `request.footprint()`. The indicator sums all row deltas to obtain the bar's net delta, then classifies each bar as belonging to the lower or upper half of the current HTF range based on bar midpoint vs. HTF midpoint:
footprint fp = request.footprint(i_fpTicks, i_fpVa, i_fpImb)
float barDelta = na
float barLHD = na // lower-half delta accumulator
float barUHD = na // upper-half delta accumulator
if not na(fp)
array rows = fp.rows()
float totalD = 0.0
for row in rows
totalD += row.delta()
barDelta := totalD
htfMid = (htfH + htfL) / 2.0
barMid = (high + low) / 2.0
if barMid < htfMid
barLHD := totalD
barUHD := 0.0
else
barLHD := 0.0
barUHD := totalD
At the end of each HTF candle, the indicator tests for Volume Concentration Conviction : for a bullish candle, the indicator checks whether a configurable percentage of delta came from bars in the lower half of the range (smart money accumulating below before distributing up). For a bearish candle, it checks whether the majority of sell delta came from the upper half. Candles that pass this test receive a glow halo and a highlighted border, and their delta label is stamped with a concentration percentage badge.
Colour Coding
Body box — bullish : configurable fill (default semi-transparent green) with grey border.
Body box — bearish : configurable fill (default semi-transparent red) with black border.
Conviction highlight — bull : cyan glow halo and border (default #00e5ff) indicating buy delta concentrated in the lower half of range.
Conviction highlight — bear : amber glow halo and border (default #ff9800) indicating sell delta concentrated in the upper half of range.
Delta label — positive : lime green text showing net buy delta.
Delta label — negative : red text showing net sell delta.
Macro windows : yellow fill boxes marking 20-minute ICT macro windows around hourly pivots (EST).
Session boxes : user-defined colour fills for up to three intraday sessions.
Inputs
PO3 Settings
Timeframe — the higher timeframe whose candle the indicator models. Must be strictly above the chart timeframe; a runtime error fires otherwise. Default: 180 (3-hour).
Use NY Midnight — replaces the regular session open with the 00:00 EST candle open for Daily and Weekly timeframes, aligning with ICT's NY Midnight concept. Default: off.
HTF PO3 Appearance
Body (Bull / Bear) — fill colours for bullish and bearish HTF candle bodies. Default: semi-transparent green / red.
Border (Bull / Bear) — border colours for the body box. Default: grey / black.
Wick (Bull / Bear) — wick line colours. Default: semi-transparent grey for both.
Projection Panel
Show Projection Panel — toggles the mini-panel drawn to the right of the last bar showing the live candle alongside recent closed candles. Default: on.
Candles to Show — number of historical HTF candles to display in the panel, not counting the live candle. Range: 1–10. Default: 3.
Right Offset (Bars) — gap in bars between the last chart bar and the left edge of the panel. Increase this if labels overlap price. Default: 15.
Candle Width — width in bars of each panel candle slot. Range: 2–30. Default: 6.
Gap — spacing in bars between candle slots. Range: 1–30. Default: 10.
Show OHLC Labels — prints O/H/L/C price labels to the right of each panel candle. Default: on.
Show Delta Labels — prints the net delta below each panel candle, with a conviction badge where applicable. Default: on.
LTF Projections (Live PO3)
OHLC Price — shows O/H/L/C price labels beside the live HTF candle on the main chart. Toggle and colour configurable. Default: on, silver.
Mode — switches OHLC labels between absolute price and percentage of the current HTF range. "% Range" is useful on instruments with large nominal prices. Default: Normal.
Open Line — draws a dashed line at the HTF open price extending 50 bars to the right. Toggle, colour, and width configurable. Default: on, grey, width 1.
L/H Lines — draws dashed lines at the running HTF high and low extending to the right. Toggle, colour, and width configurable. Default: on, teal, width 1.
Label & Text Size — governs the size of all labels and table text. Options: Auto, Tiny, Small, Normal, Large, Huge. Default: Small.
LTF Projections (Previous PO3)
Show Previous PO3 — draws the prior HTF candle's open, high, low, and equilibrium (midpoint) as persistent lines across the chart. Default: on.
Prev Open Style / Colour / Width — line style, colour, and width for the previous candle's open level. Default: Dashed, orange, width 1.
Prev H/L Style / Colour / Width — line style, colour, and width for the previous candle's high and low. Default: Dashed, yellow, width 1.
Prev EQ Style / Colour / Width — line style, colour, and width for the previous candle's equilibrium (50% level). Default: Dotted, semi-transparent white, width 1.
Extend Previous Opens — projects the open price of up to 10 past HTF candles as faded dotted lines across the chart, useful for identifying historical open-price magnets. Default: off.
Dealing Range
Show Dealing Range — draws the four premium/discount quadrant levels of the live HTF candle: High, Q3 (75%), EQ (50%), Q1 (25%), Low. Default: off.
H/L Style / Colour / Width — appearance of the High and Low boundary lines. Default: Solid, white, width 1.
EQ Style / Colour / Width — appearance of the 50% equilibrium line. Default: Dashed, semi-transparent white, width 1.
Q1/Q3 Style / Colour / Width — appearance of the 25% and 75% quartile lines. Default: Dotted, semi-transparent grey, width 1.
Show Level Labels — annotates each dealing range line with its name (DR High, Q3 75%, etc.). Default: on.
Weekly Profile
Show Weekly Profile — when the HTF timeframe is set to W, draws individual daily candle body boxes inside the weekly range, coloured by day of week. Best used alongside a Weekly timeframe setting. Default: off.
Mon / Tue / Wed / Thu / Fri — fill colours for each day's body box in the weekly profile. Defaults: blue, purple, orange, teal, red (all semi-transparent).
Time & Price
Mode — selects the time-and-price overlay. Off : no overlay. Macros : draws 8 ICT 20-minute macro windows around hourly EST pivots as coloured boxes. Session : draws up to 3 user-defined intraday sessions as coloured boxes. Day of Week : groups weekdays into two PO3-style candles (Group A: Mon–N, Group B: remaining days). Default: Off.
Macro Color / Border — fill and border colours for ICT macro window boxes. Default: semi-transparent yellow fill, solid yellow border.
Session 1 / 2 / 3 — enable toggle, start time (HH:MM, 24h, exchange timezone), end time, and fill colour for each session. Sessions may cross midnight. Defaults: Session 1 08:30–12:00 blue; Session 2 12:00–16:00 green; Session 3 disabled.
Group A: Days 1–N — the number of weekdays (counting from Monday) that form Group A in Day of Week mode. Range: 1–4. For example, 4 groups Mon–Thu together; Friday becomes Group B alone. Default: 4.
Group A / Group B Colour — fill colours for the two day-of-week candle groups. Default: blue / red (semi-transparent).
Footprint Delta
HTF Delta Labels — prints net delta text below each completed HTF candle drawn on the main chart. Default: on.
Live Delta Label — prints the running net delta below the live HTF candle, updating on every tick. Default: on.
Ticks per Row — the price range of each footprint row passed to `request.footprint()`. Smaller values (e.g. 1–2) produce finer row granularity; larger values (e.g. 10+) produce coarser rows and faster execution. Match this to your instrument's typical tick structure. Default: 4.
VA Percent — the Value Area percentage passed to `request.footprint()` for POC/VA calculations. Range: 1–100. Default: 70.
Imbalance % — the ask/bid ratio threshold passed to `request.footprint()` for identifying imbalanced rows. Default: 300.
Positive / Negative Delta Colour — text colours for positive and negative delta labels. Default: lime / red.
Volume Concentration
Show Conviction Highlight — enables the glow halo and border highlight on candles where delta is concentrated in the directionally correct half of the HTF range. Disable to suppress all conviction visuals without changing other settings. Default: on.
Concentration Threshold % — the minimum percentage of total half-range delta that must come from the conviction zone to qualify a candle. At 51% any slight lean qualifies; at 80%+ only strongly concentrated candles qualify. Range: 51–100. Default: 60.
Bull Conviction / Bear Conviction Colour — glow and border colours for bullish and bearish conviction candles. Default: cyan (#00e5ff) / amber (#ff9800).
Highlight Border Width — border width of the conviction glow box and body border. Range: 1–4. Default: 2.
PO3 Info Table
Range — sets whether the range row in the info table displays as a price difference or as a tick count. Default: Price.
Position — vertical (top / middle / bottom) and horizontal (left / center / right) position of the info table. Default: middle right.
Label / Text Colour — background colour for label cells and text colour for value cells. Default: semi-transparent grey labels, white text.
Usage Notes
Set the timeframe to one step above your trading chart. On a 15-minute chart, a 3-hour or 4-hour HTF candle gives you the PO3 campaign context most traders use for intraday bias.
Use the conviction highlight to filter entries. A bullish HTF candle with a cyan glow means buy delta was concentrated in the lower range half — consistent with institutional accumulation. A candle that closes bullish without conviction may be a manipulation leg rather than a genuine distribution.
The Dealing Range levels (H, Q3, EQ, Q1, L) provide premium and discount zones for the current HTF candle. Entering long below EQ and short above EQ aligns with the PO3 distribution model.
Enable Extend Previous Opens to track historical HTF open prices as potential support and resistance. Price frequently returns to prior HTF opens before continuing.
In Macros mode, the 8 ICT windows mark the 20-minute periods where London and New York session pivots are typically formed. These are common manipulation windows within the daily PO3 cycle.
The Ticks per Row input should match your instrument's structure. For index futures (e.g. ES, NQ), 4–10 ticks per row is typical. For forex pairs with 5-digit pricing, 1–2 ticks may be more appropriate.
The indicator requires a higher timeframe than the chart. Setting the timeframe equal to or below the chart timeframe triggers a runtime error by design.
Footprint data requires a TradingView plan that includes volume footprint access. If `request.footprint()` returns `na` consistently, check your plan level and confirm the symbol provides tick data.
Recommended Pairings
Works well alongside an order block or fair value gap indicator to confirm that PO3 manipulation legs are sweeping known liquidity zones.
Pair with a session VWAP indicator to see how the HTF open relates to volume-weighted price — divergence between the HTF open and VWAP is a common manipulation signal.
지표

지표