지표

DaXtreme SPY Command Center**DaXtreme SPY Command Center** is a rule-based trading system designed specifically for SPY options trading. Rather than predicting market direction, it waits for multiple independent confirmations before generating a trade signal. The strategy is built around a 9:30–9:45 AM Opening Range Breakout (ORB), using the ORB High and ORB Low as the session's primary decision levels. Once the opening range is established, the script evaluates trend, momentum, participation, and market structure before issuing a BUY CALL or BUY PUT signal.
The system combines VWAP, the 9 EMA, and the 21 EMA to identify trend direction. Price must remain on the correct side of VWAP while the 9 EMA aligns with the 21 EMA and continues sloping in the direction of the trade. It also uses both a 5-minute RSI for overall market bias and an Entry RSI for immediate momentum confirmation. A Cumulative Volume Delta (CVD) proxy measures buying and selling pressure to help confirm institutional participation.
To reduce low-quality trades, the script includes several guardrails. An Extended Move Filter prevents entries after price has already moved too far from the 9 EMA, reducing the likelihood of chasing exhausted moves. A VWAP Chop Filter suppresses signals during sideways conditions where price repeatedly crosses VWAP without establishing direction. A Pullback Rejection Filter requires price to break the ORB, retest the level, and reject back in the direction of the trend before a signal is allowed, improving entry quality over simple breakout strategies.
Each potential trade receives a Signal Score from 0 to 10 based on ten independent confirmations, including VWAP position, EMA alignment, EMA trend, ORB retest, pullback rejection, RSI strength, CVD direction, and extension status. This score is converted into a trade grade ranging from A+ to C, allowing only high-quality setups to generate alerts. A configurable minimum score lets the trader control how selective the system should be.
The integrated Command Center dashboard provides a real-time overview of the current market environment. It displays the active Signal Score, star rating, trade grade, trade status, ORB High and Low, VWAP bias, 9 EMA trend, 5-minute RSI, Entry RSI, CVD direction, confidence percentage, market state, contract mode, and ORB status. Market conditions are classified as Trend, Range, Chop, or Squeeze to help the trader adapt expectations throughout the session.
Trade status progresses through a structured workflow of WAIT, CALL READY, BUY CALL, MANAGE CALL, PUT READY, BUY PUT, MANAGE PUT, and EXIT, giving clear guidance throughout the life of each trade. Exit warnings are generated whenever price loses the 9 EMA or VWAP for long positions, or reclaims those levels during short positions, signaling that the original trade thesis may be weakening.
The Command Center is optimized for SPY on the 5-minute timeframe and is intended for both 0DTE and 1DTE option contracts. It is designed to reduce emotional decision-making by requiring multiple layers of confirmation before entry and by providing objective guidance for trade management and exits. The overall philosophy is simple: trade only when structure, trend, momentum, and participation all agree, allowing quality to take precedence over quantity.
지표

Swing Momentum Pullback Strategy + ChecklistSwing Momentum Pullback Strategy + Checklist
This indicator is a complete swing trading system designed to help traders identify
trend breakouts and low-risk momentum pullbacks, optimized for the Daily Timeframe.
The script combines a long-term trend filter, automated resistance detection, and
specific entry triggers into a single chart overlay, along with a real-time Strategy
Checklist Dashboard that confirms setups at a glance.
─────────────────────────────────
🎯 CORE COMPONENTS
─────────────────────────────────
▸ Trend Filter (Purple Line)
200-period Simple Moving Average (SMA). Acts as the long-term trend filter.
Long setups are only considered when price is above this line.
▸ Momentum Guide (Orange Line)
8-period Exponential Moving Average (EMA). Tracks short-term momentum.
In strong trends, price tends to "ride" this line. Entries are sought when
price pulls back to test this area.
▸ Multi-Month Resistance Line (Orange Horizontal)
Automatically plots the highest price over a user-defined lookback period (in months).
Instantly visualizes the key resistance level a stock must break out above.
▸ Strategy Checklist Dashboard
A real-time table that evaluates Trend, Resistance, and Momentum conditions to
display a clear ✅ ENTER, 🚀 GAP UP, or ⏳ WAIT signal.
─────────────────────────────────
🛠 HOW IT WORKS — TWO SETUPS
─────────────────────────────────
1. The Daily Gap Up ("GAP" Label)
Fires when a stock gaps up with strong overnight momentum.
• Open is at least X% above the prior day's Close (adjustable, default 3%)
• Open is above the prior day's High
• Price must be above the 200 SMA
→ Marked with a green "GAP" label on the chart
2. The Trend Pullback ("ENTER" Signal)
A trend-following entry to join an existing move at lower risk.
• Stock is in an uptrend (above 200 SMA)
• Price dips down to touch or test the 8 EMA
• Candle shows a pullback (red candle or lower close) — confirms we're buying
a dip, not chasing a top
→ Dashboard "Action Signal" turns orange and displays ✅ ENTER
─────────────────────────────────
📋 CHECKLIST DASHBOARD — READINGS
─────────────────────────────────
Trend (> 200 SMA):
🟢 Bullish — Price is in an uptrend. Safe to look for entries.
🔴 Bearish — Price is below the 200 SMA. Stay out.
Above Resistance?:
🟢 Breakout — Price has cleared the multi-month resistance line.
⚪ --- — Price is currently below the key breakout level.
Near 8 EMA?:
🟢 Yes — Price is near the value zone for a potential pullback entry.
Action Signal:
🚀 GAP UP — Strong momentum gap detected.
✅ ENTER — Valid pullback entry confirmed.
⏳ WAIT — No qualifying setup on the current bar.
─────────────────────────────────
⚙️ SETTINGS
─────────────────────────────────
- Momentum EMA Length — Default: 8. Controls pullback line sensitivity.
- Trend SMA Length — Default: 200. Long-term trend filter period.
- Gap Up % Threshold — Default: 3.0%. Minimum overnight gap to trigger signal.
- Resistance Lookback (Mo.) — Default: 3. Months used to find the key resistance level.
- Table Position — Move the checklist dashboard to any corner of your chart.
─────────────────────────────────
⚠️ DISCLAIMER
─────────────────────────────────
For educational purposes only. Not financial advice.
Always manage your risk and use a stop loss. 지표

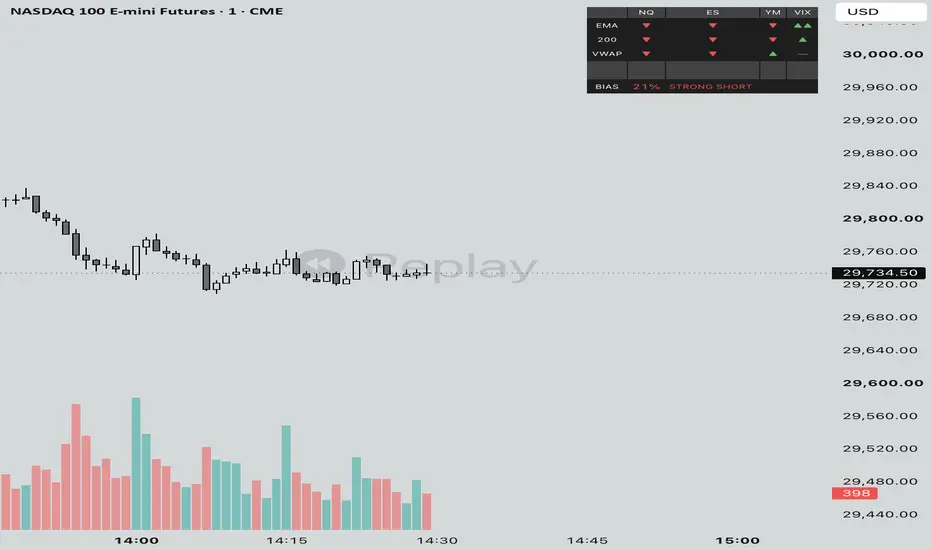
Correlated Assets TableA quick cross-check on whether the rest of the complex agrees with you. It tracks NQ, ES, YM, and the VIX and shows, for each, where price sits against an EMA envelope. A move with all three indices pulling the same way and VIX cooperating is worth more than NQ running by itself. Only take your chart's signal when the table backs it, and treat a split as a yellow light. Each symbol comes in through request.security, so the values settle as bars close. It's confirmation, not a precise entry clock.A quick cross-check on whether the rest of the complex agrees with you. It tracks NQ, ES, YM, and the VIX and shows, for each, where price sits against an EMA envelope. A move with all three indices pulling the same way and VIX cooperating is worth more than NQ running by itself. Only take your chart's signal when the table backs it, and treat a split as a yellow light. Each symbol comes in through request.security, so the values settle as bars close. It's confirmation, not a precise entry clock. 지표

지표

지표

지표
ADX Intraday
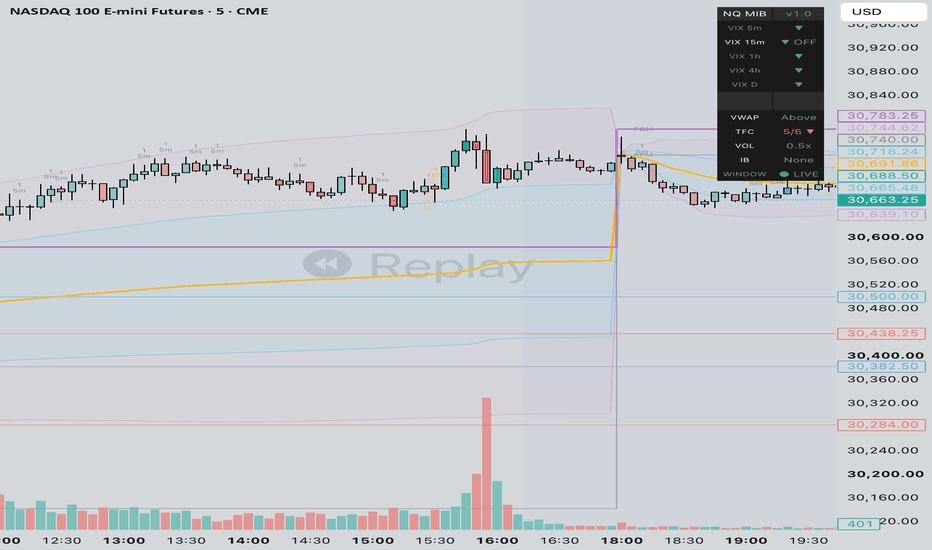
A trend tool for NQ on the 5-minute, aimed at the first couple hours after the open. ADX is the gatekeeper. If it's under the threshold the market's chopping and you do nothing. When ADX says we're trending, +DI versus -DI gives direction, VWAP and the 20 EMA set the bias, and a candle handles the timing. Long wants a trending read, +DI over -DI, price on the right side of VWAP and the EMA, and a confirming bar. Short is the flip. The ADX filter is the whole point, it keeps you out of the grind. Single timeframe, no outside data pulls, so nothing repaints. 지표

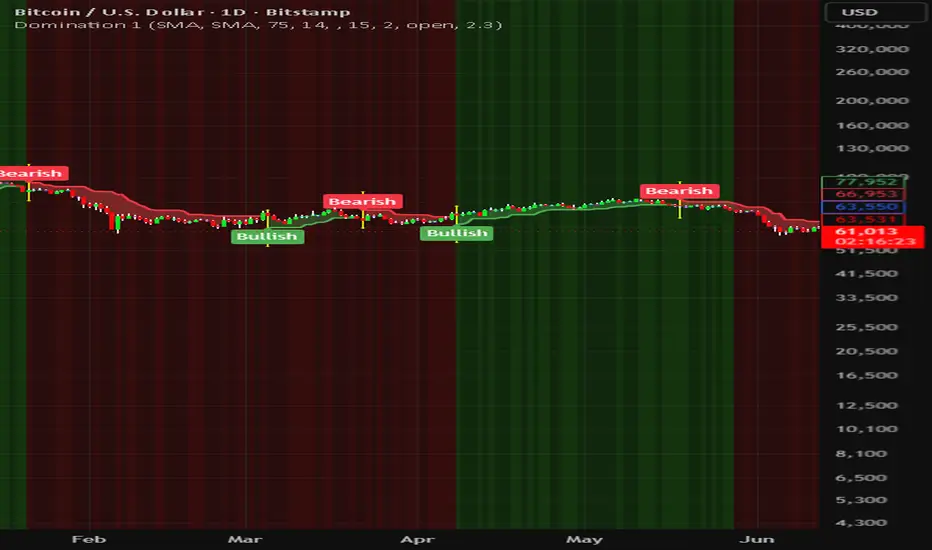
Multiple Timeframe Six Moving AveragesMulti TF MAs — plots six moving averages (8 / 20 / 50 / 88 / 200 / 500), each switchable between SMA, EMA, or Hull, on the current chart timeframe or a higher one you select. Volume-independent, so it works on any symbol — stocks, futures, ratios, or index/data feeds.
How to read it: it's a trend stack.
Price above a stacked, rising set → uptrend (offense)
Below a stacked, falling set → downtrend (defense)
Tangled/crossing → no trend (neutral)
The lines, by horizon: 8/20 = short-term tape · 50 = swing trend · 88 = quarterly · 200 = cyclical regime · 500 = secular regime.
Credit to BTCMoonBear 지표

Multi-Timeframe Trend Table (Weighted)**Multi-Timeframe Trend Table (Weighted) — Market Bias Dashboard**
This indicator is a **multi-timeframe trend analysis system** designed to evaluate overall market direction using a weighted combination of **ATR trend structure, Stochastic RSI momentum, and Moving Averages** across multiple timeframes.
It aggregates data from higher to lower timeframes into a single **bias scoring table**, giving traders a clear, structured view of market sentiment and directional strength.
---
### 🔍 Core Concept
Instead of relying on a single timeframe or indicator, this tool builds a **composite market bias model** by:
* Analysing trend strength across multiple timeframes (Monthly → 1M)
* Applying weighted importance to each timeframe
* Combining three key systems:
* ATR-based trend direction (volatility structure)
* Stochastic RSI momentum shifts
* Moving Average bias filter
---
### 📊 Key Features
• **Multi-Timeframe Structure**
* Monthly, Weekly, Daily, 4H, 1H, 30m, 15m, 1m analysis
* Hierarchical trend evaluation from macro → micro
• **Weighted Bias System**
* Assigns importance to each timeframe (customisable)
* Higher timeframes dominate overall market direction
* Produces a final **bullish / bearish bias score**
• **Triple Indicator Confirmation**
Each timeframe uses:
* ATR trend logic (volatility direction)
* Stochastic RSI (momentum confirmation)
* Moving Average filter (trend bias)
• **No Repainting Logic**
* Uses confirmed higher timeframe closes only
* Prevents false real-time signal shifts
* Ensures stable, reliable bias readings
• **Signal Threshold System**
* Custom X-signal trigger based on bias strength
* Highlights strong directional conviction zones
---
### 📊 How to Use
**Bullish Bias**
* Higher timeframes align bullish
* Weighted score exceeds threshold
→ Market favours long setups
**Bearish Bias**
* Higher timeframes align bearish
* Weighted score exceeds threshold
→ Market favours short setups
**Neutral / Mixed Bias**
* Conflicting multi-timeframe signals
→ Avoid directional trading or wait for alignment
---
### ⚠️ Best Practice
This is a **market context tool**, not a standalone entry system.
For best performance combine with:
* Liquidity zones
* Market structure (BOS / CHoCH)
* Support & resistance levels
* Entry triggers from lower timeframe setups
---
### 🚀 Ideal For
* Swing traders
* Position traders
* Smart money / structure-based trading
* Multi-timeframe confirmation strategies
* Crypto, Forex, indices
---
### 🧠 Trading Philosophy
**Higher timeframes define direction.
Lower timeframes define execution.
This tool bridges both into one bias model.**
---
**Trade with alignment, not randomness.** 지표

지표

지표

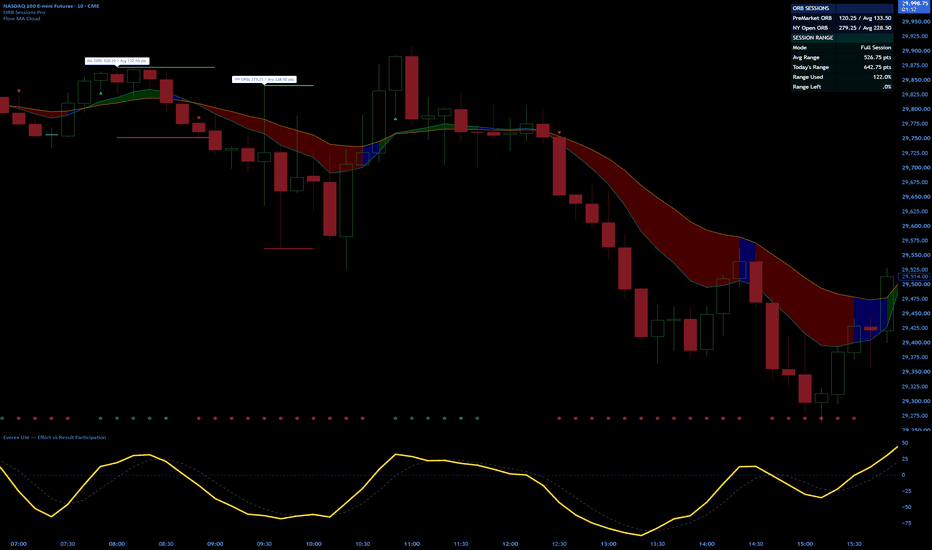
Flow MA CloudFlow MA Cloud is a clean trend and market flow visualization tool built around the relationship between two fully configurable moving averages.
Unlike traditional moving average crossover indicators that focus solely on entry signals, Flow MA Cloud is designed to help traders quickly identify directional bias, trend strength, and changes in participation through dynamic cloud coloring and optional flow-state confirmation.
Supported moving average types include:
• SMA (Simple Moving Average)
• EMA (Exponential Moving Average)
• WMA (Weighted Moving Average)
• RMA (Running Moving Average)
• VWMA (Volume Weighted Moving Average)
• HMA (Hull Moving Average)
** Suggested Default Setup: 9 EMA / 21 EMA
Both moving averages can be configured independently, allowing traders to create anything from traditional EMA trend clouds to custom flow and trend models.
** Pairs well with ORB Sessions Pro for directional bias and Everex Lite for participation confirmation.
Additional features include:
• Dynamic bullish, bearish, and neutral cloud visualization
• Optional slope-based flow confirmation
• Bullish and bearish crossover markers
• Optional background bias highlighting
• Custom alert conditions for crossover and flow-state changes
• Adjustable colors, line widths, and visual settings
The cloud changes color based on both moving average positioning and directional slope, helping traders distinguish between strong trends, weakening trends, and neutral market conditions.
Flow MA Cloud is designed to be simple, visually clean, and easy to integrate into existing trading workflows for futures, stocks, forex, and cryptocurrency markets.
Real Trading. Real Testing. Real Results.
### Related Indicators
Flow MA Cloud is part of the Traders Workshop indicator suite.
For a complete market workflow, consider pairing it with:
• ORB Sessions Pro — Tracks Pre-Market and NY Open Opening Ranges, session statistics, average range expectations, and expansion levels.
• Everex Lite — A streamlined Effort vs Result indicator designed to visualize participation and directional flow.
Together, these tools help traders answer three critical questions:
1. Where is the market likely to move? (ORB Sessions Pro)
2. What is the current trend direction? (Flow MA Cloud)
3. Is participation supporting the move? (Everex Lite)
Real Trading. Real Testing. Real Results.
지표
지표

MTF MA & MACD & StochRSI (pro)Multi-Timeframe MA & MACD & StochRSI (Pro)
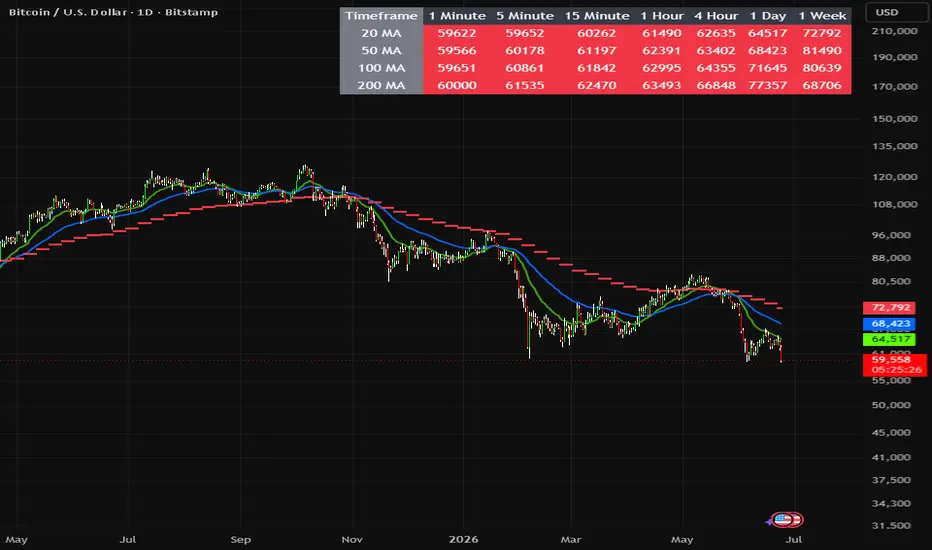
The Multi-Timeframe MA & MACD & StochRSI (Pro) is a professional multi-timeframe confluence dashboard built to help traders quickly identify trend direction, momentum strength, and cross-timeframe alignment in one clean visual layout.
This tool combines Moving Averages, MACD logic, and StochRSI cross conditions across multiple timeframes, allowing traders to reduce chart clutter and improve decision-making without constantly switching between charts.
Designed for traders who rely on confluence, top-down analysis, and momentum confirmation.
Core Purpose
This indicator answers one key trading question:
Are my moving averages, momentum, and oscillator signals aligned across multiple timeframes?
By tracking multiple confirmations together, traders can identify stronger trend setups while filtering weaker or conflicting market conditions.
Multi-Timeframe Dashboard
The dashboard scans and displays data across:
1 Minute
5 Minute
15 Minute
1 Hour
4 Hour
1 Day
1 Week
This provides both short-term and higher-timeframe market alignment.
Core Features
1) Multi-Timeframe Moving Average Analysis
The indicator tracks:
20 EMA
50 EMA
For each timeframe it checks whether price is:
Above EMA → Bullish bias
Below EMA → Bearish bias
This gives a quick directional read of market structure.
2) MACD Confirmation Logic (Enhanced)
Unlike a basic MACD crossover, this version uses stricter logic for stronger confirmation.
Buy Condition
Histogram > 0
MACD Line > 0
Signal Line > 0
Sell Condition
Histogram ≤ 0
MACD Line ≤ 0
Signal Line ≤ 0
Neutral
If momentum is mixed, the dashboard displays Neutral.
This helps remove weaker crossover noise and improves momentum quality.
3) StochRSI Cross Confirmation
The dashboard tracks StochRSI cross alignment using:
RSI calculation
Stochastic range
Smoothed %K line
Smoothed %D line
Buy
%K > %D
Sell
%K < %D
Neutral
Flat or undefined conditions
This adds momentum confirmation beyond moving averages.
4) Non-Repainting Multi-Timeframe Logic
The script uses stable request.security() calls with completed timeframe bars to reduce repainting behaviour and improve consistency.
Useful for traders who want cleaner higher-timeframe confirmation.
5) On-Chart Moving Average Overlay
In addition to the dashboard, the indicator plots:
Current timeframe 20 EMA
Current timeframe 50 EMA
These allow traders to visually track trend support/resistance directly on price.
6) Weekly MA Overlay
Optional higher-timeframe moving averages can also be shown directly on the active chart:
Weekly 20 EMA
Weekly 50 EMA
This helps identify:
Macro trend direction
Dynamic support/resistance
Higher timeframe bias
Confluence zones
Can be toggled ON/OFF in settings.
7) Adjustable Table Text Size
The dashboard supports text scaling for cleaner viewing:
Tiny
Small
Normal
Large
Huge
Useful for different monitor sizes and chart layouts.
Colour Logic
Green
Bullish / Buy
Price above EMA
Positive MACD alignment
StochRSI Buy condition
Red
Bearish / Sell
Price below EMA
Negative MACD alignment
StochRSI Sell condition
Grey
Neutral / Mixed
No strong directional bias
This allows fast visual scanning across all timeframes.
Best Used For
This indicator is ideal for:
Multi-timeframe trend analysis
Momentum confirmation
Confluence trading
Swing trading
Intraday trading
Scalping
Breakout confirmation
Trend-following systems
Works well on:
Crypto
Forex
Indices
Stocks
Commodities
How to Use It
Step 1 – Check EMA Alignment
Look for price above or below the 20 and 50 EMA across multiple timeframes.
Step 2 – Confirm MACD Strength
Check whether MACD is fully aligned (not just crossing).
Step 3 – Confirm StochRSI Direction
Look for %K vs %D agreement.
Step 4 – Find Confluence
The strongest setups often occur when:
MA structure aligns
MACD aligns
StochRSI aligns
Higher timeframe bias supports the trade
Trading Framework Example
A strong bullish setup might show:
Price above 20 EMA
Price above 50 EMA
MACD Buy
StochRSI Buy
Weekly MA acting as support
A strong bearish setup may show the inverse.
Summary
Multi-Timeframe MA & MACD & StochRSI (Pro) is a high-confluence dashboard built for traders who want cleaner multi-timeframe trend analysis, stronger momentum confirmation, and faster market alignment in one professional workflow. 지표

Multi-Timeframe MA CrossMulti-Timeframe MA Cross (MTFMAC) is a professional-grade trend analysis tool designed for traders who wish to view market structure across multiple timeframes at a glance. It consolidates key exponential moving averages (EMAs) into a single dashboard, helping traders make quick, informed decisions based on price alignment with moving averages.
This indicator provides a clear visual overview of trend direction and alignment from intraday (1-minute) to weekly charts. By highlighting whether price is above or below key EMAs and signalling EMA crossovers, traders can quickly identify bullish or bearish trends, trend strength, and high-probability trade setups.
Key Features
Multi-timeframe EMA dashboard (1 min → 1 week)
Real-time trend alignment for 20, 50, 100, and 200 EMAs
Visual "Above/Below" signals for each EMA
Weekly EMA overlays for higher timeframe context
Alerts for bullish/bearish alignment and EMA crosses
Fully customisable EMA lengths and visual settings
Professional table and chart display, overlaying price
How It Works
Compares the current price to 20, 50, 100, and 200 EMAs across multiple timeframes.
Colours indicate whether price is above (green) or below (red) the EMA.
Weekly EMA lines are plotted as dashed or circle-style overlays for macro trend context.
Alerts notify the trader when:
All EMAs align bullishly or bearishly
20 EMA crosses above or below 50 EMA
Best Use Cases
Trend-following strategies
Multi-timeframe confirmation
Swing and intraday trading
Spotting market bias and trend reversals
High-probability trade filtering
Alerts
Bullish Trend Alignment: All EMAs in ascending order, price above EMAs
Bearish Trend Alignment: All EMAs in descending order, price below EMAs
Bullish EMA Cross: 20 EMA crosses above 50 EMA
Bearish EMA Cross: 20 EMA crosses below 50 EMA
Notes and Disclaimers
This indicator does not repaint; all signals are based on confirmed bar data.
Use as a decision-support tool, not as sole trade advice. Combine with risk management.
Optimised for clear visualisation and multi-timeframe analysis. 지표

지표

지표

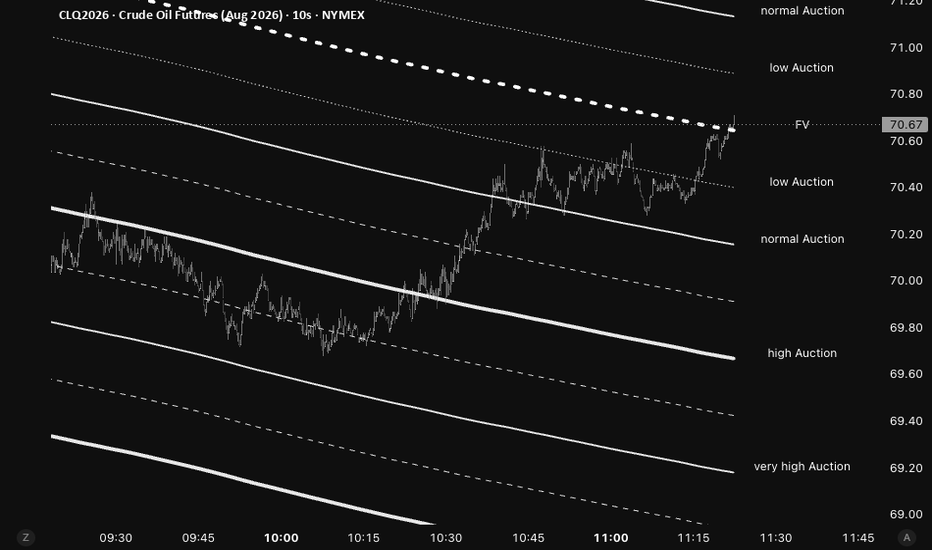
8 SMA Bands (Points) Auction [MTF]8 SMA Bands (Points) Auction is a multi-timeframe overlay indicator that plots 8 different Simple Moving Averages (default length 2048) from a higher timeframe, along with symmetric point-based bands around each MA.It creates a layered "auction zone" system using a base point offset (default 0.2441405 — Gann-inspired) multiplied from 1× to 8×. These bands are not percentage or ATR-based, but fixed price points, making them geometrically proportional in absolute price distance.
The bands are grouped into 5 visual "Auction" levels:
Low Auction (Level 1)
Normal Auction (Level 2)
High Auction (Level 4)
Very High Auction (Level 6)
Extreme Auction (Level 8)
It also highlights one MA as "FV" (Fair Value).
Key Features: Higher Timeframe MTF (default Daily)
Individual length and fine-tune adjustment for each of the 8 MAs
Master base offset control (easy to switch between Gann / Murrey Math styles)
Clean right-side labels for each auction level
Primary Use Cases:
1. Auction / Market Profile Style Trading
Visualizes different "auction intensities" or value areas.
Price moving into High/Very High/Extreme Auction zones often signals over-extension or potential reversal.
Normal Auction area acts as a fair value / equilibrium zone.
2. Dynamic Support & Resistance
The bands serve as layered S/R levels, especially powerful when using Daily or Weekly MAs on lower timeframes (e.g., 15m, 1H, 4H).
3. Fair Value Trading
The central MA (labeled FV) is used as a mean-reversion magnet.
Traders look for entries toward FV from outer auction zones.
4. Trend Strength & Exhaustion
When price sustains in Extreme Auction territory → strong trend.
Rejection or failure to hold outer bands → possible exhaustion.
5. Institutional / Smart Money Concepts
Helps identify premium and discount zones relative to higher-timeframe fair value.
Best Suited For:
Futures, Forex, and large-cap stocks
Swing and intraday traders who like higher-timeframe bias
Traders familiar with Gann, Murrey Math, or Auction Market Theory
This indicator is particularly useful for context — giving you a clear visual map of how far price has extended from fair value on multiple levels simultaneously.
지표
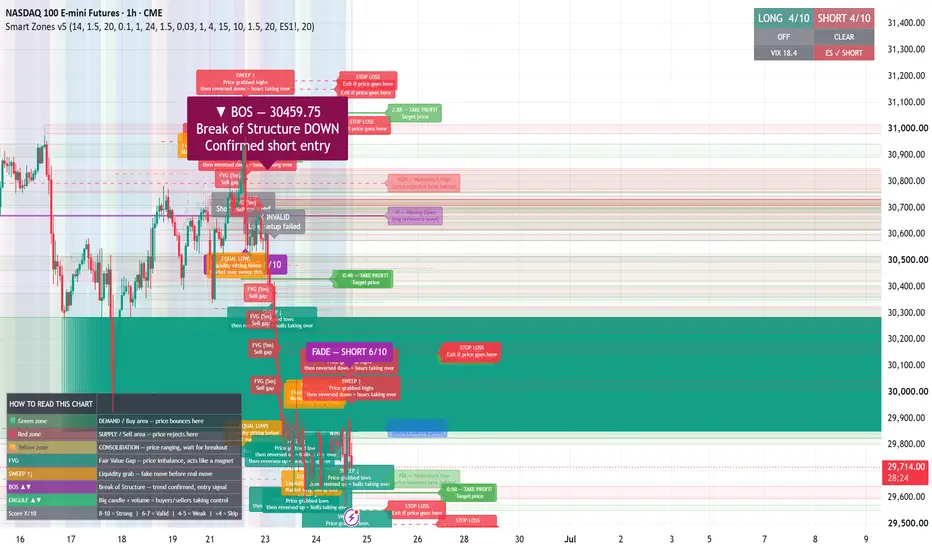
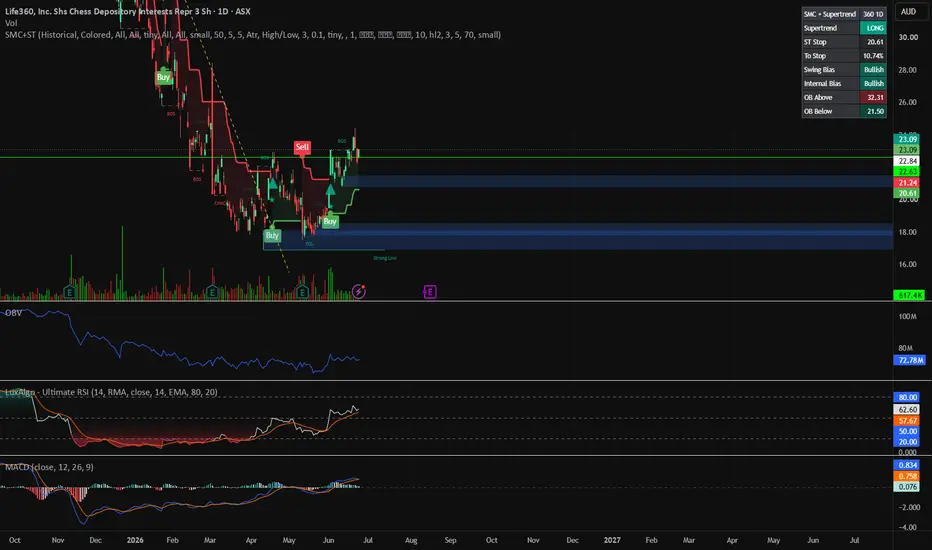
PokoTrader - SMC + Supertrend ConfluenceThis indicator combines LuxAlgo's Smart Money Concepts market-structure toolkit with the
classic Supertrend trend filter, then adds a confluence layer that highlights the moments
where the two agree.
CREDITS & LICENSE
- Smart Money Concepts logic is © LuxAlgo, published under CC BY-NC-SA 4.0. This script is
a derivative work released under the same license (open-source, non-commercial, share-alike).
- The Supertrend component is ported to Pine v5 from the widely used Pine v4 "Supertrend"
by KivancOzbilgic.
All original work belongs to those authors; this publication only adds the integration layer
described below.
WHAT IT DRAWS
- Full SMC suite: internal & swing structure (BOS / CHoCH), order blocks, fair value gaps,
equal highs/lows, strong/weak swing points, premium-discount zones and multi-timeframe levels.
- Supertrend trend line, buy/sell flip markers and trend highlighter.
WHAT THIS MASHUP ADDS (original contribution)
1. Confluence engine - a star marker prints only when a Supertrend flip lines up with a recent
CHoCH/BOS, an order-block tap, or a fresh fair value gap. A single dynamic alert reports which
components agreed (e.g. "LONG confluence: Supertrend flip + Structure OB").
2. Trend filter - structure breaks that fire against the Supertrend direction are automatically
faded, so with-trend breaks stand out from counter-trend noise.
3. Dashboard - a compact panel showing Supertrend direction, the live stop price and % distance
to it, swing bias, internal bias, and the nearest order block above and below price.
4. Repaint guard - the combined alert can be restricted to confirmed bar closes.
HOW TO USE
- Bias with the Supertrend direction; treat the star confluence marks as higher-conviction
entries where market structure, an order block, or an FVG agrees with a fresh trend flip.
- Use the dashboard "To Stop %" as a ready-made trailing-stop reference.
- In the Confluence settings group, set the structure lookback window and choose which
components count (structure / order block / FVG). Adjust the counter-trend fade to taste.
SETTINGS GROUPS
Smart Money Concepts, Real Time Internal/Swing Structure, Order Blocks, EQH/EQL, Fair Value
Gaps, Highs & Lows MTF, Premium & Discount Zones, Supertrend, Confluence, Dashboard.
NOTES
For education and research only - not financial advice. Some SMC elements (FVG, MTF levels)
use higher-timeframe lookahead for display and can repaint on the forming bar; the combined
alert is gated to confirmed bars by default to avoid acting on that. 지표

지표

ALMA Slope, ADX & Cross System Strategy Description : OverviewThe Advanced ALMA Slope, ADX & Cross System v7.6 is a high-performance, modular trend-following strategy built on Pine Script v6. Designed for algorithmic traders, this system leverages the mathematical precision of the Arnaud Legoux Moving Average (ALMA) to eliminate the lag inherent in traditional moving averages while maintaining superior smoothing capability.What sets this system apart is its Dynamic Volatility Adaptability and Bar-Confirmed Re-entry Engine, creating a highly flexible architecture capable of navigating volatile crypto assets, forex, or equities with minimal whipsaws.Key Features & Architecture1. Low-Lag ALMA Core with Slope AccelerationInstead of relying on simple price crosses, the primary engine tracks the directional derivative (Slope) of the ALMA.Slope Entry Mode: Filters out flat market micro-movements by entering precisely when the slope crosses the zero threshold.Acceleration Filter: Requires the momentum of the slope to build over a user-defined number of bars before validating a setup, preventing premature entries during false breakouts.2. Multilayered Trend Validation (ADX & DMI)To ensure trades are only executed during high-probability macro trends, the strategy integrates an ADX filter. It verifies not only whether trend strength is above a structural threshold (e.g., 20) but optionally guarantees that trend intensity is accelerating ($ADX_t > ADX_{t-1}$).3. Smart (Dynamic) Volatility-Adjusted Trailing StopStandard percentage-based trailing stops fail when market regimes shift from low-volatility accumulation to high-volatility expansion. This version implements an innovative ATR-to-SMA ratio multiplier:$$\text{Volatility Multiplier} = \frac{\text{Current ATR}}{\text{Historical ATR SMA}}$ OTC:WHEN the market becomes highly volatile, the system automatically expands the Trailing Start and Follow distances to give the asset "room to breathe" and avoid premature stop-outs.When the market calms down, the brackets contract to lock in profits early.4. Bar-Confirmed Mid-Trend Re-entry EngineMissed the initial breakout? The strategy features a sophisticated re-entry mechanism that tracks the last closed position's state. If a strong trend resumes after an early exit, it checks a dedicated cooldown timer and compares the current slope acceleration against the exit momentum, allowing safe mid-trend re-routing without chasing spikes.5. Flexible Execution and Risk ManagementDual Entry/Exit Protocols: Toggle between Slope Tracking and Price/ALMA or Price/VWMA crosses dynamically.Intrabar Reflexive Guard Rails: While strategy entries/exits are bar-confirmed to prevent repaint and slippage, the Stop Loss (SL), Take Profit (TP), and Trailing Stops run on real-time intrabar ticks for absolute capital protection.Settings & Optimization GuideTrending Markets (Crypto/Growth Stocks): Keep Adapt Percent TS with ATR active to ride massive extensions while protecting your downside during unexpected flash crashes.Mean-Reverting Markets (Forex/Indices): Consider turning on Exit on Slope Deceleration with a 3-bar lookback to catch micro-reversals before they eat into realized gains.Disclaimer: Past performance does not guarantee future results. This script is highly parameter-driven; users are strongly encouraged to utilize TradingView's Strategy Tester to optimize the ALMA period, ADX thresholds, and risk brackets for their specific asset class and timeframes before committing live capital. 전략

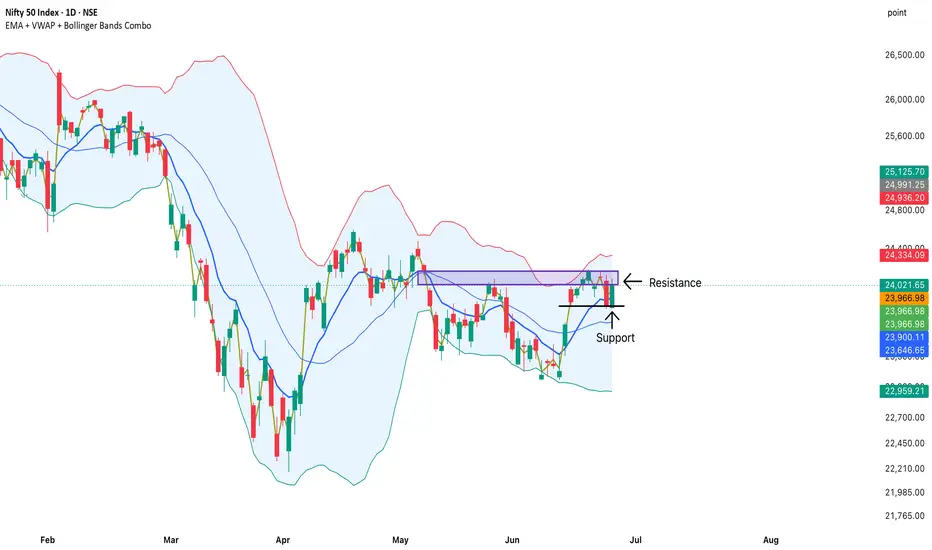
EMA + VWAP + Bollinger Bands Combo# EMA + VWAP + Bollinger Bands Combo
This indicator combines three of the most popular technical analysis tools into a single customizable overlay: Exponential Moving Average (EMA), Volume Weighted Average Price (VWAP), and Bollinger Bands.
Instead of adding multiple indicators to your chart, you can manage all three from a single script and enable only the tools you need.
### Features
✅ **Exponential Moving Average (EMA)**
* Customizable length and source
* Optional display toggle
* Useful for identifying trend direction and dynamic support/resistance
✅ **Volume Weighted Average Price (VWAP)**
* Supports Session, Weekly, Monthly, Quarterly, and Yearly anchors
* Optional VWAP deviation bands
* Useful for institutional price analysis and intraday trend confirmation
✅ **Bollinger Bands**
* Customizable length and standard deviation settings
* Supports SMA, EMA, RMA (SMMA), WMA, and VWMA as the basis
* Useful for volatility analysis, breakout detection, and mean-reversion setups
### Display Combinations
The indicator allows any combination of:
* EMA only
* VWAP only
* Bollinger Bands only
* EMA + VWAP
* EMA + Bollinger Bands
* VWAP + Bollinger Bands
* EMA + VWAP + Bollinger Bands
### How Traders Commonly Use It
**Trend Following**
* Price above EMA and VWAP can indicate bullish conditions.
* Price below EMA and VWAP can indicate bearish conditions.
**Intraday Trading**
* VWAP acts as a key institutional reference level.
* VWAP bands can help identify stretched price conditions.
**Volatility Analysis**
* Bollinger Band expansion may indicate increasing volatility.
* Bollinger Band contraction may indicate potential breakout conditions.
**Confluence Zones**
* Areas where EMA, VWAP, and Bollinger Bands align can provide stronger support and resistance levels.
### Notes
This indicator is designed as a convenience tool that combines multiple commonly used overlays into a single script, helping reduce chart clutter while maintaining flexibility and customization.
지표