지표

Liquidity Magnet ClustersLiquidity Magnet Clusters
Liquidity Magnet Pro is an educational liquidity-mapping indicator designed to help traders study where price may interact with prior volume concentration, untested Point of Control levels, value-area boundaries, and sweep-based liquidity events.
This script is not a trading strategy and does not place or simulate orders. It does not provide backtested performance results, win-rate claims, profitability claims, or financial advice. Its purpose is to organize liquidity-related information directly on the chart so traders can use it as a research and decision-support tool alongside their own market structure, risk management, and testing process.
What the script does
The indicator combines five main analytical components:
1. Rolling Volume Profile
The script builds an internal rolling volume profile from recent bars. It divides the selected lookback range into price bins and distributes each bar’s volume across the bins touched by that bar. From this profile, it identifies:
- POC: the price bin with the highest accumulated volume.
- VAH: the upper boundary of the selected value area.
- VAL: the lower boundary of the selected value area.
- HVN zones: high-volume areas that may represent prior acceptance or liquidity concentration.
- LVN zones: low-volume areas that may represent thinner auction areas or faster price traversal zones.
This profile is calculated inside Pine Script and does not rely on an external volume-profile feed.
2. Naked POC Tracker
The script snapshots the rolling POC from a selected anchor timeframe, such as 4H, Daily, Weekly, or Monthly. These historical POC levels remain active until price tests them or until they expire based on the selected maximum age.
The purpose of the Naked POC tracker is to highlight untested prior POC levels that may act as reference levels for future market interaction. To reduce chart clutter, the script can merge nearby Naked POCs into visible cluster zones instead of drawing every individual level.
3. Liquidity Sweep Detection
The script detects potential liquidity sweeps using recent swing highs and swing lows. A bearish sweep is detected when price moves above a prior swing high and then closes back below it. A bullish sweep is detected when price moves below a prior swing low and then closes back above it.
An optional above-median volume filter can be used to reduce low-conviction sweep signals.
4. A-Grade Confluence Engine
The A-Grade label is a confluence marker, not a buy or sell command. It appears only when a detected sweep also aligns with nearby liquidity geography.
The confluence score can include:
- Sweep near VAH or VAL.
- Sweep near an HVN zone.
- Sweep near an active Naked POC.
- Movement through an LVN zone.
The script uses a 0–5 scoring model. When the score reaches the selected A-Grade threshold, the script displays an A marker on the chart. A higher threshold generally produces fewer but more selective signals, while a lower threshold produces more frequent signals.
5. Liquidity Dashboard
The dashboard summarizes the current liquidity context, including:
- Current anchor timeframe.
- Current POC, VAH, and VAL.
- Distance from price to profile levels.
- Value-area bias.
- Number of active Naked POCs above and below price.
- Last sweep direction and age.
- Current HVN and LVN zone count.
How to use it
This indicator is intended to be used as a chart-reading and setup-discovery tool.
A practical workflow is:
1. Identify the current value-area context using POC, VAH, and VAL.
2. Observe whether price is trading inside value, above value, or below value.
3. Watch for untested Naked POC levels or clusters above and below current price.
4. Use sweep markers to identify possible stop-run or liquidity-grab events around recent swing highs or lows.
5. Treat A-Grade labels as areas requiring further analysis, not automatic entries.
6. Confirm any setup with your own market structure, execution rules, invalidation level, risk model, and out-of-sample testing.
Originality and usefulness
This script is designed as a liquidity-confluence framework rather than a simple signal overlay. Its purpose is to combine rolling volume-profile context, untested POC tracking, sweep detection, and a transparent scoring model into one chart-based workflow.
The components are intended to work together as follows:
- The rolling profile defines the current auction structure.
- Naked POCs identify prior untested high-volume reference levels.
- HVN and LVN zones provide context for acceptance and thin-volume areas.
- Sweep detection identifies possible liquidity events around recent swing points.
- The A-Grade score only appears when a sweep occurs near meaningful liquidity context.
This combination is intended to help traders evaluate where liquidity events occur in relation to volume-profile structure, rather than viewing sweeps or POC levels in isolation.
Important limitations
This indicator does not predict future price movement.
A Naked POC, HVN, LVN, VAH, VAL, sweep marker, or A-Grade label does not guarantee continuation, reversal, support, resistance, or profitability.
Volume-profile calculations in Pine Script are approximations based on available chart bars and the script’s selected binning method. Results may differ from exchange-native or platform-native volume-profile tools.
Signals and levels can vary depending on:
- Symbol.
- Timeframe.
- Market session.
- Available historical bars.
- Volume quality.
- Profile lookback length.
- Number of bins.
- Anchor timeframe.
- Sweep pivot length.
- Confluence threshold.
Traders should test the indicator across multiple symbols, timeframes, and market conditions before using it in any decision-making process.
Main settings
Volume Profile Engine
- Rolling Profile Lookback: controls how many bars are used to build the rolling volume profile.
- Profile Bins: controls the profile resolution.
- Value Area %: defines how much volume is included in the value area.
- HVN Percentile Threshold: controls which volume bins are classified as high-volume nodes.
- LVN Percentile Threshold: controls which volume bins are classified as low-volume nodes.
Naked POC Tracker
- Anchor Timeframe: defines the higher timeframe used to snapshot prior POC levels.
- Max Naked POC Age: controls how long untested Naked POCs remain active.
- Max Tracked Naked POCs: limits stored levels to protect object limits.
- Consumption Rule: determines whether a Naked POC is considered tested by a wick touch or by a close through the level.
- Cluster Mode: merges nearby Naked POCs into cleaner zones.
Liquidity Sweeps
- Swing Pivot Length: controls the swing-high and swing-low structure used for sweep detection.
- Liquidity Pool Lookback: limits how old a swing level can be and still qualify as sweepable liquidity.
- Require Above-Median Volume: filters sweep signals using a volume condition.
Confluence Engine
- Level Proximity: defines how close a sweep must be to a liquidity level to count as confluence.
- A-Grade Threshold: sets the minimum score required to display an A-Grade label.
Dashboard
- Dashboard Position: controls panel location.
- Dashboard Text Size: controls panel readability.
- Dashboard Theme: provides light or dark panel options.
- Dashboard Accent: controls dashboard accent color.
Alerts
The script includes alert conditions for:
- Bearish Sweep.
- Bullish Sweep.
- A-Grade Short.
- A-Grade Long.
- Value Area Break Up.
- Value Area Break Down.
- Naked POC Tested.
These alerts are informational and should not be interpreted as automatic trade instructions.
Recommended use
This indicator is best used by traders who understand auction-market concepts, volume-profile reference levels, swing liquidity, and discretionary confirmation. It is designed to support analysis, not replace a complete trading plan. 지표

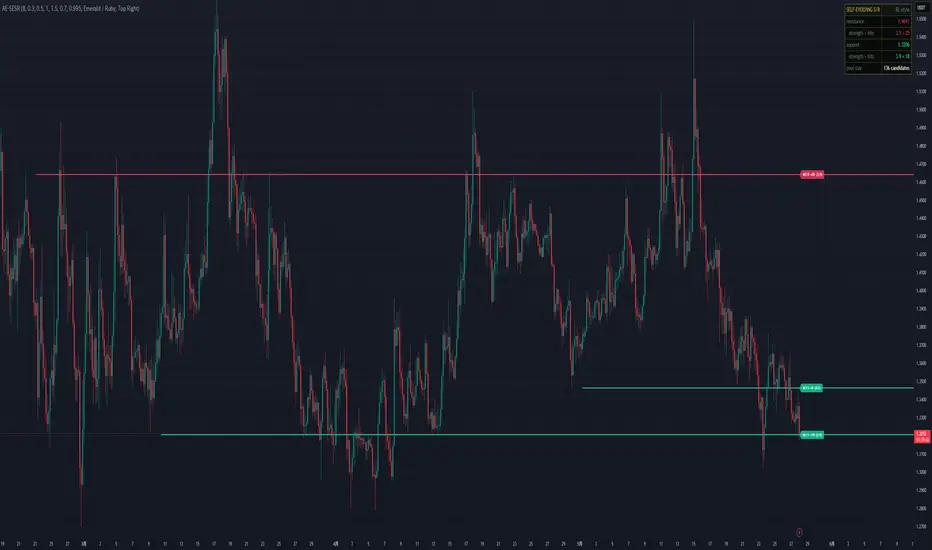
AetherEdge - Self-Evolving S/R🖊️ Overview
AE-SESR is a self-evolving S/R engine that auto-detects support/resistance and applies a reinforcement-learning reward concept to evolve only the levels that actually work. Every bounce off a level earns it score; every break decisively through it deducts. Only the top 3 levels are ever shown, so the chart stays uncluttered and only the most meaningful battle lines remain.
🔶 Key Features
Auto-detection: candidates harvested from confirmed swings (non-repainting)
RL-style scoring: bounce = reward, break = penalty teaches each level's value
Top-3-only display: strongest resistance above, strongest support below, plus the next-best
Strength-scaled line thickness: more reliable levels draw thicker
Labels show bounce count and current score
Time decay: old levels naturally fade; new performance rises
HUD shows the strongest R/S levels, their strength, and hit counts
🧠 Technical Architecture
This tool is not a full reinforcement-learning agent but reproduces its core idea — learn action values from experience, prefer high-value actions — as an online value table. Confirmed swing highs/lows (ta.pivothigh/low) become S/R candidates; nearby candidates merge into existing ones. Each candidate holds a score (its value). When price reaches a level, the subsequent move classifies it as a bounce (significant move against the approach) or a break (significant move through), updating score via reward or penalty. All scores time-decay each bar, keeping the system adaptive rather than over-anchored to old history. Levels whose score goes negative are auto-pruned, preventing pool bloat. The display picks three: the strongest resistance above price, the strongest support below, and a third slot for the next-best remaining — ranked ★1/★2/★3 by score, with line thickness proportional to score.
⚙️ Recommended Settings & Tuning Guide
Tuned with crypto in mind. Pivot Confirmation Bars near 8 is a starting point — larger captures only major levels, smaller picks up finer structure. Touch Proximity (ATR), the distance at which a level counts as "touched," defaults to 0.5 (typically fine). Score Decay is the time-decay rate; default 0.995 (0.5% decay per bar). In fast-rotating regimes, lower it (e.g., 0.99) to weight recent behavior more. Merge Distance (%) controls how close candidates consolidate — lower it on dense instruments to keep them separate.
💡 How to Use in Practice
The three displayed lines are the most performance-proven levels on this instrument. The thickest ★1 line is the highest-conviction wall right now — moments where price approaches it are candidates for bounce entries or take-profit exits. The "×N" label counts past bounces — the larger N, the more historically reliable. During regime shifts, new levels enter the top 3 while old ones decay away, visible as self-evolution. Pair with trend/structure tools and prioritize levels where AE-SESR lines align with other evidence.
⚠️ Important Notes
This tool is RL-style, not a true reinforcement-learning agent; within Pine's constraints it reproduces the core idea as experience-based level scoring. Because it's based on confirmed swings, candidates enter the pool with a few bars' delay — a necessary property of the non-repainting design. Scores need accumulated touches to become meaningful, so new instruments or short-window charts may show fewer levels.
🚨 Disclaimer
This indicator is provided for educational and informational purposes only and does not constitute financial or investment advice. No level guarantees future prices, and past performance does not indicate future results. All trading decisions are made at your own risk. 지표

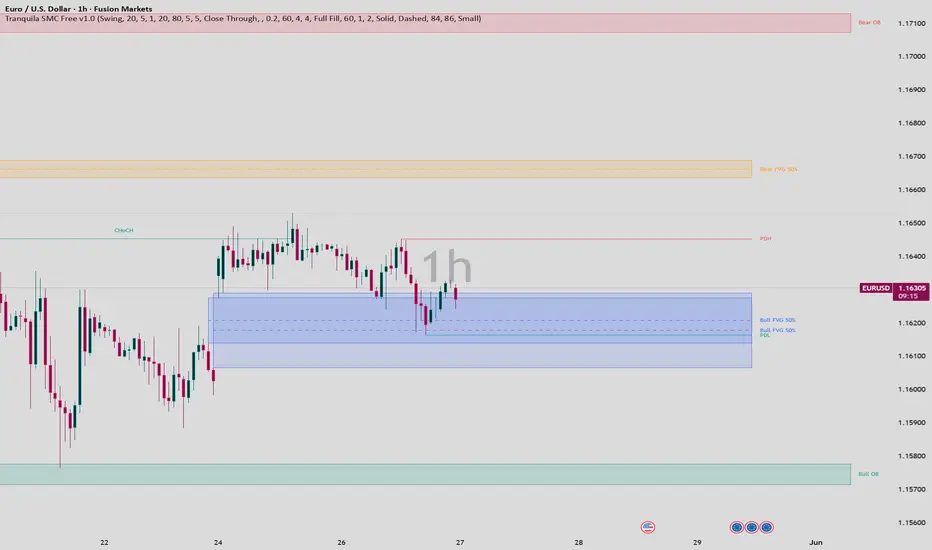
Smart Money Concepts Order Blocks, Liquidity [LunqFX]Smart Money Concepts — Order Blocks & Liquidity
A professional-grade SMC indicator that answers the three
questions every trader needs before entering a trade:
① What is the current trend?
② Where is the key institutional zone?
③ Is price at that zone right now?
📋 HOW TO USE — STEP BY STEP
The indicator works as a 3-step confirmation system.
Do not enter a trade unless all 3 align.
STEP 1 — READ THE TREND (panel header)
Look at the panel in the top-right corner.
▲ BULLISH → only look for LONG setups
▼ BEARISH → only look for SHORT setups
If the gauge bar shows less than 40% or more than 60%
— the bias is strong. Between 40–60% = no clear edge,
reduce position size or wait.
STEP 2 — WAIT FOR STRUCTURE EVENT
• BOS appears → trend continuation confirmed.
The market broke a key level and is likely to continue.
Look for entries in the direction of the break.
• CHoCH appears → trend is reversing.
This is the earliest signal of a new trend forming.
Higher risk, higher reward — wait for Step 3 to confirm.
Rule: never trade against the last structure signal.
STEP 3 — WAIT FOR PRICE TO RETURN TO THE OB ZONE
After BOS or CHoCH fires, an Order Block zone is drawn
on the chart (blue = bullish, pink = bearish).
Wait for price to pull back INTO that zone.
When price enters the zone:
→ The zone border brightens (active glow effect)
→ The panel "Zone" row shows ▲ BULL OB or ▼ BEAR OB
→ Candle color changes to the zone color
This is your entry window.
✅ FULL SETUP EXAMPLE (LONG)
1. Panel shows ▲ BULLISH
2. CHoCH or BOS fires bullish — structure confirmed
3. Blue Order Block zone is drawn below current price
4. Price pulls back into the blue zone
5. Panel Zone row shows "▲ BULL OB"
6. Enter long — Stop Loss below the OB zone bottom
7. Target: next swing high or previous resistance
✅ FULL SETUP EXAMPLE (SHORT)
1. Panel shows ▼ BEARISH
2. BOS fires bearish — downtrend continuation
3. Pink Order Block zone is drawn above current price
4. Price pulls back up into the pink zone
5. Panel Zone row shows "▼ BEAR OB"
6. Enter short — Stop Loss above the OB zone top
7. Target: next swing low or previous support
⚠️ WHAT TO AVOID
✗ Don't enter on the BOS/CHoCH candle itself —
wait for the pullback to the OB zone
✗ Don't trade a swept (faded/dashed) zone —
it was already mitigated, its edge is gone
✗ Don't fight the trend — if panel says BEARISH,
don't look for longs no matter how good it looks
✗ High ATR (volatile) = widen your stop loss
or reduce position size accordingly
🔷 ORDER BLOCKS
Automatically detects bullish and bearish Order Blocks —
the last opposing candle before a Break of Structure.
Zones use a 2-band gradient (dense core + lighter outer)
to visualize institutional demand and supply areas.
• Active glow: border brightens when price enters the zone
• Swept zones: automatically fade to dashed when mitigated
• Age-based cleanup: old zones removed after set bar count
• Mitigation mode: choose Close or Wick for zone removal
📐 BREAK OF STRUCTURE (BOS) & CHANGE OF CHARACTER (CHoCH)
BOS confirms trend continuation. CHoCH signals a trend
reversal. Only the most recent signal is displayed —
CHoCH automatically clears stale BOS, and BOS clears
stale CHoCH. No visual clutter.
• BOS: dashed line at broken structure level
• CHoCH: solid line with arrow label at pivot bar
• No repaint: all signals fire on confirmed closed candles only
💧 LIQUIDITY — Equal Highs / Equal Lows
Detects EQH and EQL liquidity pools — price levels where
stop-losses cluster. Marks them with dotted lines so you
can anticipate smart money liquidity sweeps.
⚡ FAIR VALUE GAPS (FVG)
Identifies bullish and bearish imbalance zones (3-candle
gaps). Optional — hidden by default to keep the chart clean.
Enable in settings when imbalance confluences matter.
🎨 MOMENTUM GRADIENT CANDLES
Every candle is colored by momentum strength relative to
the last 30 bars. Weak candles = dark muted shade. Strong
impulse candles = vivid bright color. Structure events
(CHoCH/BOS) override with accent colors.
📊 LIVE DASHBOARD PANEL
Top-right panel shows at a glance:
• Trend bias (BULLISH / BEARISH) + visual gauge bar
• Last BOS and CHoCH direction and time
• Current zone status (price inside OB?)
• Active Order Block count per side
• Last confirmed Swing High and Swing Low prices
• ATR(14) with volatility label (LOW / NORMAL / HIGH)
• No Repaint confirmation
✅ NO REPAINT — CONFIRMED CLOSE ONLY
All pivot detections use ta.pivothigh() / ta.pivotlow()
with confirmed lookback. All BOS/CHoCH signals require
barstate.isconfirmed. What you see is what happened —
no repainting, no false signals on open candles.
⚙️ SETTINGS
Structure:
• Swing Length (3–30 bars)
• Max BOS / CHoCH lines shown
• BOS line length
• Show/hide swing pivot markers
Order Blocks:
• Max OBs per side
• Max age in bars
• Swept zone display + age
• Mitigation mode: Close or Wick
Display:
• Momentum candle coloring on/off
• Dashboard panel on/off
• Fair Value Gaps on/off
• Equal H/L liquidity on/off
Works on all instruments and timeframes.
Best used on: Forex, Gold (XAUUSD), Indices, Crypto.
Recommended timeframes: 15m, 30m, 1H, 4H, 1D.
━━━━━━━━━━━━━━━━━━━━━━━━━━━━━━━━━━ 지표

지표

AetherEdge - Adaptive Liquidation Heatmap🖊️ Overview
AE-LIQ is a liquidation-level estimation engine in the spirit of CoinGlass-style liquidation heatmaps. It estimates the price levels where leveraged liquidation orders cluster and renders them as bright horizontal bands — the "magnets" price tends to be drawn toward. Real liquidation maps use exchange position data, but since Pine can only access price and volume, this tool estimates from those by back-solving liquidation prices for several leverage tiers, emphasizing the bands that work via adaptive learning.
🔶 Key Features
Liquidation-band estimation: back-solves liquidation prices for 5×/10×/25×/50×/100× leverage
Volume weighting: each bar's volume serves as a position-size proxy for band intensity
Swept decay: bands price has already traded through are decayed, emphasizing un-swept bands (remaining liquidity)
Long/short selection: long liquidations (below) and short liquidations (above) can be shown separately
Adaptive tier reliability: online-learns whether price reaching each tier's bands actually reacted, emphasizing the effective ones
Viridis palette (purple→teal→green→yellow) reproducing the CoinGlass aesthetic
Integrated HUD showing the strongest leverage tier and each tier's reliability
🧠 Technical Architecture
Liquidation distance is approximated by the inverse of leverage (≈10% for 10×, ≈4% for 25×). From each bar's price, liquidation prices are back-solved for every enabled leverage tier, and a volume-based weight is added to the row (price bin) that price occupies. Higher leverage produces tighter, more crowded bands weighted more heavily. The accumulated row energy is normalized, bands price recently swept are decayed by the configured amount ("liquidated"), and un-swept bands remain bright. The AI layer checks whether, historically, price reaching each tier's liquidation distance actually produced an ATR-scaled reaction, updating per-tier reliability via an exponentially-weighted average. More reliable tiers gain band weight and visual emphasis. Rendering uses per-row horizontal box transparency grading, with Viridis-spectrum brightness encoding energy magnitude.⚙️ Recommended Settings & Tuning Guide
Tuned with crypto in mind. Price Resolution 60 and Accumulation Lookback ~250 are a starting point. On high-volatility instruments, raise Vertical Range to cover a wider price span. Swept-Band Decay controls how much traded-through bands are erased — higher leaves only the un-swept bands vivid, like CoinGlass. If cluttered, turn off unneeded tiers or restrict to one side (long/short).
💡 How to Use in Practice
Bright yellow bands read as price levels where heavy liquidations sleep — magnets that attract price. Price often moves toward such bands, and reaching them tends to trigger large volatility (liquidation cascades). The brightest bands above and below current price offer references for short-term targets and risk management. The HUD's strongest tier shows which leverage layer actually functions as a magnet on this instrument, guiding which bands to prioritize. Pairing with other structure analysis and favoring levels where liquidation bands align with support/resistance is effective.
⚠️ Important Notes
This tool is Estimated and differs from a real CoinGlass liquidation map. Exchange open-interest and leverage-distribution data cannot be accessed in Pine, so this is an approximation back-solved from price and volume, and may diverge from the actual distribution of liquidation orders. Liquidation bands are probabilistic estimates, not certain price targets. The heatmap rebuilds only on the last bar and does not repaint confirmed history. The AI reliability learning requires accumulated data.
🚨 Disclaimer
This indicator is provided for educational and informational purposes only and does not constitute financial or investment advice. No output guarantees future prices, and past performance does not indicate future results. All trading decisions are made at your own risk. 지표

지표
Renko Heatmap Pro [MarkitTick]💡 Multi-faceted trend analysis and price action visualization system engineered to filter out time-based market noise and strictly highlight price momentum. By computing synthetic Renko bricks directly on your traditional time-based chart, this tool overlays a completely volatility-adjusted perspective of the market. It seamlessly integrates a streak-based momentum heatmap, dynamic support and resistance tracking, and a comprehensive risk-management dashboard into a single, cohesive interface. This allows analysts to visualize trend maturity, identify precise structural shifts, and monitor key risk metrics without relying on lagging, time-dependent oscillators.
✨ Originality and Utility
Standard charting relies on fixed time intervals, which often introduces "noise"—price fluctuations that occur simply because time is passing, not because structural momentum is shifting. The utility of this indicator lies in its ability to reconstruct the market using Average True Range (ATR) based Renko methodology natively over standard candlesticks.
What sets this script apart is its Streak Engine and Gradient Color framework. Instead of merely showing bullish or bearish states, the indicator quantifies trend depth. It tracks consecutive directional blocks and dynamically adjusts the visual weighting (heatmap) based on the longevity of the trend. This is further hybridized with an automated risk-management engine that calculates dynamic Stop Loss (SL) and Take Profit (TP) levels, alongside trailing stops and historical support/resistance levels that visually "fade" as they age. This creates an all-in-one suite for trend-following and structural analysis.
🔬 Methodology and Concepts
● Renko Ticker Construction
The script bypasses standard open, high, low, close (OHLC) bar data for its core signals, instead utilizing a secondary data request to construct ATR-based Renko blocks. A Renko brick is only formed when price moves a specified distance, completely disregarding the time it takes to make that move. In this system, the brick size is defined by the ATR, ensuring the threshold adapts to current market volatility.
● The Streak Engine
Every time a new Renko brick is formed in the same direction as the previous one, the internal streak counter increases. If a bullish brick follows a bullish brick, the count iterates upward. If a bearish brick prints, the bullish streak breaks, resetting the count and initiating a bearish streak. This creates a quantitative measure of trend duration and exhaustion.
● Dynamic Risk Management Engine
Using the confirmed close of the previous Renko block, the system calculates algorithmic risk parameters. Stop Loss and Take Profit levels are calculated as distinct ATR multiples extending outward from the confirmed entry price. A trailing stop is also maintained, dynamically tightening behind the trend (higher in a bull trend, lower in a bear trend) and only resetting when the Renko structure reverses.
● Historical S/R Decay Logic
When a reversal occurs, the open price of that reversal block is recorded as a structural pivot. The indicator logs this price point and tracks its age (in bars). As time progresses, the visual representation of this level fades out, acknowledging the market theory that older, untested levels gradually lose their structural relevance compared to fresh pivots.
🎨 Visual Guide
● Heatmap Candles
Trend Maturation (Gradients): The candlestick bodies are overridden with a heatmap gradient. A new bullish trend starts with a deep blue color and transitions toward a bright cyan as the streak extends. A bearish trend starts deep red and transitions to a bright orange/yellow as it matures.
Stagnation: If a bar does not generate a new Renko block, it is colored a muted gray, signaling a period of consolidation where the volatility threshold hasn't been met.
● Structural Plot Lines
OC Core Zone: A semi-transparent filled channel on the chart representing the upper and lower boundaries of the current active Renko block.
Renko Midline: A dotted line tracking the exact mathematical center of the active block.
Reversal Close Circles: Prominent circular plots that appear exclusively when a structural trend reversal is confirmed, marking a potential entry or exit node.
Trailing Stop: A dashed line trailing behind the current price action, colored dynamically based on the active trend (cyan for bullish support, orange for bearish resistance).
Support/Resistance (S/R) Lines: Dotted horizontal lines extending from past reversal points. Their opacity visually fades the longer they remain on the chart.
● On-Chart Shapes and Labels
Signal Triangles: Distinct ▲ BUY (below bar) and ▼ SELL (above bar) shapes accompanied by text, printed precisely when the Renko direction shifts.
Box Count Label: A small, dynamic text label appearing at reversals to indicate exactly how many consecutive boxes the previous structural leg lasted.
● The Dashboard Panel
Located in the top right corner, this heads-up display provides real-time quantitative metrics:
Trend Bias: Text readout of the current structural direction (Bull/Bear).
Streak Depth: A 10-block visual bar (e.g., ████░░░░░░) showing how far along the current trend is relative to the user-defined maximum gradient depth.
R:R Quality: A visual score rating the current Reward-to-Risk ratio based on the dynamic SL/TP levels.
Actionable Prices: Exact price readouts for Entry, Stop Loss, Take Profit, and the Trailing Stop.
📌 Important note : the best way to resolve visual overlap is to navigate to the Object Tree and drag the indicator above the main chart layer, or simply hide the native candles in your chart settings.
📖 How to Use
● Trend Identification and Exhaustion
Traders can monitor the Heatmap Candles to gauge both direction and maturity. When the candles transition from their starting colors (dark blue / deep red) to their terminal colors (bright cyan / bright orange), it indicates that the trend streak is becoming highly extended. An extended streak does not automatically imply a reversal, but it suggests momentum has been sustained for an extended period, which may precede a consolidation or pullback.
● Entry and Execution
A primary use case is waiting for a confirmed trend shift. When a reversal is validated, the indicator plots the Reversal Close Circle and the ▲ BUY / ▼ SELL shape. Traders can use the Dashboard Panel to immediately read the calculated Entry, SL, and TP prices.
● Managing Risk In-Trade
Once a position is active, the Trailing Stop dashed line provides a dynamic, structural level to trail a stop-loss. Additionally, traders can monitor price action as it approaches the historical dotted S/R lines. If price approaches a sharply colored (recent) S/R line, higher friction is expected. If it approaches a heavily faded (old) line, the level may carry less structural weight.
Note on Data Resolution: Because this tool queries secondary Renko data using the current chart's resolution and employs lookahead functionality on historical data, real-time current-bar fluctuations may briefly cross thresholds before closing. Decisions should strictly be made on confirmed bar closes, as indicated by the script's internal logic.
⚙️ Inputs and Settings
● ◈ Renko
ATR Length: The lookback period used to calculate the Average True Range, determining the size of the underlying Renko bricks.
ATR Resolution ×: A multiplier to scale the resolution up for higher-timeframe smoothing.
● ◈ Visuals
Bull/Bear Colors (Start & End): Customization for the heatmap gradients. You can define the exact color of a fresh trend and an exhausted trend.
Gradient Streak Depth: The number of consecutive bricks required to reach the "End" color. A higher number stretches the gradient over a longer trend.
● ◈ Risk Management
Dynamic SL/TP in Alerts: Toggles whether the SL and TP values are dynamically injected into the outgoing Webhook alert JSON.
SL / TP ATR Multiplier: Defines the distance (in ATR units) from the entry point to calculate the Stop Loss and Take Profit levels.
Show Trailing Stop Line: Toggles the visibility of the dynamic trailing stop boundary.
● ◈ Structure Analysis
Show S/R Levels & Max Levels: Toggles the historical reversal lines and sets a hard limit on how many previous levels are maintained on the chart to prevent clutter.
S/R Fade Age (bars): Determines how quickly the S/R lines lose their opacity as time passes.
● ◈ Webhook Actions
Configurable string inputs to match your specific execution bot commands (e.g., "long", "short", "closelong"). These are embedded into the JSON payload triggered by the indicator's alerts.
🔍 Deconstruction of the Underlying Scientific and Academic Framework
● Market Noise and the Random Walk
In quantitative finance, high-frequency price data is often modeled with components of a Brownian motion or a Random Walk, where short-term movements contain significant "noise" (stochastic variation) independent of the underlying drift (trend). Standard time-based sampling captures all of this variance. By utilizing a Renko construction, this indicator applies a discrete filtration mechanism. It mathematically suppresses localized stochastic volatility by requiring price to traverse a minimum Euclidean distance (the ATR block size) before registering a state change.
● Volatility Clustering and Adaptive Thresholds
Mandelbrot and subsequent econometricians noted that market volatility clusters—periods of high variance are followed by high variance. Using a static brick size in Renko fails to account for leptokurtic market distributions. By anchoring the block size to the Average True Range, the indicator's filtration threshold becomes adaptive. During periods of volatility expansion, the required threshold widens, preventing the streak engine from being whipsawed by natural variance expansion.
● Momentum Decay and Mean Reversion Probability
The Gradient Streak Depth concept relies on the statistical premise of mean reversion following extended standard deviations from a mean. While trends can persist, the probability of a structural pullback increases as the streak count grows. The heatmap visually represents this probability density—translating a quantitative sequential count into a qualitative visual exhaustion metric, aiding in the assessment of asymmetric risk distribution.
⚠️ Disclaimer
All provided scripts and indicators are strictly for educational exploration and must not be interpreted as financial advice or a recommendation to execute trades. I expressly disclaim all liability for any financial losses or damages that may result, directly or indirectly, from the reliance on or application of these tools. Market participation carries inherent risk where past performance never guarantees future returns, leaving all investment decisions and due diligence solely at your own discretion. 지표

Swing Gradient TPOs [BOSWaves]Swing Gradient TPOs - Swing-Anchored Time Price Opportunity Profiles with Gradient Chronology and Single Print Detection
Overview
Swing Gradient TPOs is a swing-anchored market profile system that constructs Time Price Opportunity profiles within each detected swing range, where letter assignment, gradient coloring, POC identification, and single print detection are driven by chronological time period progression across the swing rather than fixed session boundaries or arbitrary time windows.
Instead of applying TPO profiles to calendar sessions or user-defined time blocks, this system anchors each profile to the confirmed swing structure of the instrument itself, building a complete letter-by-letter participation map for every swing from high to low and low to high. Each time period within the swing receives a sequential alphabetical letter, and those letters are colored using a configurable gradient that visually encodes the chronological progression of price activity from swing origin to completion.
This creates a profile framework that reflects how participation distributed across price within each structural swing rather than within arbitrary time containers. The gradient coloring reveals whether price visited certain levels early or late in the swing's development, the POC identifies the price level with the greatest time-based participation, the value area captures the range containing the configured percentage of total activity, and single print zones mark levels touched by only a single time period and project them forward as potential reaction areas until price revisits them.
Price structure and participation distribution are therefore evaluated together, with each swing producing a self-contained profile that answers both where price spent time and when within the swing that activity occurred.
Conceptual Framework
Swing Gradient TPOs is founded on the principle that TPO-based market profile analysis becomes structurally meaningful when profiles are anchored to confirmed swing boundaries rather than to session times that carry no relationship to the instrument's actual directional behavior.
Traditional market profile approaches build TPO distributions within daily or weekly sessions, which imposes a time container on the data that is independent of how price is actually behaving structurally. This framework replaces session-based profile construction with swing-event-driven profile building, where each profile begins at a confirmed swing extreme and ends at the next confirmed swing extreme in the opposing direction, ensuring the participation map covers exactly one complete directional structural move.
Three core principles guide the design:
TPO profiles should be anchored to swing structure rather than calendar time, ensuring each profile captures participation within a single directional move rather than across an arbitrary time boundary that may span multiple structural events.
Gradient coloring should encode chronological letter progression visually, revealing whether price visited particular levels early or late in the swing rather than treating all activity within the swing as temporally equivalent.
Single print zones represent structurally significant levels visited by only one time period and should be projected forward as active reference areas until price returns to test them, at which point reclaim or rejection behavior provides actionable signal context.
This shifts market profile analysis from session-container-based participation tracking into swing-anchored structural profile construction with gradient-encoded temporal intelligence and forward-projecting single print monitoring.
Theoretical Foundation
The indicator combines swing high and low detection through highest and lowest lookback comparison, alphabetical letter assignment by configurable TPO timeframe period, three-color gradient interpolation for chronological letter coloring, POC identification through maximum TPO count per price bin, value area expansion from POC outward, single print detection and forward projection, and retest signal generation when price sweeps and reclaims a single print zone.
Swing detection tracks whether the most recent extreme high or low is the highest or lowest reading in the lookback window, registering a swing point when price rotates away from a prior extreme. TPO letter assignment maps each bar within the swing to a time period based on the ratio between the chart timeframe and the configured TPO timeframe, with sequential alphabet letters A through Z then a through z assigned chronologically across the swing's duration. Gradient coloring maps each letter's alphabetical index to a position along a three-stop gradient, producing a color sequence that progresses from swing start to swing end. Price bins are calculated from the swing range divided into segments sized relative to recent ATR, with each bin's letter count determining POC and value area membership.
Four internal systems operate in tandem:
Swing Detection Engine : Tracks highest and lowest readings over the configurable lookback window, registering confirmed swing highs and lows when price rotates away from prior extremes and triggering profile construction on each swing direction change.
TPO Profile Builder : Assigns sequential alphabetical letters to time periods within each swing, maps each bar's high and low range to the appropriate price bins, accumulates letter strings and counts per bin, and derives POC and value area from the resulting distribution.
Gradient Chronology Engine : Maps each letter's sequential index to a position along a configurable three-stop gradient, producing coloring that encodes when within the swing each price level was visited rather than applying uniform directional color across the entire profile.
Single Print Detection and Signal System : Identifies price bins touched by exactly one time period letter, projects those zones forward as extended boxes until price revisits them, monitors for sweep-and-reclaim behavior with configurable cooldown, and generates directional retest signals when qualifying conditions are met.
This design allows each swing to produce a complete participation profile with temporal depth encoded visually, while structurally significant single print zones remain active as forward reference areas with signal generation capability.
How It Works
Swing Gradient TPOs evaluates price through a sequence of structure-aware and profile-building processes:
Swing Direction Tracking : On each bar, price is compared against the highest high and lowest low over the configured lookback. When the current high matches the lookback high, the swing is classified as transitioning to a downswing. When the current low matches the lookback low, it is classified as transitioning to an upswing.
Swing Point Registration : When price rotates away from a prior extreme, the swing point price and bar index are recorded for both highs and lows independently, maintaining the most recent confirmed swing high and low as profile anchors.
Profile Build Trigger : When swing direction changes, a profile build is triggered using the recorded swing high and low as boundaries, constructing the complete TPO distribution for the completed swing.
Price Bin Calculation : The swing range is divided into bins sized relative to a smoothed ATR-derived tick amount, capped at 80 bins to maintain visual clarity and computational efficiency.
Letter Assignment and Accumulation : Each bar within the swing is mapped to a time period letter based on the ratio of the configured TPO timeframe to the chart timeframe. For each bar, its high and low determine which price bins it touches, and the period letter is appended to each qualifying bin's letter string if not already present.
POC Identification : The bin with the greatest accumulated letter count is identified as the Point of Control, representing the price level with the most time-based participation across the swing.
Value Area Expansion : Starting from the POC bin, the value area expands outward by adding the adjacent bin with the greater letter count, continuing until the accumulated count reaches the configured value area percentage of total swing activity.
Gradient Color Mapping : Each letter's alphabetical index is divided by the maximum period index to produce a normalized position along the three-stop gradient, assigning colors that progress from the gradient start color early in the swing to the gradient end color late in the swing.
Single Print Identification and Projection : Bins with exactly one letter in their string are classified as single prints and, when the extension setting is enabled, receive forward-projecting zone boxes that extend rightward on each bar until price enters the zone.
Single Print Sweep and Reclaim Detection : When price enters a single print zone the zone is marked as swept. If price then exits the zone in the opposing direction and closes beyond the zone boundary with sufficient cooldown observed, a directional retest signal is generated.
Real-Time Profile Rendering : On the last bar, the developing swing from the most recent confirmed extreme to current price is rendered as a live TPO profile that updates with each new bar, providing a continuously refreshing participation map for the current incomplete swing.
Together, these elements form a continuously updating swing profile system where each completed swing produces a gradient-encoded participation map, single print zones project forward as active structural references, and retest signals identify price reclaims of structurally thin areas.
Interpretation
Swing Gradient TPOs should be interpreted as a swing-anchored participation distribution system with temporal depth encoding and forward-projecting structural reference zones:
TPO Letter Boxes : Each lettered box represents a single time period's visit to that price level within the swing. The letter itself identifies which time period made the visit, and the gradient color reveals where in the swing's chronological sequence that period falls.
Gradient Coloring : The gradient progression from swing start to swing end colors early-swing activity in the gradient start color and late-swing activity in the gradient end color, visually encoding whether price visited each level early or late in the structural move.
Point of Control (POC) : The horizontal line through the price level with the most accumulated TPO letters represents the level where price spent the greatest amount of time within the swing, acting as a gravitational reference for the swing's dominant auction zone.
Value Area : The vertical line at the swing origin spanning the value area high and low with dotted horizontal boundary projections marks the price range containing the configured percentage of total swing TPO activity, identifying the zone of concentrated acceptance during the swing.
Single Print Zones (Highlighted) : Price bins touched by exactly one time period letter are visually distinguished within the profile, indicating levels that price passed through quickly without sustained participation, representing structurally thin areas vulnerable to future reaction.
Single Print Extensions (Projected) : When extension is enabled, single print zones project forward as shaded boxes beyond the swing boundary, maintaining active visual reference until price revisits the zone and the extension is consumed.
Retest Signals : Arrow signals generated when price sweeps through an extended single print zone and then reclaims it by closing beyond the zone boundary, identifying potential continuation opportunities at structurally thin levels that have now been tested and defended.
Real-Time Profile : The developing profile on the current incomplete swing updates continuously with each new bar, providing a live participation map anchored to the most recent confirmed swing extreme using the same gradient, POC, and value area logic as completed historical swings.
POC location, value area boundaries, gradient temporal distribution, and single print zone positioning collectively provide more structural and participatory intelligence than any element in isolation.
Signal Logic & Visual Cues
Swing Gradient TPOs presents two retest signal types derived from single print zone interaction:
Bullish Single Print Reclaim : Generated when price sweeps into a bullish single print zone from an upswing and subsequently closes above the zone's upper boundary, indicating the structurally thin area has been swept and reclaimed with bullish resolution.
Bearish Single Print Rejection : Generated when price sweeps into a bearish single print zone from a downswing and subsequently closes below the zone's lower boundary, indicating the structurally thin area has been swept and rejected with bearish resolution.
Both signal types require the zone to have been swept before reclaim or rejection can register, and a configurable cooldown enforces minimum bar separation between consecutive signals to prevent clustering during active zone interaction.
Alert generation covers completed swing high and swing low events as well as bullish and bearish single print reclaim signals for systematic structural and zone-based monitoring workflows.
Strategy Integration
Swing Gradient TPOs fits within market profile-informed and structure-based participation analysis approaches:
POC Reaction Trading : Monitor price behavior when it returns to a prior swing's POC level. The POC represents the most accepted price within the swing and frequently acts as a reference for future support, resistance, or reversion behavior.
Value Area Boundary Framing : Use value area high and low projections as structural boundary references, with price outside the value area representing potential imbalance and price returning to the value area suggesting reversion toward prior acceptance.
Single Print Zone Trading : Use extended single print zones as anticipatory structural references, monitoring price behavior on approach for the sweep-and-reclaim or sweep-and-reject patterns that trigger retest signals.
Gradient Temporal Analysis : Use gradient distribution within each swing to assess whether participation at key levels occurred early or late in the move. Heavily late-swing activity at a level suggests climactic behavior, while early-swing concentration may indicate initial acceptance or rejection zones.
Real-Time Profile Monitoring : Use the developing live profile to assess current swing participation distribution in real time, identifying emerging POC levels and single prints within the active structural move before it completes.
Multi-Swing Profile Comparison : Compare POC locations, value area widths, and single print density across successive swings to assess whether participation is concentrating or dispersing as the broader trend develops.
Technical Implementation Details
Swing Detection : Highest and lowest lookback comparison with direction tracking and confirmed extreme registration on price rotation
TPO Construction : Alphabetical letter assignment by timeframe-ratio-derived period with per-bin letter string accumulation and count tracking
Profile Analytics : Maximum count POC identification, outward value area expansion to configurable percentage threshold, and single print bin classification
Gradient Engine : Three-stop gradient interpolation with letter index normalized to maximum period for chronological color mapping
Single Print System : Array-managed forward-projecting zone boxes with sweep state tracking, reclaim direction testing, and cooldown-gated signal generation
Real-Time Rendering : Last-bar-triggered live profile construction rebuilding on every bar update with independent box and line arrays cleared and redrawn each render cycle
Visualization : Per-letter TPO boxes with gradient, POC, and value area coloring, POC dual-line overlay, value area vertical and horizontal boundary lines, single print zone extensions, and retest signal arrows
Performance Profile : Optimized with calc_bars_count and max_bars_back configuration and array size caps for object management across extended histories
Optimal Application Parameters
Timeframe Guidance:
1 - 5 min : Intraday swing profile mapping with shorter swing length and faster TPO timeframe for responsive participation tracking within intraday structural moves
15 - 60 min : Session-level swing profile analysis with balanced swing length and TPO timeframe producing meaningful letter distributions across typical session swings
4H - Daily : Swing-level structural participation mapping with longer swing detection and higher TPO timeframe for profiles that reflect multi-day directional move participation
Suggested Baseline Configuration:
Swing Length : 12
TPO Timeframe : 30
Box Width : 2
Show POC : Enabled
Show Value Area : Enabled
Value Area % : 70
Gradient Preset : Sunset
Highlight Single Prints : Enabled
Extend Single Prints : Enabled
Show Retest Signals : Enabled
Signal Cooldown : 5
These suggested parameters should be used as a baseline; their effectiveness depends on the instrument's swing frequency, typical swing range, and preferred profile granularity, so fine-tuning is expected for optimal performance.
Parameter Calibration Notes
Use the following adjustments to refine behavior without altering the core logic:
Swings too frequent : Increase Swing Length to require more bars on each side of an extreme before it registers as a confirmed swing point, filtering minor oscillations and producing fewer, more structurally significant profiles.
Swings too infrequent : Decrease Swing Length toward 10 for more sensitive swing detection, producing profiles on smaller structural moves within the overall trend.
Too few letters per profile : Decrease TPO Timeframe to assign letters to shorter time periods, increasing letter density within each swing and producing more granular participation distributions.
Too many letters cluttering the profile : Increase TPO Timeframe so each letter covers a longer period, reducing letter density and producing cleaner, more readable profiles on the target timeframe.
Profile bins too coarse : The bin count derives from the swing range divided by a smoothed ATR-based tick size. On instruments with large typical bar ranges relative to the swing, the profile may appear coarse. Consider using a higher timeframe chart or adjusting swing length to capture larger swings with more granular bin resolution.
Too many single print signals : Increase Signal Cooldown to enforce greater bar separation between consecutive retest signals, or increase Swing Length to produce swings with fewer single print zones through greater overall participation density.
Single print extensions cluttering the chart : Disable Extend Single Prints to remove forward projection boxes while retaining single print highlighting within the historical profile, or reduce Max Zones (capped internally at 50) by allowing older zones to naturally expire as price revisits them.
Adjustments should be incremental and evaluated across multiple session types rather than isolated market conditions.
Performance Characteristics
High Effectiveness:
Trending markets with clear directional swings where each profile captures a single sustained move and produces meaningful POC and value area levels that serve as ongoing structural references
Instruments with sufficient intrabar participation where TPO letter accumulation produces well-distributed profiles with identifiable concentration zones rather than sparse single-print-dominated structures
Market profile-based trading approaches that benefit from swing-anchored rather than session-anchored participation context, aligning profile boundaries with actual structural events
Single print zone strategies where structurally thin levels within completed swings provide anticipatory reference areas for future price reactions with defined signal criteria
Reduced Effectiveness:
Choppy, low-range markets where frequent swing direction changes produce thin profiles with minimal letter accumulation and limited POC or value area differentiation
Extremely fast-moving instruments where swing ranges are so large relative to the TPO timeframe that letters are thinly distributed across a wide range, reducing profile interpretive value
Low-liquidity instruments where participation is insufficient to produce meaningful time-at-price distributions, resulting in profiles dominated by single prints with no identifiable acceptance zones
Markets where the relationship between swing structure and participation distribution is inconsistent, reducing the reliability of POC and value area levels as structural references across successive swings
Very short timeframe charts where the ratio between chart timeframe and TPO timeframe produces insufficient letter differentiation to build interpretable profiles within typical swing durations
Integration Guidelines
Confluence : Combine with BOSWaves structural tools, order flow analysis, or momentum indicators to validate POC and value area reactions with broader analytical context before acting on profile-based reference levels
POC Migration Awareness : Track whether POC levels across successive swings are migrating higher, lower, or remaining stable as a secondary indicator of directional participation bias beyond raw trend direction
Single Print Zone Patience : Allow single print zones to extend and be approached naturally rather than anticipating reactions prematurely. The sweep-and-reclaim or sweep-and-reject sequence that triggers signals requires zone interaction to complete before directional evidence is confirmed.
Gradient Reading : Use gradient distribution within profiles to contextualize POC and value area location. A POC formed late in the gradient sequence suggests late-swing acceptance, potentially indicating exhaustion. An early-forming POC suggests early directional commitment that may carry more structural weight.
Real-Time Profile Monitoring : Treat the live developing profile as probabilistic rather than confirmed. POC and value area locations in the real-time profile will shift as new bars are added and should be interpreted as dynamic rather than fixed until the swing completes and the historical profile is committed.
Disclaimer
Swing Gradient TPOs is a professional-grade swing-anchored market profile and structural participation analysis tool. It uses TPO letter accumulation with gradient chronology encoding and single print zone projection but does not predict future price movements. Results depend on market conditions, instrument participation characteristics, parameter selection, and disciplined execution. BOSWaves recommends deploying this indicator within a broader analytical framework that incorporates momentum context, order flow analysis, and comprehensive risk management. 지표

Timbuktu V - Black holeTimbuktu V - Black Hole is a momentum and trend-following technical indicator designed to identify high-volatility breakout phases and FOMO-driven moves. The algorithm pinpoints the exact moments when price breaks out of historical ranges with a drastic spike in volume and strong RSI backing, capturing high-velocity market expansions (the "Black Hole" effect).
The indicator highlights bars and plots visual signals directly on your chart when extreme market conditions are met. This is ideal for breakout traders, momentum scalpers, and those trading highly volatile assets (Crypto, Forex, or Equities).
How It Works (Quantitative Logic)
To filter out market noise and false breakouts, the script combines 4 key confirmation factors before triggering a signal:
Trend Context: It uses an EMA (21-period by default) to determine the macro direction. Long signals are only triggered above it, and Short signals below it.
Range Breakout: Price must break the highest high or lowest low of the last 100 periods (Lookback input). It does not trade ranges; it trades explosive expansions.
Volume Confirmation (Smart Money): It requires the breakout bar's volume to exceed its short-term volume moving average (2-period SMA) by at least 30% (x1.3).
Momentum Strength (RSI): The RSI must be in the overbought zone (>65) for Longs or oversold zone (<35) for Shorts, validating genuine aggressive buying/selling pressure.
Key Features
Dynamic FOMO Candles: Candles that trigger the signal change color (yellow by default) to visually alert you to the volatility explosion.
Net Percentage Calculation: The indicator automatically measures the percentage range of the breakout candle, subtracts a custom operational fee (Cost input), and projects the net percentage directly on the chart using dynamic labels.
Clean Visual Signals (plotshape): Sleek diamond icons plotted above/below the candles for quick execution and backtesting visualization.
Native Alerts Ready: Includes 3 built-in alert conditions (Black Hole Long, Black Hole Short, and a combined alert) so you can easily automate your strategy or receive instant mobile/webhook notifications.
Customizable Settings
EMA Trend (21): Adjusts the core trend-filtering line.
RSI (14): Changes the sensitivity of the strength oscillator.
Volume MA (2): The moving average period used to detect the volume spike (tweak it to look for sustained volume or pure immediate bursts).
Lookback HH/LL (100): The lookback window used to define what qualifies as a major historical high or low.
Cost (0.04): A percentage offset to simulate fees or slippage, providing a more realistic net movement display.
Trading Tips
Timeframes: Highly effective on 5m, 15m, and 1h charts to catch intra-day breakout continuations.
Risk Management: Because this strategy capitalizes on FOMO/Volatility, consider placing your Stop Loss just below the EMA 21 or at the low/high of the breakout candle itself. 지표

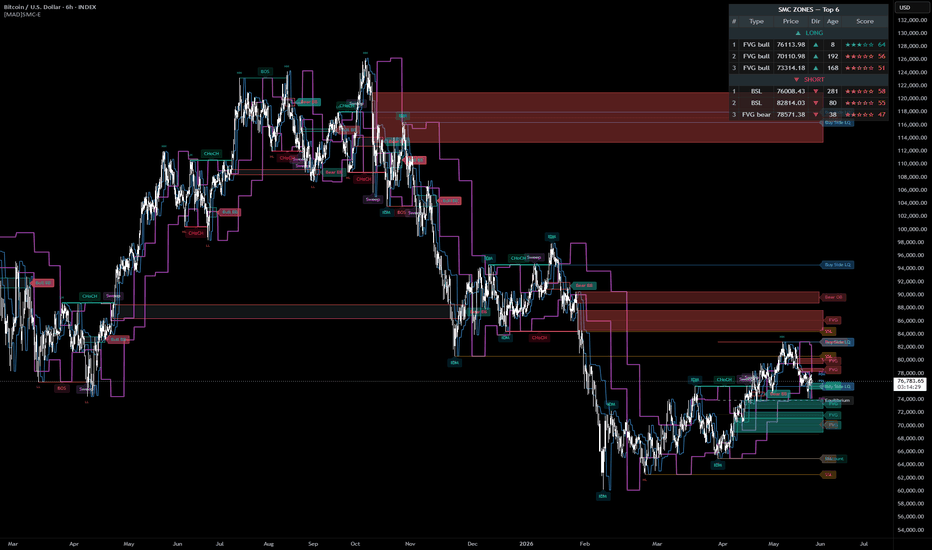
[MAD] SMC1. OVERVIEW
SMC Event Markers is a complete Smart-Money-Concepts toolkit that draws every major institutional footprint on the chart — and then ranks every zone by relevance so you instantly see which ones actually matter.
Most SMC indicators have the same problem: they paint dozens of FVGs, order blocks, and liquidity lines, and leave you to decide what to trade. After ten zones the chart looks like a dropped Lego set. This indicator solves that. Every active zone is scored 0–100 against five independent factors. Low-scoring zones fade or disappear automatically. A compact dashboard pins the top-ranked setups to a chart corner so you always know where the high-probability opportunities are.
The indicator detects 14+ SMC event types — FVG, IFVG, Order Blocks, Breaker Blocks, BSL/SSL, BPR, EQH/EQL, BOS/CHoCH, Sweep, IDM, Reversal Confirmed, Premium/Discount/Equilibrium, OTE, Volume Imbalance, SMT Divergence, PDH/PDL/PWH/PWL/PMH/PML, and ICT killzones. Every zone is ranked 0–100 by a relevance score built from five factors; opacity scales with that score so the eye is drawn to the bright zones while weak ones recede, and a threshold filter deletes the weakest zones entirely to free chart drawing budget. A top-N dashboard ranks the strongest setups by price, direction, age, and score. Three colour schemas — Default (customizable), Dark, and Light — are switchable globally, with all 22 default colours exposed as individual inputs. Per-type drawing caps and an FVG merge engine keep performance steady on busy timeframes.
2. HOW IT WORKS
SMC Event Detection
The script identifies institutional footprints in real time. Every event has its own creation logic and mitigation logic — once price returns and fills the inefficiency, the zone is removed from the chart.
Fair Value Gaps are 3-bar imbalances where the wicks don't touch, rendered as semi-transparent boxes with a centre-line at the consequent encroachment (CE). Order Blocks are the last opposite-coloured candle before a structure break, gated by minimum displacement (× ATR). Breaker Blocks are Order Blocks that flip side after price violates them, indicating role reversal. Liquidity (BSL / SSL) lines mark confirmed swing highs and lows where retail stops cluster, while BPR (Balanced Price Range) zones are detected as overlaps between opposing FVGs — high-probability institutional pivots.
EQH / EQL marks equal highs and lows within an ATR tolerance, identifying magnet liquidity. BOS / CHoCH distinguishes Break of Structure (continuation) from Change of Character (reversal); when a CHoCH prints shortly after a liquidity sweep, it is auto-tagged as Reversal Confirmed . The script also detects Sweep , IDM (Inducement) , and SMT divergence against a configurable reference symbol, and shades Killzones for the Asia, London, NY-AM, and NY-PM sessions in the timezone of your choice.
Confluence Scoring
For every active zone, the script counts how many other zones overlap its price range within an ATR-based tolerance. Confluence between an Order Block, a Fair Value Gap, and a previous-day high is the textbook setup smart-money traders look for — this metric quantifies it.
Composite Relevance Score
Each zone is scored 0–100 from five normalised factors with user-editable weights: Confluence (default 30%) measuring how many other zones overlap, Freshness (20%) decaying exponentially with bars since creation, Displacement (20%) capturing the size of the impulse that created the zone divided by ATR, Trend Alignment (15%) rewarding zones that match the current swing-structure direction, and Proximity (15%) favouring zones near current price normalised by ATR reach. Weights don't have to sum to 100 — normalisation happens internally. The score recalculates every bar, so as price moves the proximity factor updates and the ranking shifts in real time.
Visual Hierarchy
Opacity scales with score — a zone at score 90 is vivid; at score 35 it's nearly transparent. Same colours, different volume. The threshold filter takes this further: anything below a configurable score (default 30) is deleted, not just dimmed — this frees drawing slots and prevents drawing-limit overflow on busy charts. Every zone label optionally appends its score, e.g. "Bull OB 82".
Dashboard Panel
On the last bar, a compact table renders in the chart corner showing the top N zones ranked by score. Each row displays rank, type, price, direction, age in bars, and score with star rating and tier colour (≥80 green, ≥60 teal, ≥40 amber, <40 grey). The table updates with every new bar.
3. HOW TO USE
The Dashboard Workflow
Glance at the dashboard. The top 2–3 zones are your high-probability watchlist for this chart — combine the price level shown with the type and direction to plan your entries. If nothing has a score above 60, the market isn't offering quality setups; wait.
Trading Reversals
Look for this sequence on the chart. First, price sweeps a BSL or SSL line and a sweep label appears. Within a few bars, CHoCH prints — a close back through the opposing swing — and a Reversal Confirmed label fires at that CHoCH point. From there, look for a fresh Order Block or FVG in the direction of the new bias, ideally inside the Discount or Premium zone or the OTE. Enter on retracement to that zone, place your stop beyond the swept extreme, and target the opposite liquidity pool (the BSL or SSL on the other side).
Trading Continuations
After a BOS in the direction of the current trend, the OB or FVG that produced the break becomes a high-probability retracement entry. The dashboard will surface it automatically if its score is in the top tier.
Decluttering for Clarity
The Threshold input is your declutter dial. On a busy 1H chart with 50+ historical zones, set it to 60 — only the cream stays visible. On a clean 15m intraday, set it to 30 to keep more context. At 0, every detected zone is drawn (legacy mode).
Combine With Other Confluence
The scoring system already integrates intra-indicator confluence. For external confluence, overlay your higher-timeframe levels, a volume profile, or session VWAPs — anything that aligns with a high-score zone is a stronger setup.
4. SETTINGS
Settings are organised into logical groups in the dialog.
Structure: swing and internal pivot lengths, BOS / CHoCH toggles, HH/HL/LH/LL labels
Liquidity: BSL/SSL/INT_LQ toggles, sweep window, IDM, Reversal Confirmed
Order Blocks: minimum displacement (× ATR), Breaker conversion on violation
EQH / EQL: ATR tolerance for equal levels
Fair Value Gap: small-gap filter, extension bars, mitigation-on-close, BPR detection
FVG Merge: consolidates old overlapping FVGs by age and ATR tolerance
Volume Imbalance: body-to-body gap detection
Premium / Discount: range plot and OTE zone (62–79% retrace)
Previous H/L: PDH/PDL, PWH/PWL, PMH/PML toggles
SMT: divergence reference symbol (default NQ futures)
Killzones: session backgrounds in selectable timezone
Drawing Limits: per-type caps to control total draw count
Scoring: confluence tolerance, freshness decay, proximity reach, five weights, threshold, opacity toggle, score-in-label toggle
Dashboard: show / rows / position / cell size
Colors: schema enum (Default / Dark / Light) plus 22 individual colour inputs
Style: label size, extension bars, all event label text
5. DESIGN DECISIONS
This indicator was built around three principles.
Decluttering is more valuable than detection. Anyone can detect an FVG — the hard part is knowing which of the twelve currently on screen is the one you should care about. The scoring system exists because the trader's biggest enemy is signal-to-noise, not missing signals.
Every zone should justify its space. Opacity scaling and the threshold-delete behaviour mean that low-conviction zones don't merely fade — they're erased from the drawing pool, so the chart stays performant even on minute-tick instruments with thousands of bars of history. The drawing-limit caps (configurable per event type) reinforce this.
Customisation should be opt-in. The Default schema is the production-ready palette. Most traders won't touch the 22 colour inputs. But for designers who care, every base colour is individually editable. Dark and Light schemas exist as one-click presets for OLED users and light-theme users respectively.
6. CREDITS AND ATTRIBUTION
The Smart Money Concepts framework is a community-developed body of knowledge built on the work of Richard Wyckoff (1930s — accumulation / distribution cycles, composite-man theory), Charles Dow (higher-highs / higher-lows market structure), Michael J. Huddleston / ICT (modern SMC terminology — BOS, CHoCH, Liquidity, Breaker, FVG, OTE, Killzones), and the wider SMC trading community that refined, tested, and disseminated these ideas.
7. DISCLAIMER
For educational and informational purposes only — not financial advice. Past performance does not guarantee future results, and all trading decisions are made at your own risk. The author accepts no liability for any loss arising from use of or reliance on this script. 지표
Ranked Support & Resistance Zones (Zeiierman)█ Overview
Ranked Support & Resistance Zones (Zeiierman) is an adaptive S/R engine that transforms traditional pivot-based support and resistance detection into a dynamic ranking, filtering, and prioritization system.
Instead of plotting every detected level equally, the script stores each support and resistance zone as a structured data object, evaluates its quality in real time using multiple market factors, and continuously ranks all active zones by relative strength.
The result is a cleaner, more intelligent support/resistance framework that focuses on the most relevant zones currently influencing price action.
█ How It Works
⚪ Structured S/R Zone Engine
Each detected support or resistance area is stored as a structured UDT object containing its price range, direction, midpoint, width, mitigation state, touch count, volume behavior, trend alignment, swing quality, internal strength, and overall ranking score.
This allows every zone to behave like an active market structure rather than a static horizontal level.
The script detects resistance from confirmed pivot highs and support from confirmed pivot lows. Each pivot is filtered using ATR-normalized swing quality, helping the system adapt across different assets, volatility conditions, and timeframes.
⚪ Dynamic Quality Ranking
Every S/R zone receives a continuously updated quality score based on:
• Zone width relative to ATR
• Volume behavior
• EMA trend alignment
• Pivot swing quality
• Touch count
• Mitigation progress
• Zone age decay
All S/R zone objects are stored inside an array and ranked using Pine Script’s native UDT collection sorting:
srZones.sort(order.descending, sort_field = "score")
This allows the script to dynamically reorder all active support and resistance zones in real time, prioritizing the strongest market structure while weaker or older zones gradually lose ranking.
⚪ Smart Zone Management
After sorting, only the highest-ranked zones are displayed on the chart while lower-ranked zones remain internally tracked but hidden from view.
Similar zones of the same direction can be absorbed into an existing zone when they are close enough or meaningfully overlapping. This helps reduce clutter and creates cleaner support/resistance areas instead of stacking many nearby levels.
Each zone also tracks mitigation progress. As price trades deeper into a support or resistance zone, mitigation increases, and the zone’s quality score weakens. When the price closes beyond the ATR-based break buffer, the zone is marked as broken and converted into a broken-zone reference.
⚪ Internal Strength Distribution
Every active zone contains bullish and bearish internal pressure components displayed as live strength bars inside the zone.
█ How to Use
⚪ Focus on Top-Ranked Zones
Only the strongest support and resistance zones are displayed based on current market conditions and quality ranking.
⚪ Read Internal Strength Bars
• Strong support strength → stronger demand-side defense
• Strong resistance strength → stronger supply-side rejection
• Balanced pressure → weaker or less decisive structure
• Opposing pressure growth → increasing risk of mitigation or break
⚪ Watch for Retests and Mitigation
Support and resistance zones are most useful when the price revisits them after they form.
Strong reactions often show:
• Immediate rejection or bounce from the zone
• Respect for the zone boundaries
• Continuation away from the level
• Internal strength remaining aligned with the zone direction
Deeper or repeated retests can weaken the zone over time as mitigation increases and quality decays.
█ Related Scripts
Ranked FVG Imbalance Zones (Zeiierman)
Ranked Order Block Zones (Zeiierman)
█ Settings
Show Top Zones: Controls how many of the highest-ranked support and resistance zones are displayed.
Max Stored Zones: Controls the maximum number of S/R zones that can be tracked internally.
Pivot Length: Defines how many candles are required on each side to confirm a pivot high or pivot low.
Min Pivot ATR: Defines the minimum ATR-normalized pivot strength required for zone creation.
Absorb Similar Zones: Controls how close or overlapping zones must be before they are absorbed into an existing zone.
Zone Width ATR: Controls the thickness of each support/resistance zone.
Volume MA Length: Defines the baseline used for volume behavior scoring.
Trend EMA Length: Defines the EMA used for trend alignment scoring.
Break Close Buffer ATR: Controls how far the price must close beyond a zone before it is considered broken.
Keep Broken Zones: Controls how many broken zones remain visible after invalidation.
Direction Filter: Allows displaying all zones, support-only, or resistance-only.
Show Strength Bars: Shows or hides bullish and bearish internal strength bars inside each zone.
Show Zone Text: Shows or hides smart zone labels such as Weak Support, Strong Resistance, or Mitigated Support.
-----------------
Disclaimer
The content provided in my scripts, indicators, ideas, algorithms, and systems is for educational and informational purposes only. It does not constitute financial advice, investment recommendations, or a solicitation to buy or sell any financial instruments. I will not accept liability for any loss or damage, including without limitation any loss of profit, which may arise directly or indirectly from the use of or reliance on such information.
All investments involve risk, and the past performance of a security, industry, sector, market, financial product, trading strategy, backtest, or individual's trading does not guarantee future results or returns. Investors are fully responsible for any investment decisions they make. Such decisions should be based solely on an evaluation of their financial circumstances, investment objectives, risk tolerance, and liquidity needs.
지표

Automatic Support & Resistance1. Overview
This is an automatic Support and Resistance (S/R) level detector for TradingView. It identifies significant price pivots (peaks and troughs) based on user-defined settings and plots up to 8 dynamic levels on your chart.
The script is intended for educational and informational purposes to demonstrate automatic S/R detection using pivot points and to help traders identify potential areas of interest.
2. Key Logic & Features
A. Pivot Detection
The script detects price pivots (local highs and lows) using ta.pivothigh() and ta.pivotlow().
Two detection speeds:
Regular Pivots: Use the Right Bars setting to define the confirmation period.
Quick Pivots: Use the Quick Right setting for more sensitive, faster-moving levels.
Source Selection: Choose between using Close price or High/Low values for detection.
B. Level Hierarchy
The script plots eight levels, organized as:
Resistance Levels (Red/Green): Levels 1, 3, 5, 7 (top 4 lines).
Support Levels (Red/Green): Levels 2, 4, 6, 8 (bottom 4 lines).
C. Visual Customization (NEW)
Line Styles: Independently set the style for Resistance and Support lines:
Solid (default for both)
Dotted (uses plot.style_circles)
Dashed (uses plot.style_stepline)
Color Logic: Each level dynamically changes color:
Green: Current close price is above the level (bullish context).
Red: Current close price is below the level (bearish context).
D. Additional Features
show_last=1: Only the most recent segment of each level is shown, keeping the chart clean.
trackprice=true: Extends the line horizontally to the right edge of the chart for easy reference.
3. User Inputs (Customization)
Input Description Default
Left Bars Number of bars to the left of a pivot. 50
Right Bars Number of bars to the right of a pivot (confirmation). 25
Quick Right Faster confirmation period for quick pivots. 5
Source Use Close or High/Low for pivot detection. Close
Resistance Line Style Style for top (resistance) levels. Solid
Support Line Style Style for bottom (support) levels. Solid
4. How to Use
Add the script to any chart.
Adjust Pivot Sensitivity:
Increase Left Bars and Right Bars for longer-term, stronger S/R levels.
Decrease them for more, shorter-term levels.
Use Quick Right to add a more sensitive, faster-responding layer.
Interpret the Levels:
Resistance (top lines): Price may face selling pressure when approaching these levels from below.
Support (bottom lines): Price may find buying pressure when approaching these levels from above.
Green level: Price is currently trading above that level (potentially acting as support).
Red level: Price is currently trading below that level (potentially acting as resistance).
Combine with other tools: Use this as one component of a complete trading strategy, alongside trend indicators, candlestick patterns, or volume analysis.
5. Compliance & Transparency
No Financial Advice: This script is strictly for educational and informational purposes. It does not provide financial advice, trading recommendations, or guaranteed results. All trading decisions are your own responsibility.
Original Work: The code is the original work of the author, based on standard Pine Script pivot functions (ta.pivothigh, ta.pivotlow). It is published under the Mozilla Public License 2.0.
No Guarantee: The accuracy, reliability, or profitability of the detected S/R levels is not guaranteed. Different market conditions may require different parameter adjustments.
6. Technical Notes & Limitations
Version: Converted to Pine Script v6 for optimal performance and future compatibility.
Repainting: Pivot-based levels are non-repainting by nature (ta.pivothigh/low only confirms after the right bars have passed). However, the dynamic coloring reacts to each new bar's close.
Performance: The script is lightweight and runs efficiently on most charts.
7. Credits & Open Source
This script is published under the Mozilla Public License 2.0. You are free to use, modify, and share this code for non-commercial purposes, provided you retain the original license and attribution. No private keys, external dependencies, or hidden functions are included. 지표

지표

지표
지표

AetherEdge - STRUCTURA Adaptive Price-Action Intelligence🖊️ Overview
STRUCTURA fuses the three pillars of price action — market structure, order blocks, and fair value gaps — with a self-learning AI layer. Built on a non-repainting foundation that reads structure only from confirmed swings, its online learning discovers from the market which zones actually work and attaches a probabilistic confidence to every reversal. Unlike conventional tools that merely draw price structure, STRUCTURA continuously updates its weights from experience — emphasizing what works, fading what doesn't — adapting to the market itself.
🔶 Key Features
Automatic market structure: real-time BOS (continuation) and CHoCH (reversal) detection from confirmed swings
Swing-point classification (HH/HL/LH/LL) for wave-structure visualization
Volumetric order blocks: the last opposite-color candle before a structure break, zoned with recorded volume
Mitigation tracking: detects when price returns into a zone and visually distinguishes consumed zones (Wick/Close methods)
Fair Value Gaps: detects 3-candle imbalances and tracks fills at the midpoint
Adaptive zone reliability: online-learns each zone type's reaction success rate and emphasizes reliable types visually
CHoCH confidence: an online logistic regression predicts each CHoCH's "hold probability," auto-dimming low-confidence signals
Refined red/green jewel-tone palettes (three options) with a gold-framed integrated HUD
Built-in BOS/CHoCH alert conditions
🧠 Technical Architecture
STRUCTURA's foundation is confirmed-swing detection. Swing highs and lows confirm with a few bars of lag, and in exchange gain non-repainting permanence — their positions never change once printed. From these confirmed swings, a market-structure state machine is driven. When price closes above the last swing high, it is judged a CHoCH (character change) if the prevailing trend was bearish, or a BOS (continuation) if bullish, with symmetric handling on the low side.
Order blocks are identified by scanning back to the last opposite-color candle before a structure break, capturing its high, low, and volume as a zone. Each zone tracks its own mitigation state, transitioning to a dotted style once price returns and consumes it. Fair value gaps are detected as 3-candle imbalances where the current low exceeds the high two bars prior (or the symmetric decline), extended rightward until price reaches the midpoint.
Two AI layers sit atop this. The first, adaptive zone reliability, observes whether price reacts off or breaks through a zone upon entry, updating each zone type's reaction success rate via an exponentially-weighted moving average. This learns which zone types actually function in the current market and quantifies it as reliability. The second, CHoCH confidence, is an online logistic regression taking standardized momentum, body strength, and volume as features. When a CHoCH fires it predicts whether the change will continue in the new direction, then labels the outcome after a set horizon and updates its weights via stochastic gradient descent. The learned probability is shown on each CHoCH label, and low-confidence reversals are automatically dimmed, visually separating fakeouts from genuine turns.
⚙️ Recommended Settings & Tuning Guide
STRUCTURA is tuned with crypto in mind. On majors like BTC and ETH, Swing Length near 10 balances structural granularity against lag. On higher-volatility names such as SOL and XRP, widening Swing Length to 12–15 suppresses noise structure and clarifies major BOS/CHoCH events.
Swing Length is the master sensitivity parameter — larger captures only major structure, smaller picks up short-term structure. For swing trading, 15–20 is a guide; for intraday, 8–12. In the AI layer, raising the Zone Learning Rate makes reliability track the current regime faster; lowering it stabilizes over the long run. The CHoCH Model Learning Rate and Outcome Horizon control the reversal probability's responsiveness and evaluation window. If order blocks or FVGs become too dense, adjust the Max display counts and Min Gap Size.
💡 How to Use in Practice
The highest-conviction setups are confluences where multiple elements align. For example, a bullish CHoCH flipping structure, with a high-reliability bullish order block beneath it and an unfilled FVG nearby, forms a strong long-consideration point. Checking the HUD's zone reliability and prioritizing the zone types actually working in the current market helps avoid overtrusting zones that don't function.
The CHoCH confidence % is a unique gauge of reversal reliability. High-confidence CHoCHs are strong evidence of a trend turn, while low-confidence ones (auto-dimmed) suggest patience. For multi-timeframe trading, pair a higher-timeframe STRUCTURA to read the macro structure and order blocks with a lower timeframe for precise entry timing. Overlaying order blocks and FVGs with volume profile and key horizontal levels further deepens the interpretation of where liquidity concentrates.
⚠️ Important Notes
Because this tool is based on confirmed swings, structure signals confirm with a few bars of lag in real time — a necessary property of an honest, non-repainting design. The AI layer requires accumulated data to learn, so near the chart's left edge or when CHoCH occurrences are few, reliability remains at its initial values (zones 50%, CHoCH accuracy 50%). Static HUD values are a sign that learning data is still insufficient. Whether CHoCH model accuracy stably exceeds 50% depends on the instrument, timeframe, and period, and cannot overcome the fundamental constraint of market predictability.
🚨 Disclaimer
This indicator is provided for educational and informational purposes only and does not constitute financial or investment advice. No signal guarantees future profit, and past performance does not indicate future results. All trading decisions are made at your own risk; please use this tool with sound risk management and your own independent verification. 지표
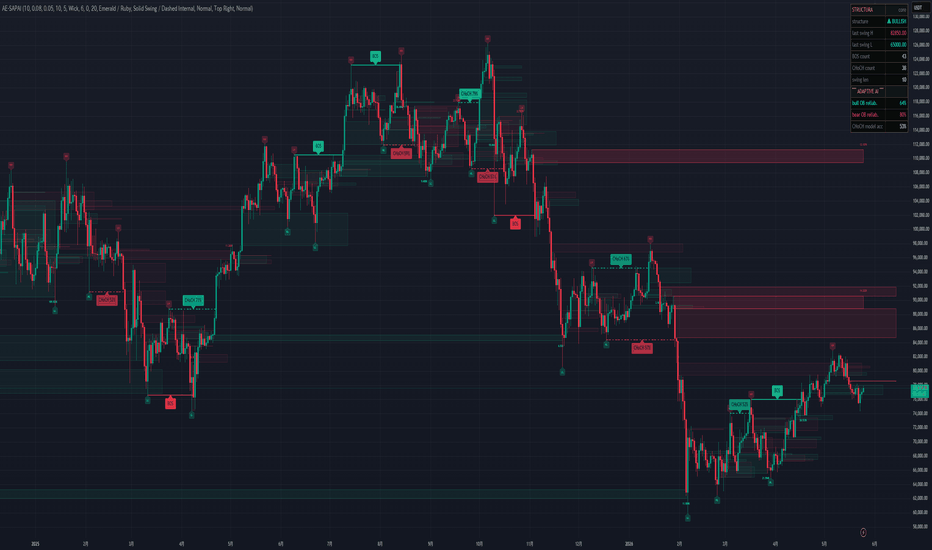
Air Pocket Profile [FEELS]Most volume tools show you where price has traded. This one also shows you where it has not — the thin zones price tends to move through quickly.
Air Pocket Profile builds a volume profile from price-range distribution, then highlights the heavy shelves where trading concentrated, the single peak-volume anchor, and the air pockets — price ranges that accumulated very little volume. A standard volume profile leaves low-volume areas as empty space. This script treats that empty space as information and draws it explicitly.
What makes it different
A traditional volume profile renders one heatmap and asks you to read the rest yourself. Air Pocket Profile separates the structure into distinct, labelled objects so the chart is readable at a glance: filled shelves, a glowing anchor line, and outlined air pocket zones with text tags. It also distinguishes recent volume from old volume by colour, marks bars that travelled through a pocket, and tracks how the volume anchor migrates over time.
How it works
The profile is built with a range-weighted distribution. Each historical bar spreads its volume across every price row it spans, from low to high, weighted by an impulse factor based on candle body size (0.7 + 0.6 × body ratio). This differs from a close-based profile, where each bar contributes only to a single row.
Row classification: with peak as the heaviest row and mean as the average row volume, each row is rescaled by min(rowVolume / mean / 2, 1) ^ contrast. Rows above average stay vivid, rows below it fade out.
-High Volume Nodes (HVN) — local maxima of the profile, ranked by volume. Shelves where price tends to slow.
-Volume Anchor — the single heaviest row, drawn as a glow line. The strongest reference level in the window.
-Air Pockets — continuous runs of rows below the air pocket threshold. Price tends to travel through them with little resistance.
-Fresh volume — volume traded within the fresh window is coloured separately, so recent levels stand apart from old ones.
-Anchor shift — the anchor position is recorded each bar and compared to its position N bars ago to report migration direction.
How to use it
-Air pockets are low-resistance ranges. When price enters one, expect faster movement and fewer reaction points until the next shelf.
-HVN levels and the anchor are high-resistance areas where price tends to slow, stall, or react.
-Profile balance shows the share of volume above vs below the anchor — directional context for the window.
-Fresh volume share shows how much of the structure was built recently.
-Anchor shift shows whether the centre of traded volume is migrating up or down.
Parameters
-Lookback — bars used to build the profile.
-Resolution — vertical row count.
-Air pocket threshold / Min pocket size — how thin and how tall a zone must be to count as a pocket.
-Profile contrast — how hard weak rows fade relative to strong ones.
-Fresh window — how many recent bars count as fresh.
-Node count — how many HVN levels to display.
-Anchor shift window / display — comparison window and direction-only vs direction-with-percent.
-Signal toggles — acceptance/rejection marks and air pocket transit marks can each be turned on or off.
Notes
Tested across BTC, ETH and other liquid assets on 1H, 4H, 1D and 1W. On instruments without volume data the profile falls back to a range-based weight. Behaviour marks are based on confirmed bars to avoid intrabar repainting. This is an analysis tool, not a signal service, and should be combined with your own risk management.
The script uses a custom range-weighted profile model and explicit low-volume zone detection to make thin areas visible. 지표
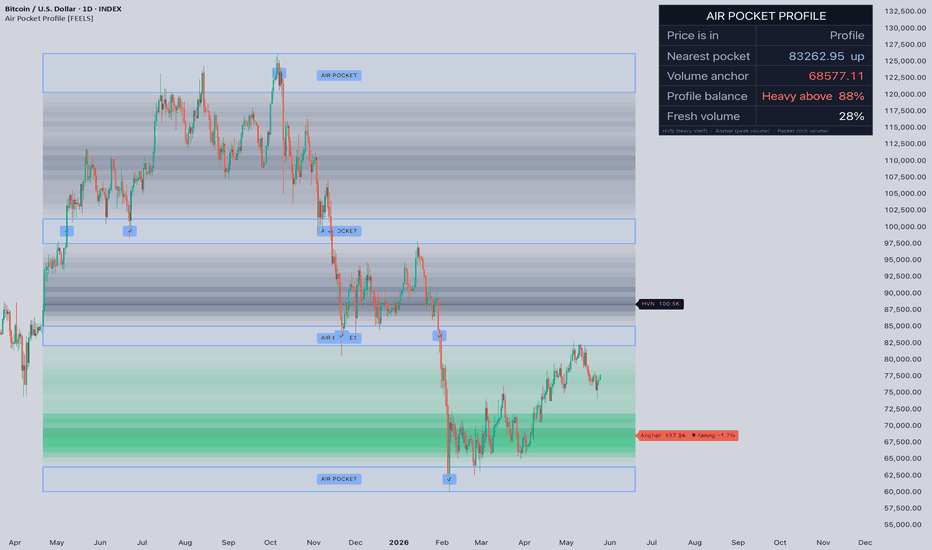
Wave Structure Projection MapWave Structure Projection Map
Wave Structure Projection Map is a pivot-based structure analysis tool designed to organize swing highs, swing lows, ABC corrective structure, Fibonacci retracement levels, and forward projection guides into one visual framework.
The script is built to help users study how price forms swing structure, how pullbacks behave inside a broader move, where a possible C-point may develop, and where retracement or extension reference levels may become important.
It does not provide buy or sell recommendations. The purpose of this script is to help users analyze wave-like price structure, corrective movement, retracement behavior, and potential continuation or invalidation zones.
────────────────────
Core Concept
────────────────────
This script is based on the idea that market structure often moves in swings rather than in a straight line.
Price tends to form:
• impulsive moves
• corrective pullbacks
• retracement zones
• continuation or invalidation points
This script focuses on a practical swing-structure workflow rather than strict automatic Elliott Wave counting.
The main concept is:
1. Detect meaningful pivot highs and pivot lows
2. Build a ZigZag-style structure map
3. Evaluate whether the recent sequence resembles an ABC corrective structure
4. Measure the pullback using Fibonacci retracement logic
5. Project possible continuation paths and extension guides from the C-point
This approach helps users review whether a pullback is shallow, normal, deep, or structurally weak.
────────────────────
What This Script Shows / What It Detects
────────────────────
The script can display:
• swing highs and swing lows
• ZigZag structure lines
• ABC structure labeling
• Fibonacci retracement levels
• projected extension guides
• projection fan lines
• trend zone context
• continuation breakout / breakdown tags
• structure invalidation status
• pullback-zone context
These elements are intended to help users understand where the current structure stands and how recent swings connect with retracement and continuation behavior.
────────────────────
How It Works
────────────────────
1. The script detects pivot highs and pivot lows using the selected swing length.
2. It stores recent pivots and organizes them into a ZigZag-style structure map.
3. The latest three-pivot sequence is evaluated as a possible A-B-C corrective structure.
4. The BC leg is measured relative to the AB leg.
5. The retracement is filtered using minimum and maximum retracement settings.
6. Additional range and trend filters can be used to reduce weaker structures.
7. If the structure is valid, the script draws Fibonacci retracement levels based on the active swing.
8. Projection fan lines are drawn forward from the C-point to visualize possible continuation paths.
9. AB=CD, 1.272, and 1.618 style extension guides are also plotted as reference objectives.
10. If price breaks beyond the B-point with the selected ATR buffer, the script can classify the move as a continuation breakout or continuation breakdown.
11. If price violates the base structure, the script can label the setup as invalidated.
This allows the indicator to function as a structured pullback and continuation map rather than a simple swing marker.
────────────────────
Inputs And Customization
────────────────────
Users can adjust:
• swing detection length
• pivot memory
• swing label count
• projection lookahead distance
• trend zone visibility
• ZigZag visibility
• pivot label visibility
• Fibonacci visibility
• projection fan visibility
• ABC label visibility
• structure tag visibility
• impulse extension guide visibility
• minimum and maximum retracement thresholds
• valid-bars-after-C limit
• range filter sensitivity
• ATR-based structure distance filter
• breakout ATR buffer
• optional trend-alignment requirement
• ATR and trend-factor settings
• zone width settings
• line, label, and projection colors
The default settings are intended to provide a balanced view of swing structure without forcing very small or overly noisy pivots into the map.
────────────────────
How To Use
────────────────────
This script is best used as a structure-analysis and projection-assistance tool.
General interpretation examples:
• A clear ABC structure can help users study whether the current move is a pullback inside a larger trend or the start of a deeper reversal.
• Fibonacci retracement levels can help users review whether the pullback is occurring in a commonly observed retracement zone.
• The C-point can be treated as a structural reference area, not as a guaranteed turning point.
• A continuation breakout tag can help users review whether price is moving beyond the corrective structure.
• A structure invalidation label can help users identify where the prior wave interpretation is no longer supported.
• Projection fan lines and extension guides can be used as forward reference paths, not as fixed price targets.
This script is best reviewed together with higher-timeframe structure, support and resistance, trend context, and price-action confirmation.
────────────────────
Confirmation And Repainting Notes
────────────────────
This script uses pivot highs and pivot lows.
Pivot-based structures require bars on both sides of the turning point before they become confirmed.
Because of that, swing labels and related structure lines are naturally confirmed after the pivot is formed.
The script does not use future price data to predict exact market direction, but the pivot-confirmation process means that structural labels appear only after the relevant swing is confirmed.
Users should understand that this is normal behavior for pivot-based structure tools.
────────────────────
Limitations
────────────────────
This script does not predict future price movement.
It does not provide buy or sell recommendations.
An ABC structure does not guarantee continuation or reversal.
A Fibonacci retracement level does not guarantee support or resistance.
Projection fan lines and extension levels are forward reference tools, not promises of future path or target completion.
In highly volatile or choppy conditions, price structure may become noisy and less reliable.
This script should not be used as a standalone trading system.
────────────────────
Disclaimer
────────────────────
This publication is for educational and informational chart analysis only.
It does not constitute financial advice, investment advice, or a recommendation to buy or sell any financial instrument.
All trading and investment decisions are the responsibility of the user.
━━━━━━━━━━━━━━━━━━━━
Wave Structure Projection Map
Wave Structure Projection Map는 pivot 기반 구조 분석 도구로, 스윙 고점과 저점, ABC 보정 구조, Fibonacci 되돌림 레벨, 그리고 전방 투영 가이드를 하나의 시각적 프레임워크 안에서 정리하도록 설계된 보조지표입니다.
이 스크립트는 가격이 어떤 스윙 구조를 만들고 있는지, 더 큰 움직임 안에서 눌림이 어떻게 진행되는지, 잠재적인 C포인트가 어디에서 형성되는지, 그리고 어떤 되돌림 또는 확장 레벨이 중요해질 수 있는지를 분석하는 데 도움을 주기 위해 만들어졌습니다.
이 지표는 매수 또는 매도 추천을 제공하지 않습니다. 목적은 파동형 가격 구조, 보정 움직임, 되돌림 행동, 그리고 잠재적인 지속 또는 무효화 구간을 분석하는 것입니다.
────────────────────
핵심 개념
────────────────────
이 스크립트는 시장 구조가 직선으로 움직이기보다 스윙 단위로 전개되는 경우가 많다는 개념을 바탕으로 합니다.
가격은 보통 다음과 같은 구조를 만듭니다.
• 추세성 진행 구간
• 보정성 눌림 구간
• 되돌림 구간
• 지속 또는 무효화 구간
이 스크립트는 정통 자동 Elliott Wave 카운팅보다는, 실전에서 활용하기 쉬운 스윙 구조 해석 흐름에 초점을 둡니다.
핵심 흐름은 다음과 같습니다.
1. 의미 있는 pivot high / low 감지
2. ZigZag 스타일 구조 형성
3. 최근 시퀀스가 ABC 보정 구조에 가까운지 평가
4. AB 대비 BC의 되돌림 비율 측정
5. C포인트 이후의 잠재적 진행 경로와 확장 가이드 투영
이 접근법은 현재 눌림이 얕은지, 정상적인지, 깊은지, 구조적으로 약한지를 검토하는 데 도움이 됩니다.
────────────────────
이 스크립트가 보여주는 것 / 감지하는 것
────────────────────
이 스크립트는 다음 요소를 표시할 수 있습니다.
• 스윙 고점과 스윙 저점
• ZigZag 구조 라인
• ABC 구조 라벨
• Fibonacci 되돌림 레벨
• 전방 확장 가이드
• Projection fan 라인
• Trend zone 컨텍스트
• continuation breakout / breakdown 태그
• structure invalidation 상태
• pullback-zone 컨텍스트
이 요소들은 현재 구조가 어떤 단계에 있는지, 최근 스윙이 되돌림과 지속 구조와 어떻게 연결되는지를 이해하는 데 도움을 주기 위한 시각적 참고 자료입니다.
────────────────────
작동 방식
────────────────────
1. 선택한 swing length를 기준으로 pivot high와 pivot low를 감지합니다.
2. 최근 pivot들을 저장하고 ZigZag 스타일 구조 맵으로 정리합니다.
3. 최신 3개 pivot 시퀀스를 잠재적 A-B-C 보정 구조로 평가합니다.
4. BC 구간을 AB 구간 대비 얼마나 되돌렸는지 측정합니다.
5. 최소 및 최대 retracement 기준으로 구조를 필터링합니다.
6. 추가적인 range 필터와 trend 필터로 약한 구조를 줄일 수 있습니다.
7. 구조가 유효하면, 활성 스윙 기준으로 Fibonacci 되돌림 레벨을 그립니다.
8. C포인트 이후에는 projection fan 라인을 앞으로 연장해 잠재적 진행 경로를 시각화합니다.
9. AB=CD, 1.272, 1.618 형태의 확장 가이드도 참고용으로 함께 표시합니다.
10. 가격이 선택된 ATR buffer를 포함해 B포인트를 돌파하면 continuation breakout 또는 continuation breakdown으로 분류할 수 있습니다.
11. 가격이 기본 구조를 무너뜨리면 setup invalidated 상태로 표시할 수 있습니다.
즉, 이 지표는 단순한 스윙 마커가 아니라 구조화된 눌림 및 지속 맵으로 작동하도록 설계되었습니다.
────────────────────
입력값 및 설정
────────────────────
사용자는 다음 항목을 조정할 수 있습니다.
• swing detection length
• pivot memory
• swing label count
• projection lookahead distance
• trend zone visibility
• ZigZag visibility
• pivot label visibility
• Fibonacci visibility
• projection fan visibility
• ABC label visibility
• structure tag visibility
• impulse extension guide visibility
• minimum and maximum retracement thresholds
• valid-bars-after-C limit
• range filter sensitivity
• ATR 기반 구조 거리 필터
• breakout ATR buffer
• optional trend-alignment requirement
• ATR 및 trend-factor settings
• zone width settings
• line, label, and projection colors
기본 설정은 너무 작은 pivot이나 과도한 노이즈를 억지로 구조에 포함시키지 않으면서, 균형 잡힌 스윙 구조를 보여주도록 설계되어 있습니다.
────────────────────
사용 방법
────────────────────
이 스크립트는 구조 분석 및 projection 보조 도구로 사용하는 것이 적절합니다.
일반적인 해석 예시는 다음과 같습니다.
• 명확한 ABC 구조는 현재 움직임이 큰 추세 안의 눌림인지, 아니면 더 깊은 반전의 시작인지 검토하는 데 도움이 될 수 있습니다.
• Fibonacci 되돌림 레벨은 현재 눌림이 자주 관찰되는 되돌림 구간에서 진행되고 있는지 확인하는 데 사용할 수 있습니다.
• C포인트는 확정적인 반전점이 아니라 구조적 기준점으로 해석하는 것이 적절합니다.
• continuation breakout 태그는 가격이 보정 구조를 넘어 다시 진행하는지 검토하는 데 사용할 수 있습니다.
• structure invalidation 라벨은 기존 구조 해석이 더 이상 유효하지 않은 위치를 확인하는 데 도움을 줄 수 있습니다.
• projection fan 라인과 extension 가이드는 미래 경로에 대한 참고선이지, 고정된 목표가가 아닙니다.
이 스크립트는 상위 시간대 구조, 지지와 저항, 추세 컨텍스트, 가격 행동 확인과 함께 보는 것이 좋습니다.
────────────────────
확인봉 및 리페인트 안내
────────────────────
이 스크립트는 pivot high와 pivot low를 사용합니다.
Pivot 기반 구조는 전환점 양쪽에 일정 수의 봉이 형성되어야 확정됩니다.
따라서 스윙 라벨과 관련 구조선은 해당 pivot이 확인된 뒤에 자연스럽게 표시됩니다.
이 스크립트는 미래 가격 데이터를 사용해 방향을 예측하지 않지만, pivot 확정 과정 자체 때문에 구조 라벨은 관련 스윙이 확인된 뒤에만 나타납니다.
이는 pivot 기반 구조 지표에서 정상적인 동작입니다.
────────────────────
한계
────────────────────
이 스크립트는 미래 가격 움직임을 예측하지 않습니다.
매수 또는 매도 추천을 제공하지 않습니다.
ABC 구조가 나타났다고 해서 반드시 추세 지속이나 반전을 보장하지는 않습니다.
Fibonacci 되돌림 레벨이 반드시 지지나 저항으로 작동하는 것은 아닙니다.
Projection fan 라인과 extension 레벨은 참고용 전방 가이드일 뿐, 실제 경로나 목표 달성을 보장하지 않습니다.
변동성이 매우 크거나 횡보가 심한 구간에서는 구조가 노이즈처럼 보일 수 있으며 신뢰도가 낮아질 수 있습니다.
이 스크립트를 단독 매매 시스템으로 사용해서는 안 됩니다.
────────────────────
중요 고지
────────────────────
본 게시물은 교육 및 정보 제공 목적의 차트 분석 자료입니다.
투자 자문, 매수·매도 추천, 특정 금융상품 거래 권유를 의미하지 않습니다.
모든 투자 판단과 그 결과에 대한 책임은 이용자 본인에게 있습니다. 지표

Liquidity Sweep Trap ZonesLiquidity Sweep Trap Zones
Liquidity Sweep Trap Zones is a liquidity-based market structure tool designed to detect swing high and swing low sweeps, possible stop-hunt behavior, trap confirmation zones, and mitigation behavior around swept liquidity levels.
The script evaluates whether price temporarily breaks above a previous swing high or below a previous swing low, then reclaims the level through wick or close behavior. It combines sweep penetration, wick quality, ADX / DMI strength, EMA regime, Ichimoku cloud context, volatility activity, premium / discount location, and zone health tracking to filter weaker sweep events.
It does not provide buy or sell recommendations. The purpose of this script is to help users study liquidity sweeps, false breakouts, trap zones, mitigation behavior, and possible reversal or continuation risk around important swing levels.
────────────────────
Core Concept
────────────────────
Liquidity sweep analysis is based on the idea that price often moves beyond visible swing highs or swing lows before reversing or continuing.
A swing high sweep occurs when price moves above a previous high, potentially triggering breakout entries or stop orders, then fails to hold above that level.
A swing low sweep occurs when price moves below a previous low, potentially triggering breakdown entries or stop orders, then fails to hold below that level.
This script focuses on four liquidity-related concepts:
• Swing high and swing low sweep detection
• Wick reclaim or close reclaim behavior
• Trap confirmation after a swept level
• Liquidity zone tracking and mitigation awareness
When price sweeps a previous swing high and reclaims below it, the script may identify a bearish liquidity trap zone.
When price sweeps a previous swing low and reclaims above it, the script may identify a bullish liquidity trap zone.
The script then uses confirmation and scoring logic to separate stronger trap structures from weaker sweep events.
────────────────────
What This Script Shows
────────────────────
The script can display:
• Bearish liquidity sweep markers
• Bullish liquidity sweep markers
• Bearish trap confirmation labels
• Bullish trap confirmation labels
• Sweep wick zones
• Liquidity sweep reference levels
• Mitigated or expired zone behavior
• Trap score percentages
• Zone health information
• Zone retest count information
These elements are intended to help users review where price interacted with prior liquidity, whether the sweep was reclaimed, and whether the zone remains structurally relevant.
────────────────────
How It Works
────────────────────
1. The script identifies confirmed swing highs and swing lows using pivot-based structure.
2. It monitors whether price breaks above a swing high or below a swing low.
3. ATR is used to normalize sweep penetration so the script can avoid extremely small or excessively large sweeps.
4. Wick ratio logic checks whether the candle shows meaningful rejection around the swept level.
5. ADX and DMI conditions evaluate whether the market has enough directional activity or is trapped in low-energy chop.
6. EMA regime and optional Ichimoku cloud context help evaluate the broader trend environment.
7. Premium / discount logic checks whether the sweep occurs in a more contextually meaningful part of the recent dealing range.
8. Volume and ATR activity filters help reduce weak or inactive market signals.
9. When a sweep is detected, the script creates a liquidity zone around the swept wick and reference level.
10. Trap confirmation can occur immediately or after follow-through, depending on the selected settings.
11. The script assigns a trap score based on reclaim quality, wick behavior, volume, ADX, DMI alignment, regime context, premium / discount location, and candle range.
12. Zone health and tested-count tracking help users review whether a liquidity zone has been repeatedly interacted with or weakened over time.
13. Mitigation logic can mark a level as no longer structurally fresh once price reclaims through it.
────────────────────
Visual Elements
────────────────────
The script includes:
• SWEEP marker
• TRAP↑ label
• TRAP↓ label
• TRAP↑+ label for stronger bullish trap structures
• TRAP↓+ label for stronger bearish trap structures
• Liquidity sweep level line
• Sweep wick zone top and bottom lines
• Semi-transparent sweep zone fill
• Optional weak trap marker
• Trap confidence percentage
• Zone health value
• Zone tested-count value
SWEEP marks a raw liquidity sweep event.
TRAP↑ marks a bullish trap confirmation after a downside sweep.
TRAP↓ marks a bearish trap confirmation after an upside sweep.
TRAP↑+ and TRAP↓+ mark stronger trap structures based on the internal score threshold.
The sweep zone shows the wick area and reference level used by the script while evaluating the liquidity event.
────────────────────
Inputs And Customization
────────────────────
Users can adjust:
• Swing length
• Sweep trigger mode
• Confirmation on candle close
• Minimum and maximum sweep penetration
• Minimum sweep wick ratio
• Local extreme lookback
• Sweep cooldown
• Same-level blocking distance
• ATR length
• Volume moving average length
• Follow-through confirmation behavior
• Trap confirmation window
• Strong and valid trap score thresholds
• ADX and DMI filters
• EMA regime filter
• Ichimoku cloud context
• ATR activity filter
• Volume activity filter
• Spike sweep blocking
• Premium / discount range
• Liquidity zone visibility
• Zone holding period
• Zone mitigation tracking
• Zone health capacity
• Strong, valid, weak, and sweep marker visibility
• Trap label display
• Marker and zone colors
The default settings are designed to focus on visible liquidity sweep structures while reducing low-quality signals from narrow chop, inactive volatility, repeated mitigated levels, or extreme one-candle spikes.
────────────────────
Reference Markers
────────────────────
The script includes several reference markers and zones.
SWEEP:
Shows when price sweeps a previous swing high or swing low and satisfies the selected reclaim and wick conditions.
TRAP↑:
Shows when a downside liquidity sweep develops into a bullish trap confirmation.
TRAP↓:
Shows when an upside liquidity sweep develops into a bearish trap confirmation.
TRAP↑+:
Shows when a bullish trap confirmation reaches the stronger score threshold.
TRAP↓+:
Shows when a bearish trap confirmation reaches the stronger score threshold.
Sweep Wick Zone:
Shows the wick area created by the sweep candle.
Liquidity Sweep Level:
Shows the prior swing level that was swept and reclaimed.
Zone Health:
Shows a simplified measure of how much interaction the zone has absorbed relative to the configured volume capacity.
Test Count:
Shows how many times the zone has been meaningfully retested after formation.
These markers are not trading signals. They are visual reference points for studying liquidity behavior, false breakouts, stop-hunt style movement, and trap confirmation around prior swing levels.
────────────────────
How To Use
────────────────────
Use this script as a liquidity sweep and trap-zone viewer.
General interpretation examples:
• A sweep above a prior swing high can show where upside liquidity may have been taken.
• A sweep below a prior swing low can show where downside liquidity may have been taken.
• A bearish trap label can help review failed upside breakout behavior.
• A bullish trap label can help review failed downside breakdown behavior.
• A stronger trap label can help identify sweeps with better context, rejection, and scoring conditions.
• A liquidity zone can help users monitor whether the swept area remains relevant.
• Zone health and test count can help users evaluate whether a level is fresh, repeatedly tested, or weakened.
• Mitigation behavior can help users avoid treating old levels as fresh liquidity areas.
This script is best reviewed together with price action, market structure, support and resistance, volume, volatility, and higher-timeframe trend context.
────────────────────
Confirmation And Repainting Notes
────────────────────
The script uses pivot-based swing highs and swing lows. Pivot structures require bars on both sides of the swing point before they are confirmed.
Because of this, swing reference levels appear only after the pivot condition is confirmed.
Sweep and trap conditions are calculated from available chart data. If confirmation on candle close is enabled, signals are intended to be evaluated after the candle closes.
If users disable close confirmation or use realtime bars, intrabar movement may change sweep, reclaim, or trap conditions before the candle closes.
The script does not use future price data to predict upcoming price movement. However, pivot-based swing references are naturally confirmed after a delay because the swing structure itself requires confirmation bars.
────────────────────
Limitations
────────────────────
This script does not predict future price movement.
It does not provide buy or sell recommendations.
A liquidity sweep does not guarantee reversal.
A trap label does not guarantee continuation in the opposite direction.
Strong trap scores only indicate that the event satisfied more of the selected structural, volatility, regime, and activity conditions.
In very strong trends, price can sweep liquidity and continue in the same direction.
In choppy, low-liquidity, news-driven, or extremely volatile conditions, sweep and trap signals may become less reliable.
This script should not be used as a standalone trading system.
────────────────────
Disclaimer
────────────────────
This publication is for educational and informational chart analysis only.
It does not constitute financial advice, investment advice, or a recommendation to buy or sell any financial instrument.
All trading and investment decisions are the responsibility of the user.
━━━━━━━━━━━━━━━━━━━━
Liquidity Sweep Trap Zones
Liquidity Sweep Trap Zones는 스윙 고점과 스윙 저점의 유동성 스윕, 잠재적인 스탑헌팅 움직임, 트랩 확인 구간, 스윕된 유동성 레벨 주변의 미티게이션 행동을 분석하기 위한 유동성 기반 시장 구조 보조지표입니다.
이 스크립트는 가격이 이전 스윙 고점 위 또는 이전 스윙 저점 아래를 일시적으로 돌파한 뒤, wick 또는 종가 기준으로 해당 레벨을 다시 회수하는지 평가합니다. 스윕 침투 깊이, wick 품질, ADX / DMI 강도, EMA 레짐, 일목구름 컨텍스트, 변동성 활동성, 프리미엄 / 디스카운트 위치, 존 헬스 추적을 함께 사용해 약한 스윕 이벤트를 필터링합니다.
이 지표는 매수 또는 매도 추천을 제공하지 않습니다. 목적은 유동성 스윕, 거짓 돌파, 트랩 구간, 미티게이션 행동, 주요 스윙 레벨 주변의 반전 또는 지속 위험을 관찰하는 것입니다.
────────────────────
핵심 개념
────────────────────
유동성 스윕 분석은 가격이 눈에 잘 보이는 스윙 고점 또는 스윙 저점을 넘어선 뒤 반전하거나 계속 진행되는 경우가 많다는 개념을 기반으로 합니다.
스윙 고점 스윕은 가격이 이전 고점 위로 올라가 돌파 매수 또는 손절 주문을 유발한 뒤, 그 레벨 위에서 유지되지 못할 때 발생합니다.
스윙 저점 스윕은 가격이 이전 저점 아래로 내려가 이탈 매도 또는 손절 주문을 유발한 뒤, 그 레벨 아래에서 유지되지 못할 때 발생합니다.
이 스크립트는 네 가지 유동성 관련 개념에 초점을 둡니다.
• 스윙 고점과 스윙 저점 스윕 감지
• Wick 회수 또는 종가 회수 행동
• 스윕된 레벨 이후 트랩 확인
• 유동성 존 추적 및 미티게이션 인식
가격이 이전 스윙 고점을 스윕한 뒤 다시 아래로 회수하면, 스크립트는 하락형 유동성 트랩 구간을 식별할 수 있습니다.
가격이 이전 스윙 저점을 스윕한 뒤 다시 위로 회수하면, 스크립트는 상승형 유동성 트랩 구간을 식별할 수 있습니다.
이후 확인 및 스코어링 로직을 사용해 강한 트랩 구조와 약한 스윕 이벤트를 구분합니다.
────────────────────
표시 요소
────────────────────
이 스크립트는 다음 요소를 표시할 수 있습니다.
• 하락형 유동성 스윕 마커
• 상승형 유동성 스윕 마커
• 하락형 트랩 확인 라벨
• 상승형 트랩 확인 라벨
• Sweep wick zone
• 유동성 스윕 기준 레벨
• 미티게이션 또는 만료된 존 행동
• 트랩 점수 퍼센트
• 존 헬스 정보
• 존 재테스트 횟수 정보
이 요소들은 가격이 이전 유동성과 어디에서 상호작용했는지, 스윕 이후 회수 행동이 있었는지, 해당 존이 여전히 구조적으로 의미가 있는지 복기할 수 있도록 돕습니다.
────────────────────
작동 방식
────────────────────
1. 피벗 기반 구조를 사용해 확정된 스윙 고점과 스윙 저점을 식별합니다.
2. 가격이 스윙 고점 위 또는 스윙 저점 아래로 돌파하는지 감시합니다.
3. ATR을 사용해 스윕 침투 깊이를 정규화하여 너무 작은 스윕이나 과도하게 큰 스윕을 줄입니다.
4. Wick 비율 로직을 통해 스윕된 레벨 주변에서 의미 있는 거부 반응이 있었는지 확인합니다.
5. ADX와 DMI 조건을 통해 시장에 충분한 방향성 활동성이 있는지 또는 저에너지 횡보인지 평가합니다.
6. EMA 레짐과 선택 가능한 일목구름 컨텍스트를 통해 더 넓은 추세 환경을 확인합니다.
7. 프리미엄 / 디스카운트 로직은 스윕이 최근 dealing range 안에서 더 의미 있는 위치에서 발생했는지 평가합니다.
8. 거래량과 ATR 활동성 필터는 약하거나 비활성화된 시장 신호를 줄이는 데 사용됩니다.
9. 스윕이 감지되면 스크립트는 스윕 wick과 기준 레벨 주변에 유동성 존을 생성합니다.
10. 선택한 설정에 따라 트랩 확인은 즉시 발생하거나 후속 움직임 이후 발생할 수 있습니다.
11. 스크립트는 회수 품질, wick 행동, 거래량, ADX, DMI 정렬, 레짐 컨텍스트, 프리미엄 / 디스카운트 위치, 캔들 범위를 기반으로 트랩 점수를 부여합니다.
12. 존 헬스와 테스트 횟수 추적은 유동성 존이 반복적으로 테스트되었는지 또는 시간이 지나며 약화되었는지 복기할 수 있도록 돕습니다.
13. 미티게이션 로직은 가격이 해당 레벨을 다시 회수하면 그 레벨이 더 이상 신선한 구조가 아닐 수 있음을 표시할 수 있습니다.
────────────────────
시각 요소
────────────────────
이 스크립트는 다음 시각 요소를 포함합니다.
• SWEEP 마커
• TRAP↑ 라벨
• TRAP↓ 라벨
• 더 강한 상승형 트랩 구조를 나타내는 TRAP↑+ 라벨
• 더 강한 하락형 트랩 구조를 나타내는 TRAP↓+ 라벨
• Liquidity sweep level line
• Sweep wick zone 상단 및 하단 라인
• 반투명 sweep zone fill
• 선택 가능한 약한 트랩 마커
• 트랩 신뢰도 퍼센트
• 존 헬스 값
• 존 테스트 횟수 값
SWEEP은 기본 유동성 스윕 이벤트를 표시합니다.
TRAP↑는 하방 스윕 이후 상승형 트랩 확인을 표시합니다.
TRAP↓는 상방 스윕 이후 하락형 트랩 확인을 표시합니다.
TRAP↑+와 TRAP↓+는 내부 점수 기준을 충족한 더 강한 트랩 구조를 표시합니다.
스윕 존은 스크립트가 유동성 이벤트를 평가할 때 사용한 wick 영역과 기준 레벨을 보여줍니다.
────────────────────
입력값 및 설정
────────────────────
사용자는 다음 항목을 조정할 수 있습니다.
• Swing Length
• Sweep Trigger Mode
• Confirm Only On Closed Bar
• 최소 및 최대 스윕 침투 깊이
• 최소 sweep wick ratio
• Local extreme lookback
• Sweep cooldown
• Same-level blocking distance
• ATR Length
• Volume MA Length
• Follow-through confirmation behavior
• Trap confirmation window
• Strong / valid trap score thresholds
• ADX and DMI filters
• EMA regime filter
• Ichimoku cloud context
• ATR activity filter
• Volume activity filter
• Spike sweep blocking
• Premium / discount range
• Liquidity zone visibility
• Zone holding period
• Zone mitigation tracking
• Zone health capacity
• Strong, valid, weak, sweep marker visibility
• Trap label display
• Marker and zone colors
기본 설정은 좁은 횡보, 비활성 변동성, 반복적으로 미티게이션된 레벨, 극단적인 단일 캔들 스파이크에서 발생하는 저품질 신호를 줄이면서, 눈에 보이는 유동성 스윕 구조에 집중하도록 구성되어 있습니다.
────────────────────
참고 마커
────────────────────
이 스크립트에는 여러 참고 마커와 존이 포함되어 있습니다.
SWEEP:
가격이 이전 스윙 고점 또는 스윙 저점을 스윕하고, 선택한 회수 및 wick 조건을 만족할 때 표시됩니다.
TRAP↑:
하방 유동성 스윕이 상승형 트랩 확인으로 발전할 때 표시됩니다.
TRAP↓:
상방 유동성 스윕이 하락형 트랩 확인으로 발전할 때 표시됩니다.
TRAP↑+:
상승형 트랩 확인이 더 강한 점수 기준을 충족할 때 표시됩니다.
TRAP↓+:
하락형 트랩 확인이 더 강한 점수 기준을 충족할 때 표시됩니다.
Sweep Wick Zone:
스윕 캔들이 만든 wick 영역을 표시합니다.
Liquidity Sweep Level:
스윕되고 회수된 이전 스윙 레벨을 표시합니다.
Zone Health:
설정된 거래량 capacity 대비 해당 존이 얼마나 많은 상호작용을 흡수했는지 단순화해 보여줍니다.
Test Count:
존 형성 이후 해당 구간이 의미 있게 재테스트된 횟수를 표시합니다.
이 마커들은 매매 신호가 아닙니다. 유동성 행동, 거짓 돌파, 스탑헌팅성 움직임, 이전 스윙 레벨 주변의 트랩 확인을 관찰하기 위한 시각적 참고 지점입니다.
────────────────────
사용 방법
────────────────────
이 스크립트는 유동성 스윕과 트랩 존 확인용 보조지표로 사용할 수 있습니다.
일반적인 해석 예시는 다음과 같습니다.
• 이전 스윙 고점 위의 스윕은 상방 유동성이 처리된 위치를 보여줄 수 있습니다.
• 이전 스윙 저점 아래의 스윕은 하방 유동성이 처리된 위치를 보여줄 수 있습니다.
• 하락형 트랩 라벨은 실패한 상방 돌파 행동을 복기하는 데 사용할 수 있습니다.
• 상승형 트랩 라벨은 실패한 하방 이탈 행동을 복기하는 데 사용할 수 있습니다.
• 더 강한 트랩 라벨은 컨텍스트, 거부 반응, 스코어 조건이 더 양호한 스윕을 식별하는 데 도움을 줄 수 있습니다.
• 유동성 존은 스윕된 구간이 여전히 의미 있는지 관찰하는 데 사용할 수 있습니다.
• 존 헬스와 테스트 횟수는 해당 레벨이 신선한지, 반복 테스트되었는지, 또는 약화되었는지 평가하는 데 도움을 줄 수 있습니다.
• 미티게이션 행동은 오래된 레벨을 신선한 유동성 영역으로 계속 해석하지 않도록 돕습니다.
이 스크립트는 가격 행동, 시장 구조, 지지와 저항, 거래량, 변동성, 상위 시간대 추세 컨텍스트와 함께 검토하는 것이 좋습니다.
────────────────────
확인봉 및 리페인트 안내
────────────────────
이 스크립트는 피벗 기반 스윙 고점과 스윙 저점을 사용합니다. 피벗 구조는 스윙 지점의 좌우에 필요한 수의 봉이 형성된 뒤에 확정됩니다.
따라서 스윙 기준 레벨은 피벗 조건이 확정된 후에만 나타납니다.
스윕과 트랩 조건은 차트에서 사용 가능한 데이터를 기준으로 계산됩니다. 봉 마감 확인 옵션이 켜져 있다면, 신호는 봉 마감 이후 평가하는 것을 전제로 합니다.
사용자가 종가 확인을 비활성화하거나 실시간 봉에서 사용할 경우, 봉이 마감되기 전의 움직임에 따라 스윕, 회수, 트랩 조건이 달라질 수 있습니다.
이 스크립트는 향후 가격 움직임을 예측하기 위해 미래 가격 데이터를 사용하지 않습니다. 다만 피벗 기반 스윙 기준은 구조상 확인봉이 필요하기 때문에 자연스럽게 지연되어 확정됩니다.
────────────────────
한계
────────────────────
이 스크립트는 미래 가격 움직임을 예측하지 않습니다.
매수 또는 매도 추천을 제공하지 않습니다.
유동성 스윕은 반전을 보장하지 않습니다.
트랩 라벨은 반대 방향의 지속을 보장하지 않습니다.
강한 트랩 점수는 해당 이벤트가 선택된 구조, 변동성, 레짐, 활동성 조건을 더 많이 만족했다는 의미일 뿐입니다.
강한 추세에서는 가격이 유동성을 스윕한 뒤 같은 방향으로 계속 진행될 수 있습니다.
횡보가 심한 시장, 저유동성 환경, 뉴스성 급등락, 극단적 변동성 구간에서는 스윕 및 트랩 신호의 신뢰도가 낮아질 수 있습니다.
이 스크립트를 단독 매매 시스템으로 사용해서는 안 됩니다.
────────────────────
중요 고지
────────────────────
본 게시물은 교육 및 정보 제공 목적의 차트 분석 자료입니다.
투자 자문, 매수·매도 추천, 특정 금융상품 거래 권유를 의미하지 않습니다.
모든 투자 판단과 그 결과에 대한 책임은 이용자 본인에게 있습니다. 지표

Trend Pullback Retest MapTrend Pullback Retest Map
Trend Pullback Retest Map is a chart study designed to identify trend-based pullback setups, retest confirmations, failed continuation structures, and possible extension zones within an active market trend.
The script evaluates trend direction, pullback depth, structure bias, volatility range, and retest behavior. It then displays SET, RT, FAIL, and EXT markers to help users review whether price is preparing for continuation, confirming a retest, failing the setup, or becoming extended after a strong directional move.
It does not provide buy or sell recommendations. The purpose of this script is to help users study trend continuation structure, pullback quality, retest behavior, invalidation areas, and late-move extension risk.
────────────────────
Core Concept
────────────────────
Trend continuation analysis is often used to study whether price is likely to resume its previous direction after a controlled pullback.
A healthy pullback generally appears when price retraces within an existing trend without fully breaking the underlying structure.
A retest confirmation generally appears when price attempts to recover after the pullback and re-engage the trend direction.
A failed setup appears when price loses the expected continuation structure before confirmation.
An extension zone appears when price has already moved strongly in one direction and may carry higher late-entry risk.
This script focuses on four trend-continuation concepts:
• Trend-based pullback setup detection
• Retest confirmation after a pullback
• Setup invalidation and failure recognition
• Extension and exhaustion awareness after strong movement
When price pulls back into a valid trend structure, the chart may show a SET marker.
When price recovers from that area and confirms continuation behavior, the chart may show an RT marker.
When the expected structure breaks down, the chart may show a FAIL marker.
When price becomes stretched after a strong move, the chart may show an EXT marker.
────────────────────
What This Script Shows
────────────────────
The script can display:
• SET markers for potential pullback setup areas
• RT markers for retest confirmation
• FAIL markers for invalidated continuation setups
• EXT markers for possible extension or exhaustion zones
• Retest trigger reference lines
• Invalidation reference lines
• Completed setup reference lines
• Optional weak pullback markers
These elements are intended to make trend pullback, retest, failure, and extension behavior easier to review on the chart.
────────────────────
How It Works
────────────────────
1. The script evaluates trend direction using fast, trend, and slow EMA structure.
2. ATR is used to normalize pullback depth, trend progress, candle range, and extension distance.
3. A slow regime filter helps reduce signals against the broader trend environment.
4. A structure bias filter checks whether price is positioned on the correct side of the trend structure.
5. Recent impulse logic helps avoid weak sideways conditions with insufficient directional movement.
6. The script checks whether price has pulled back into a controlled area near the trend structure.
7. A pullback setup can be marked as SET when trend, depth, structure, volume, and candle quality conditions are met.
8. After SET, the script monitors whether price breaks the retest trigger or confirms momentum recovery.
9. If retest confirmation appears, the script marks RT.
10. If price breaks the invalidation area or loses the required trend structure, the script marks FAIL.
11. If price moves too far from the trend structure or shows exhaustion behavior, the script marks EXT.
12. Optional realtime behavior can be controlled so users can review signals with confirmed-bar logic.
────────────────────
Visual Elements
────────────────────
The script includes:
• SET marker
• RT marker
• FAIL marker
• EXT marker
• Optional WK marker
• Retest Trigger Line
• Invalidation Line
• Completed setup line state
• Color-coded event markers
SET is used as a preparation marker.
RT is used as a stronger continuation confirmation marker.
FAIL is used as a structure failure marker.
EXT is used as an extension or late-move caution marker.
The retest trigger line and invalidation line help users review the reference range that the script used while evaluating the setup.
────────────────────
Inputs And Customization
────────────────────
Users can adjust:
• Trend EMA length
• Fast EMA length
• Slow regime EMA length
• ATR length
• Pullback lookback bars
• Minimum trend slope
• Minimum fast / trend EMA gap
• Minimum trend progress
• Minimum trend age
• Structure lookback
• Slow regime filter
• Directional impulse requirements
• Pullback depth range
• Trend hold buffer
• Fast EMA touch buffer
• SET quality score
• Volume quality filter
• Setup range filter
• Chop range filter
• Retest confirmation window
• Direct RT behavior
• EXT reset requirements
• Structure break requirements for RT
• Failure and invalidation settings
• Extension and exhaustion thresholds
• Signal visibility
• Line visibility
• Marker colors and text colors
The default settings are designed to reduce weak sideways signals and focus more on trend continuation structures where price pulls back, recovers, or fails around a defined reference area.
────────────────────
Reference Markers
────────────────────
The script includes several event markers.
SET:
Shows when price forms a potential pullback setup within a valid trend structure.
RT:
Shows when price confirms a retest or momentum recovery after a setup.
FAIL:
Shows when the setup loses its expected continuation structure or breaks the invalidation area.
EXT:
Shows when price appears extended after a strong directional movement and may require caution.
WK:
Optional weak pullback marker that can be enabled to observe deeper or weaker pullback behavior.
Retest Trigger Line:
Shows the reference area that price needs to recover or break through for continuation confirmation.
Invalidation Line:
Shows the reference area where the setup structure is considered weakened or failed.
These markers are not trading signals. They are visual reference points for studying pullback quality, retest confirmation, failed continuation, and extension risk.
────────────────────
How To Use
────────────────────
Use this script as a trend pullback and retest structure viewer.
General interpretation examples:
• SET can be used to review where a pullback setup begins to form.
• RT can be used to review where price confirms recovery after a pullback.
• FAIL can be used to review where the expected continuation structure breaks.
• EXT can be used to review where price may be stretched after a strong move.
• Retest trigger lines can help users understand the confirmation area.
• Invalidation lines can help users understand where the setup loses quality.
• The script should be reviewed together with price action, support and resistance, volume, volatility, and higher-timeframe trend context.
This script should be used with independent analysis, risk management, and a defined trading plan.
────────────────────
Confirmation And Repainting Notes
────────────────────
The script calculates conditions using the available chart data.
Trend context, pullback depth, retest confirmation, failure conditions, and extension conditions can change while the current candle is still forming.
If users want more conservative signal interpretation, events should be evaluated after candle close.
The script does not use future price data to predict upcoming price movement.
Some signals may appear after a structure is already partially formed because confirmation conditions require price behavior to develop first.
────────────────────
Limitations
────────────────────
This script does not predict future price movement.
It does not provide buy or sell recommendations.
SET and RT markers are not guaranteed continuation signals.
FAIL markers may appear after part of the move has already occurred because failure confirmation requires price to break or weaken the expected structure.
EXT markers do not guarantee reversal. They only indicate that price may be extended relative to the selected trend and volatility conditions.
In choppy, low-liquidity, news-driven, or highly volatile markets, the script may produce weaker or delayed signals.
The script should not be used as a standalone trading system.
────────────────────
Disclaimer
────────────────────
This publication is for educational and informational chart analysis only.
It does not constitute financial advice, investment advice, or a recommendation to buy or sell any financial instrument.
All trading and investment decisions are the responsibility of the user.
━━━━━━━━━━━━━━━━━━━━
Trend Pullback Retest Map
Trend Pullback Retest Map은 활성화된 시장 추세 안에서 추세 기반 눌림목 셋업, 리테스트 확인, 추세 지속 실패 구조, 과열 확장 구간을 식별하기 위한 차트 분석 보조지표입니다.
이 스크립트는 추세 방향, 눌림 깊이, 구조 편향, 변동성 범위, 리테스트 행동을 평가합니다. 이후 SET, RT, FAIL, EXT 마커를 표시해 가격이 추세 지속을 준비하는지, 리테스트를 확인하는지, 셋업이 실패하는지, 또는 강한 방향성 이동 이후 과도하게 확장되었는지 복기할 수 있도록 돕습니다.
이 지표는 매수 또는 매도 추천을 제공하지 않습니다.
목적은 추세 지속 구조, 눌림목 품질, 리테스트 행동, 무효화 영역, 늦은 진입 위험이 있는 확장 구간을 관찰하는 것입니다.
────────────────────
핵심 개념
────────────────────
추세 지속 분석은 가격이 일정한 눌림 이후 기존 방향으로 다시 이어질 수 있는지를 관찰하는 데 자주 사용됩니다.
건강한 눌림은 일반적으로 기존 추세 구조를 완전히 깨지 않으면서 가격이 일정 부분 되돌림을 보일 때 나타납니다.
리테스트 확인은 눌림 이후 가격이 다시 회복하면서 기존 추세 방향으로 재진입하려는 행동을 보일 때 나타납니다.
실패한 셋업은 확인이 나오기 전에 가격이 기대했던 추세 지속 구조를 잃을 때 나타납니다.
확장 구간은 가격이 이미 한 방향으로 강하게 움직인 뒤 늦은 진입 위험이 커질 수 있는 구간을 의미합니다.
이 스크립트는 네 가지 추세 지속 개념에 초점을 둡니다.
• 추세 기반 눌림목 셋업 감지
• 눌림 이후 리테스트 확인
• 셋업 무효화 및 실패 인식
• 강한 움직임 이후 확장 및 과열 인식
가격이 유효한 추세 구조 안으로 눌리면 차트에 SET 마커가 표시될 수 있습니다.
가격이 해당 구간에서 회복하고 추세 지속 행동을 확인하면 RT 마커가 표시될 수 있습니다.
기대했던 구조가 무너지면 FAIL 마커가 표시될 수 있습니다.
가격이 강한 움직임 이후 과도하게 확장되면 EXT 마커가 표시될 수 있습니다.
────────────────────
표시 요소
────────────────────
이 스크립트는 다음 요소를 표시할 수 있습니다.
• 잠재적 눌림목 셋업 구간을 나타내는 SET 마커
• 리테스트 확인을 나타내는 RT 마커
• 무효화된 추세 지속 셋업을 나타내는 FAIL 마커
• 과열 또는 확장 가능성을 나타내는 EXT 마커
• 리테스트 트리거 기준선
• 무효화 기준선
• 완료된 셋업 기준선
• 선택 가능한 약한 눌림 마커
이 요소들은 차트 위에서 추세 눌림, 리테스트, 실패, 확장 행동을 더 쉽게 복기하기 위한 시각적 참고 자료입니다.
────────────────────
작동 방식
────────────────────
1. 빠른 EMA, 추세 EMA, 장기 EMA 구조를 사용해 추세 방향을 평가합니다.
2. ATR을 사용해 눌림 깊이, 추세 진행도, 캔들 범위, 확장 거리를 정규화합니다.
3. 장기 레짐 필터를 통해 더 넓은 추세 환경과 반대되는 신호를 줄입니다.
4. 구조 편향 필터를 통해 가격이 추세 구조의 적절한 방향에 위치해 있는지 확인합니다.
5. 최근 임펄스 로직을 통해 방향성이 부족한 약한 횡보 구간을 줄입니다.
6. 가격이 추세 구조 근처의 통제된 영역으로 눌렸는지 확인합니다.
7. 추세, 눌림 깊이, 구조, 거래량, 캔들 품질 조건이 충족되면 SET으로 표시될 수 있습니다.
8. SET 이후 가격이 리테스트 트리거를 돌파하거나 모멘텀 회복을 확인하는지 관찰합니다.
9. 리테스트 확인이 나타나면 RT를 표시합니다.
10. 가격이 무효화 영역을 깨거나 필요한 추세 구조를 잃으면 FAIL을 표시합니다.
11. 가격이 추세 구조에서 지나치게 멀어지거나 과열 행동을 보이면 EXT를 표시합니다.
12. 선택 가능한 실시간 동작 설정을 통해 확정봉 기준으로 신호를 검토할 수 있습니다.
────────────────────
시각 요소
────────────────────
이 스크립트는 다음 시각 요소를 포함합니다.
• SET 마커
• RT 마커
• FAIL 마커
• EXT 마커
• 선택 가능한 WK 마커
• Retest Trigger Line
• Invalidation Line
• 완료된 셋업 라인 상태
• 색상으로 구분된 이벤트 마커
SET은 준비 구간 마커로 사용됩니다.
RT는 더 강한 추세 지속 확인 마커로 사용됩니다.
FAIL은 구조 실패 마커로 사용됩니다.
EXT는 확장 또는 늦은 진입 주의 마커로 사용됩니다.
리테스트 트리거 라인과 무효화 라인은 스크립트가 셋업을 평가할 때 사용한 기준 범위를 복기하는 데 도움을 줍니다.
────────────────────
입력값 및 설정
────────────────────
사용자는 다음 항목을 조정할 수 있습니다.
• Trend EMA Length
• Fast EMA Length
• Slow Regime EMA Length
• ATR Length
• Pullback Lookback Bars
• 최소 추세 기울기
• 최소 Fast / Trend EMA 간격
• 최소 추세 진행도
• 최소 추세 유지 시간
• 구조 기준 lookback
• 장기 레짐 필터
• 방향성 임펄스 조건
• 눌림 깊이 범위
• 추세 유지 버퍼
• Fast EMA 터치 버퍼
• SET 품질 점수
• 거래량 품질 필터
• 셋업 범위 필터
• 횡보 범위 필터
• 리테스트 확인 구간
• Direct RT 동작
• EXT 이후 reset 조건
• RT 구조 돌파 조건
• 실패 및 무효화 설정
• 확장 및 과열 기준
• 신호 표시 여부
• 라인 표시 여부
• 마커 색상 및 텍스트 색상
기본 설정은 약한 횡보 신호를 줄이고, 가격이 눌림 이후 회복하거나 실패하는 추세 지속 구조에 더 집중하도록 구성되어 있습니다.
────────────────────
참고 마커
────────────────────
이 스크립트에는 여러 이벤트 마커가 포함되어 있습니다.
SET:
가격이 유효한 추세 구조 안에서 잠재적 눌림목 셋업을 형성할 때 표시됩니다.
RT:
가격이 셋업 이후 리테스트 또는 모멘텀 회복을 확인할 때 표시됩니다.
FAIL:
셋업이 기대했던 추세 지속 구조를 잃거나 무효화 영역을 이탈할 때 표시됩니다.
EXT:
가격이 강한 방향성 이동 이후 확장되어 주의가 필요할 수 있을 때 표시됩니다.
WK:
더 깊거나 약한 눌림 행동을 관찰하기 위해 선택적으로 활성화할 수 있는 약한 눌림 마커입니다.
Retest Trigger Line:
가격이 추세 지속 확인을 위해 회복하거나 돌파해야 하는 기준 영역을 표시합니다.
Invalidation Line:
셋업 구조가 약화되거나 실패했다고 볼 수 있는 기준 영역을 표시합니다.
이 마커들은 매매 신호가 아닙니다.
눌림 품질, 리테스트 확인, 추세 지속 실패, 확장 위험을 관찰하기 위한 시각적 참고 지점입니다.
────────────────────
사용 방법
────────────────────
이 스크립트는 추세 눌림과 리테스트 구조 확인용 보조지표로 사용할 수 있습니다.
일반적인 해석 예시는 다음과 같습니다.
• SET은 눌림목 셋업이 형성되기 시작한 위치를 복기하는 데 사용할 수 있습니다.
• RT는 눌림 이후 가격이 회복을 확인한 위치를 복기하는 데 사용할 수 있습니다.
• FAIL은 기대했던 추세 지속 구조가 무너진 위치를 복기하는 데 사용할 수 있습니다.
• EXT는 강한 움직임 이후 가격이 과도하게 확장되었을 수 있는 구간을 복기하는 데 사용할 수 있습니다.
• 리테스트 트리거 라인은 확인 기준 영역을 이해하는 데 도움을 줄 수 있습니다.
• 무효화 라인은 셋업 품질이 사라지는 구간을 이해하는 데 도움을 줄 수 있습니다.
• 이 스크립트는 가격 행동, 지지와 저항, 거래량, 변동성, 상위 시간대 추세 컨텍스트와 함께 검토해야 합니다.
이 스크립트는 독립적인 분석, 리스크 관리, 본인의 매매 계획과 함께 참고해야 합니다.
────────────────────
확인봉 및 리페인트 안내
────────────────────
이 스크립트는 차트에서 사용 가능한 데이터를 기준으로 조건을 계산합니다.
현재 캔들이 형성되는 동안에는 추세 컨텍스트, 눌림 깊이, 리테스트 확인, 실패 조건, 확장 조건이 달라질 수 있습니다.
보다 보수적인 신호 해석을 원하는 사용자는 봉 마감 이후 이벤트를 확인해야 합니다.
이 스크립트는 향후 가격 움직임을 예측하기 위해 미래 가격 데이터를 사용하지 않습니다.
일부 신호는 확인 조건이 가격 행동의 진행을 필요로 하기 때문에 구조가 일부 형성된 뒤 표시될 수 있습니다.
────────────────────
한계
────────────────────
이 스크립트는 미래 가격 움직임을 예측하지 않습니다.
매수 또는 매도 추천을 제공하지 않습니다.
SET과 RT 마커는 추세 지속을 보장하지 않습니다.
FAIL 마커는 실패 확인을 위해 가격이 구조를 깨거나 약화되는 과정이 필요하므로 움직임이 일부 진행된 뒤 표시될 수 있습니다.
EXT 마커는 반전을 보장하지 않습니다. 선택한 추세 및 변동성 조건 대비 가격이 확장되었을 가능성을 나타낼 뿐입니다.
횡보가 심한 시장, 저유동성 시장, 뉴스성 급등락, 급변동 구간에서는 신호가 약해지거나 늦게 표시될 수 있습니다.
이 스크립트를 단독 매매 시스템으로 사용해서는 안 됩니다.
────────────────────
중요 고지
────────────────────
본 게시물은 교육 및 정보 제공 목적의 차트 분석 자료입니다.
투자 자문, 매수·매도 추천, 특정 금융상품 거래 권유를 의미하지 않습니다.
모든 투자 판단과 그 결과에 대한 책임은 이용자 본인에게 있습니다. 지표

지표

Supply Demand Volume ZonesSupply Demand Volume Zones
Supply Demand Volume Zones is a chart study designed to identify potential supply and demand areas using pivot-based price structure, zone width normalization, volume context, reaction strength, and proximity-based ranking.
The script builds supply zones near confirmed pivot highs and demand zones near confirmed pivot lows. Each zone can be scored using the average volume inside the base area and the size of the reaction that followed the pivot.
It does not provide buy or sell recommendations. The purpose of this script is to help users study possible support and resistance areas created by prior price reactions and volume activity.
────────────────────
Core Concept
────────────────────
Supply and demand analysis is often used to study where price previously reacted from a defined area.
A supply zone generally represents a prior area where selling pressure or resistance appeared.
A demand zone generally represents a prior area where buying pressure or support appeared.
This script focuses on four main zone concepts:
• Pivot-based reaction areas
• Base-zone range construction
• Volume and reaction-strength scoring
• Distance-based zone ranking
When price approaches a prior supply zone, users may observe whether resistance or rejection appears.
When price approaches a prior demand zone, users may observe whether support or reaction appears.
When a zone is broken completely, the script can remove it to keep the chart focused on active areas.
────────────────────
What This Script Shows
────────────────────
The script can display:
• Supply zones
• Demand zones
• Zone labels
• Strength labels
• Score labels
• Distance-adjusted zone ranking
• Optional session background
• Active zone touch alerts
• Active zone break alerts
These elements are intended to make supply and demand areas easier to review on the chart.
────────────────────
How It Works
────────────────────
1. The script detects pivot highs and pivot lows using configurable left and right pivot bars.
2. When a pivot high is confirmed, it builds a potential supply zone from the selected base area.
3. When a pivot low is confirmed, it builds a potential demand zone from the selected base area.
4. The zone range can be built from wick range, body range, or a hybrid method.
5. The script normalizes zone height using ATR-based minimum and maximum height limits.
6. It calculates average volume across the base zone.
7. It compares base volume against a volume moving average to estimate volume expansion.
8. It measures the reaction move after the pivot in ATR units.
9. It combines volume context and reaction strength into a zone score.
10. It can filter zones with weak volume if the volume filter is enabled.
11. It prevents same-side duplicate zones using an ATR-based merge tolerance.
12. It can hide conflicting supply and demand overlap areas.
13. It ranks active zones by score and proximity to current price.
14. It fades distant zones and can delete zones after a complete break.
15. It updates active boxes and labels as the chart progresses.
────────────────────
Visual Elements
────────────────────
The script includes:
• Orange supply / resistance zones
• Blue demand / support zones
• Zone strength labels
• Optional score display
• Optional session background
• Transparent box styling for older or distant zones
Zone labels can show a simple meaning label, a score label, or both.
Examples:
• SUP 1 STRONG
• SUP 2 MID
• DEM 1 STRONG
• DEM 2 BASE
The rank number reflects the relative priority of the active zone after considering strength and distance from current price.
────────────────────
Inputs And Customization
────────────────────
Users can adjust:
• Pivot left bars
• Pivot right bars
• Base zone bars
• ATR length
• Supply-only, demand-only, or both-side display
• Zone height calculation mode
• Minimum and maximum ATR-based zone height
• Right-side box extension
• Volume filter
• Volume moving average length
• Minimum volume multiplier
• Volume score weight
• Reaction score weight
• Strong and mid score thresholds
• Maximum number of supply zones
• Maximum number of demand zones
• Label display mode
• Broken-zone deletion
• Same-side merge tolerance
• Opposite-side conflict filter
• Far-zone fading
• Zone colors and transparency
• Optional session background
The default settings are designed to keep the chart readable while preserving the nearest and higher-ranked supply / demand zones.
────────────────────
Reference Markers
────────────────────
The script includes optional zone labels and alert conditions.
Supply Zone:
Shows a potential resistance area built from a confirmed pivot high and its surrounding base range.
Demand Zone:
Shows a potential support area built from a confirmed pivot low and its surrounding base range.
Strength Label:
Shows whether the zone is classified as BASE, MID, or STRONG according to the calculated score.
Score Label:
Shows the raw strength score based on the selected volume and reaction-weighting settings.
Zone Touch Alert:
Triggers when price enters or touches an active supply or demand zone.
Zone Break Alert:
Triggers when price completely breaks through an active supply or demand zone.
These markers and alerts are not trading signals. They are visual reference points for studying support, resistance, reaction zones, and price-location context.
────────────────────
How To Use
────────────────────
Use this script as a supply and demand zone viewer.
General interpretation examples:
• A supply zone above current price may act as a resistance reference area.
• A demand zone below current price may act as a support reference area.
• A zone with a higher score means the base area had stronger internal volume and/or a larger reaction move.
• A nearby high-ranked zone may be more relevant for short-term chart review than a distant lower-ranked zone.
• A complete break through a zone may reduce the usefulness of that zone as an active reference area.
• Overlapping or conflicting zones can be filtered to keep the chart cleaner.
This script should be used with independent analysis, risk management, and a defined trading plan.
────────────────────
Confirmation And Repainting Notes
────────────────────
Supply and demand zones are based on pivot logic.
A pivot requires the selected number of right-side bars to confirm, so a new zone appears only after the pivot has been confirmed.
The script does not use future price data beyond the required pivot confirmation window.
Because active candles can change before close, users who want confirmed conditions should evaluate zone touches and zone breaks after bar close.
Zone boxes are extended forward and updated as new bars appear. If broken-zone deletion is enabled, zones can disappear after price completely breaks through them.
────────────────────
Limitations
────────────────────
This script does not predict future price movement.
It does not provide buy or sell recommendations.
Supply and demand zones are approximate visual reference areas, not exact price guarantees.
Pivot-based zones can appear after the initial reaction has already started because pivot confirmation requires additional bars.
In sideways or low-liquidity markets, many zones may form close to each other and may require additional filtering.
A high score does not guarantee that price will react from a zone.
The script should not be used as a standalone trading system.
────────────────────
Disclaimer
────────────────────
This publication is for educational and informational chart analysis only.
It does not constitute financial advice, investment advice, or a recommendation to buy or sell any financial instrument.
All trading and investment decisions are the responsibility of the user.
━━━━━━━━━━━━━━━━━━━━
Supply Demand Volume Zones
Supply Demand Volume Zones는 피벗 기반 가격 구조, 구간 폭 정규화, 거래량 컨텍스트, 반응 강도, 가격 근접도 기반 랭킹을 사용해 잠재적인 Supply / Demand 구간을 표시하는 차트 분석 보조지표입니다.
이 스크립트는 확정된 피벗 고점 부근에는 Supply 구간을, 확정된 피벗 저점 부근에는 Demand 구간을 생성합니다. 각 구간은 base 영역의 평균 거래량과 피벗 이후 발생한 반응 크기를 바탕으로 점수화할 수 있습니다.
이 지표는 매수 또는 매도 추천을 제공하지 않습니다.
목적은 과거 가격 반응과 거래량 활동으로 형성된 잠재적 지지 / 저항 영역을 관찰하는 것입니다.
────────────────────
핵심 개념
────────────────────
Supply / Demand 분석은 가격이 과거에 특정 구간에서 어떻게 반응했는지 관찰하는 데 자주 사용됩니다.
Supply 구간은 일반적으로 과거에 매도 압력 또는 저항이 나타난 영역을 의미합니다.
Demand 구간은 일반적으로 과거에 매수 압력 또는 지지가 나타난 영역을 의미합니다.
이 스크립트는 네 가지 구간 개념에 초점을 둡니다.
• 피벗 기반 반응 구간
• Base zone 범위 구성
• 거래량 및 반응 강도 점수
• 가격 거리 기반 구간 랭킹
가격이 이전 Supply 구간에 접근할 때 사용자는 저항이나 반락 반응이 나타나는지 관찰할 수 있습니다.
가격이 이전 Demand 구간에 접근할 때 사용자는 지지나 반등 반응이 나타나는지 관찰할 수 있습니다.
구간이 완전히 돌파되면, 설정에 따라 해당 구간을 삭제하여 차트에 활성 구간만 남길 수 있습니다.
────────────────────
표시 요소
────────────────────
이 스크립트는 다음 요소를 표시할 수 있습니다.
• Supply 구간
• Demand 구간
• 구간 라벨
• 강도 라벨
• 점수 라벨
• 거리 반영 구간 랭킹
• 선택 가능한 세션 배경
• 활성 구간 터치 알림
• 활성 구간 돌파 알림
이 요소들은 차트 위에서 Supply / Demand 영역을 더 쉽게 복기하기 위한 시각적 참고 자료입니다.
────────────────────
작동 방식
────────────────────
1. 설정 가능한 left / right pivot bars를 사용해 피벗 고점과 피벗 저점을 감지합니다.
2. 피벗 고점이 확정되면 선택한 base 영역을 기준으로 잠재 Supply 구간을 생성합니다.
3. 피벗 저점이 확정되면 선택한 base 영역을 기준으로 잠재 Demand 구간을 생성합니다.
4. 구간 범위는 wick range, body range, hybrid 방식 중 하나로 구성할 수 있습니다.
5. ATR 기반 최소 / 최대 구간 높이를 적용해 zone height를 정규화합니다.
6. Base zone 안의 평균 거래량을 계산합니다.
7. Base volume을 거래량 이동평균과 비교해 거래량 확장 정도를 추정합니다.
8. 피벗 이후 발생한 반응 움직임을 ATR 단위로 측정합니다.
9. 거래량 컨텍스트와 반응 강도를 조합해 구간 점수를 계산합니다.
10. Volume Filter를 활성화하면 약한 거래량 구간을 필터링할 수 있습니다.
11. ATR 기반 merge tolerance를 사용해 같은 방향의 중복 구간을 줄입니다.
12. Supply와 Demand가 충돌하는 중첩 구간을 숨길 수 있습니다.
13. 활성 구간을 점수와 현재 가격과의 거리 기준으로 랭킹화합니다.
14. 먼 구간은 더 흐리게 표시하고, 완전히 돌파된 구간은 삭제할 수 있습니다.
15. 차트가 진행됨에 따라 활성 박스와 라벨을 계속 업데이트합니다.
────────────────────
시각 요소
────────────────────
이 스크립트는 다음 시각 요소를 포함합니다.
• 주황색 Supply / Resistance 구간
• 파란색 Demand / Support 구간
• 구간 강도 라벨
• 선택 가능한 점수 표시
• 선택 가능한 세션 배경
• 오래되었거나 먼 구간을 위한 투명 박스 스타일
구간 라벨은 단순 의미, 점수, 또는 둘 다 표시할 수 있습니다.
예시:
• SUP 1 STRONG
• SUP 2 MID
• DEM 1 STRONG
• DEM 2 BASE
랭킹 숫자는 현재 가격과의 거리 및 구간 강도를 반영한 활성 구간의 상대적 우선순위를 의미합니다.
────────────────────
입력값 및 설정
────────────────────
사용자는 다음 항목을 조정할 수 있습니다.
• Pivot Left Bars
• Pivot Right Bars
• Base Zone Bars
• ATR Length
• Supply only, Demand only, 양방향 표시
• Zone Height 계산 방식
• ATR 기반 최소 / 최대 구간 높이
• 우측 박스 연장 길이
• Volume Filter
• Volume MA Length
• Minimum Volume Multiplier
• Volume Score Weight
• Reaction Score Weight
• Strong / Mid Score 기준
• 최대 Supply 구간 수
• 최대 Demand 구간 수
• 라벨 표시 방식
• 돌파된 구간 삭제
• 같은 방향 구간 병합 허용 범위
• 반대 방향 중첩 구간 필터
• 먼 구간 흐림 처리
• 구간 색상 및 투명도
• 선택 가능한 세션 배경
기본 설정은 차트 가독성을 유지하면서 현재 가격과 가까운 주요 Supply / Demand 구간을 남기도록 구성되어 있습니다.
────────────────────
참고 마커
────────────────────
이 스크립트에는 선택 가능한 구간 라벨과 알림 조건이 포함되어 있습니다.
Supply Zone:
확정된 피벗 고점과 주변 base range를 기준으로 만들어진 잠재 저항 구간을 표시합니다.
Demand Zone:
확정된 피벗 저점과 주변 base range를 기준으로 만들어진 잠재 지지 구간을 표시합니다.
Strength Label:
계산된 점수에 따라 BASE, MID, STRONG 중 하나로 구간 강도를 표시합니다.
Score Label:
선택한 거래량 및 반응 강도 가중치 설정을 기준으로 계산된 원시 강도 점수를 표시합니다.
Zone Touch Alert:
가격이 활성 Supply 또는 Demand 구간에 진입하거나 터치할 때 발생합니다.
Zone Break Alert:
가격이 활성 Supply 또는 Demand 구간을 완전히 돌파할 때 발생합니다.
이 마커와 알림은 매매 신호가 아닙니다.
지지, 저항, 반응 구간, 가격 위치 컨텍스트를 관찰하기 위한 시각적 참고 지점입니다.
────────────────────
사용 방법
────────────────────
이 스크립트는 Supply / Demand 구간 확인용 보조지표로 사용할 수 있습니다.
일반적인 해석 예시는 다음과 같습니다.
• 현재 가격 위의 Supply 구간은 저항 참고 영역으로 볼 수 있습니다.
• 현재 가격 아래의 Demand 구간은 지지 참고 영역으로 볼 수 있습니다.
• 점수가 높은 구간은 base 영역의 거래량이 상대적으로 강했거나 이후 반응 움직임이 컸다는 의미입니다.
• 현재 가격과 가까운 높은 순위의 구간은 멀리 있는 낮은 순위 구간보다 단기 차트 복기에 더 유용할 수 있습니다.
• 구간이 완전히 돌파되면 해당 구간의 활성 참고 가치가 낮아졌다고 볼 수 있습니다.
• 중복되거나 충돌하는 구간은 필터링하여 차트를 더 깔끔하게 유지할 수 있습니다.
이 스크립트는 독립적인 분석, 리스크 관리, 본인의 매매 계획과 함께 참고해야 합니다.
────────────────────
확인봉 및 리페인트 안내
────────────────────
Supply / Demand 구간은 피벗 기반 로직으로 계산됩니다.
피벗은 선택한 우측 확인 캔들이 필요하므로, 새로운 구간은 피벗이 확정된 뒤에 표시됩니다.
이 스크립트는 필요한 피벗 확인 구간 외에 미래 가격 데이터를 사용하지 않습니다.
현재 진행 중인 캔들은 마감 전까지 값이 변할 수 있으므로, 확정 조건을 원하는 사용자는 구간 터치와 구간 돌파를 봉 마감 이후 기준으로 확인해야 합니다.
구간 박스는 우측으로 연장되며 새 캔들이 형성될 때마다 업데이트됩니다. Broken-zone deletion이 활성화되어 있으면 가격이 구간을 완전히 돌파한 뒤 해당 구간이 사라질 수 있습니다.
────────────────────
한계
────────────────────
이 스크립트는 미래 가격 움직임을 예측하지 않습니다.
매수 또는 매도 추천을 제공하지 않습니다.
Supply / Demand 구간은 정확한 가격 보장이 아니라 대략적인 시각 참고 영역입니다.
피벗 기반 구간은 우측 확인 캔들이 필요하므로, 초기 반응이 이미 발생한 뒤 구간이 표시될 수 있습니다.
횡보장 또는 저유동성 시장에서는 많은 구간이 가까운 위치에 형성될 수 있으며 추가 필터링이 필요할 수 있습니다.
높은 점수는 해당 구간에서 반드시 가격이 반응한다는 의미가 아닙니다.
이 스크립트를 단독 매매 시스템으로 사용해서는 안 됩니다.
────────────────────
중요 고지
────────────────────
본 게시물은 교육 및 정보 제공 목적의 차트 분석 자료입니다.
투자 자문, 매수·매도 추천, 특정 금융상품 거래 권유를 의미하지 않습니다.
모든 투자 판단과 그 결과에 대한 책임은 이용자 본인에게 있습니다. 지표