Swing High Low - Definition and SequenceSwing High Low - Definition and Sequence marks confirmed swing highs and lows and studies how their interpretation changes with confirmation time and price definition.
Its central question is practical: does a swing identified from a wick also exist at the same candle when using body edges or closes, and how does price behave after that first confirmation?
The script connects three observations: the same origin across progressively longer confirmation windows, its dependence on wick/body/close definitions, and the subsequent sequence of outside excursions, consecutive outside closes and inside returns. Comparison groups are fixed using information available at Stage I, rather than defined by which origins later survive Stage III.
The chart stays compact. Detailed measurements are available through table tooltips and the Data Window. This is an open-source research indicator, not an automatic entry system, a best-parameter selector or a strategy backtest.
Quick start
Use standard candles and begin with the default Confirmation bars placement. Magenta downward triangles mark high confirmations; mint upward triangles mark low confirmations. A triangle identifies the candle that confirmed an earlier extreme, not necessarily the extreme candle itself.
For the detailed research, open settings group 07, Definition and ordered-path study. Set Inspect record (0 = latest origin, 1 = latest completed) to 1. Then hover over the numeric cells on the relevant HIGH or LOW side:
Origin price: the selected origin's wick/body/close definition tests.
Origin age: its ordered post-confirmation path.
Depth / ATR: signed isolation margins and first-confirmation group statistics.
N / open: sample admission, completion, pending observations and exclusions.
An inspection offset of 0 follows the latest accepted origin, which may still be unfinished. Offsets 1, 2 and higher select successively older completed admitted records. Each inspected record identifies its own time and price. Inspection changes only these tooltip sections: the printed latest-origin values and chart markers retain their usual meanings. An unavailable offset displays no record rather than substituting another one.
Three confirmation stages
The defaults use six left-context bars and right-side windows of 3, 8 and 21 bars. Stage II is entered as five additional bars after Stage I; Stage III adds another thirteen bars. The left context remains fixed. These are not three independent symmetric pivot detectors.
Stage I accepts an origin only when its initial right window has closed and the configured conditions are satisfied. Stages II and III test that same origin after their longer right windows have elapsed. Later stages do not replace it with a nearby, more convenient extreme. Failure to reach a later stage does not retrospectively remove the Stage-I event from the observation population.
Highs and lows are processed separately. Alternating highs and lows are not forced, and no order is inferred when both sides qualify from the same candle.
Price definition selects Wicks, Bodies or Close. Wicks uses high/low; Bodies uses max(open, close) for highs and min(open, close) for lows; Close uses closing prices for both sides.
Equal-extreme selection controls ties within the specified windows. Rightmost allows equal older extremes but no equal newer extreme. Leftmost allows equal newer extremes but no equal older extreme. Strict allows no equality on either side. These rules do not merge equal prices across unlimited history.
The optional two-sided shoulder-depth filter excludes the origin candle, measures the selected-source retreat on each side, and takes the smaller retreat divided by origin ATR. Its default minimum is 0.20 ATR; zero disables this filter. Minimum same-side spacing defaults to three bars between accepted origins. ATR length defaults to 14, and research normalization uses ATR frozen at the origin rather than a later volatility value.
HH, LH and EH compare each accepted high with the preceding accepted high. HL, LL and EL do the corresponding comparison for lows. EH and EL use the configurable equality tolerance, initially one tick. This tolerance affects the classification labels, not the pivot tie rule. With no preceding accepted same-side origin, the initial classification is H or L.
Chart symbols and timing
Triangles represent Stage I, circles Stage II, and diamonds Stage III. The default presentation limits primary markers to 30 per side, later-stage symbols to six per side within the most recent 100 visible closed bars, and primary text captions to one per side. Colors, sizes, transparency, pins, captions and limits are configurable.
Hovering over a symbol provides its origin price and time, confirmation time, stage, delay, depth and normalized drift. Use the origin timestamp to associate different confirmation symbols with the same swing.
Confirmation bars is the default placement. Origin bars (backdated) places only Stage I on its earlier origin after confirmation, with a dotted trace to the confirmation candle. This is delayed historical annotation: the marker was not available on the origin candle. Later-stage symbols, event outputs and alerts are not shifted backward.
Adaptive density selects chart symbols using visible-bar spacing, not subsequent success or failure. Zooming, panning or adding bars can change which symbols are displayed and their vertical clearance. Fixed spacing and All within limits are alternatives; count, age and finite-cache limits still apply. Each of the two presentation caches holds up to 2,400 events for the selected viewport.
These display controls do not change detection, research samples or alerts. Consequently, a label can compare against an accepted origin that is not currently visible. Chart marks are not an exhaustive event ledger, and presentation recalculation should not be confused with a claim that every historical drawing remains permanently visible.
Same-origin definition tests
For every accepted origin, the definition study asks whether that exact candle is also an extreme under wick, body-edge and closing-price representations. Each representation uses its own price on the same origin candle; the study does not search for replacement pivots.
Each of the three scheduled stages tests all three price definitions against Rightmost, Leftmost and Strict: up to 27 geometry checks. These are related conditions, not 27 independent models. Strict implies both other tie rules; without relevant ties, those rules can give identical answers.
The Origin price tooltip displays W for wick, B for body edge and C for close. Within each bracket, R/L/S indicates the tie rules that pass; a dash indicates failure and a question mark indicates unavailable data. A pending stage has not reached its scheduled confirmation close.
For example, W B C describes an origin that is strictly isolated as a wick extreme, but not as a body-edge or closing-price extreme. The accompanying 0-3 count is the number of source definitions passing the currently selected tie rule, not a confidence score or reversal probability.
Later definition rows are evaluated even when the main selected-source origin fails Stage II or III. They do not promote the main detector's marker. Alternative depth filters and accepted-origin spacing are not rerun, so this is a fixed-candle geometry comparison, not three complete alternative detector histories.
Signed isolation margins
The Depth / ATR tooltip includes a separate margin for each price definition and stage:
High margin = (origin source price - highest competing source price) / origin ATR.
Low margin = (lowest competing source price - origin source price) / origin ATR.
Competitors are the fixed left context and the relevant right window, excluding the origin candle. Positive means strictly isolated, zero means tied, and negative means exceeded by another candle. Missing or nonpositive origin ATR leaves the margin unavailable.
These margins measure separation from the strongest competing extreme. They differ from the shoulder-depth filter, which measures retreat on both sides. The visible Depth / ATR number remains shoulder depth; margins are not summed into a quality score.
Ordered path after Stage I
This study observes the next 24 closed candles after Stage I by default. Its horizon is adjustable from 1 to 150. The confirmation candle is excluded.
For a high, outside means above the selected origin price and inward means downward. For a low, outside means below the origin and inward means upward. Wick excursions always use chart highs and lows, even when the main detector uses Bodies or Close.
The outside boundary is beyond the origin by max(outside ATR buffer, minimum tick buffer). Defaults are 0.05 origin ATR and one tick. A wick or close must strictly cross that boundary; equality does not qualify. The inside-return clearance defaults to 0.05 origin ATR. These distances remain fixed for the record.
The record identifies the first outside wick; the first inward excursion of the configured size from the Stage-I confirmation close, initially 1.0 origin ATR; the first run of consecutive outside closes, initially two; and the first subsequent run of closes inside the origin by the return clearance, initially one.
A nonqualifying close resets an unfinished run. An inside return must follow completion of the outside-close run on later candles; it cannot be inferred from that acceptance candle's wick. Acceptance is simply the name of a price condition, not evidence of participant intent.
Path codes have the following meanings:
0: No outside wick within the observed window.
1: Outside wick occurred, but the required outside-close run did not complete.
2: Outside-close run completed, but no subsequent required inside-return run completed.
3: Outside-close run completed and was followed by the required inside-return run.
-1 in the Data Window: Unusable path, excluded from path-group statistics.
Code 1 can include isolated outside closes: it does not mean every excursion was wick-only. Code 3 records a return milestone, not a guarantee that the final candle remains inside. Code 0 applies only to the configured observation window.
The tooltip also reports event delays, outside-close count, maximum outward distance, maximum inward movement before the first outside-wick candle, and confirmation-to-horizon close drift. The confirmation candle's own outside wick is reported separately. First means first within this post-confirmation window, not necessarily first since the swing origin.
When the first outward wick and first inward excursion occur on the same candle, their order is recorded as SAME BAR - intrabar order unknown. The complete first outside-wick candle is excluded from the pre-outside inward-movement measurement. No favorable intrabar route or executable trade fill is assumed.
Groups fixed at first confirmation
At Stage I, origins with complete definition data are assigned to either All three definitions at I or Definition-sensitive at I, using the selected tie rule. That membership remains fixed even if later definition results or main-stage retention change.
Completed usable paths are compared by group. The tooltip provides sample counts, outside-wick and outside-close-run counts, inside-return counts, outside acceptance as a percentage of the group, returns as a percentage of completed outside-close acceptances, mean return delay among records that returned, ending close drift and event-order counts.
This answers a specific research question: how did the subsequent paths of definition-consistent and definition-sensitive origins differ in the selected sample? It does not establish that either group is a profitable filter. Initial price shapes differ, the main detector already conditions the sample, and observations may be dependent. Late outside acceptance leaves less time for a return before the horizon ends. No observed return means none within that window, not none forever.
Confirmation-retention readout
Latest shows the most recent accepted origin's classification and attained stage. A clock or ellipsis indicates observation in progress; a square means the observation window ended, not that all stages passed. An attained stage is a historical fact, not a statement that the level remains unbroken now.
Origin price, Origin age and the printed Depth / ATR refer to that latest accepted origin. Age is measured in chart bars.
II / I and III / I use the same rolling sample of initial origins that completed the full Stage-III observation horizon with usable source data. The default capacity is 100 per side. Pending observations do not enter either denominator. These percentages are extreme-retention frequencies, not win rates or forecasts.
Extra III / ATR measures additional origin-to-close drift while waiting from Stage I to Stage III, restricted to origins that attained III with usable ATR. Positive means downward additional close movement for a high, or upward for a low. It can be negative. This is distinct from movement after confirmation.
N / open shows the retention sample size and its pending observations. Detailed studies have separate populations and completion times; their counts are available in the tooltip, not substituted into this visible value.
Equal-length windows after each confirmation
The post-confirmation study measures the next H closed candles after each attained stage, with H = 12 by default. Each measurement starts from that stage's confirmation close and excludes its confirmation candle.
It records signed close drift, maximum movement away from and toward the confirmation close, and whether the selected source retained the original extreme throughout that window under the selected tie rule. Distances use origin ATR. Maximum excursions use wick highs/lows, are floored at zero and do not imply an order of execution.
All stage measurements for one admitted origin enter the completed sample together at origin + Stage-III right bars + H. This common deadline applies even when later stages are absent. Missing later-stage results are not zero observations.
A separate matched comparison uses the same Stage-III-retained origins for all three stage means and reports their paired III-minus-I difference. It remains conditional on later Stage-III attainment. Earlier measurement windows can overlap the interval required to qualify Stage III. Matching origin identities and waiting for a common deadline do not remove that selection effect or demonstrate a causal benefit of waiting.
Hover HIGH or LOW for Stage-I post-confirmation statistics, II / I and III / I numeric values for later-stage statistics, and Extra III / ATR for the matched comparison. These details do not replace the printed retention values.
Worked timing and interpretation example
Number the swing origin as bar 0. With the defaults, Stage I becomes known after bar 3 closes, Stage II can become known after bar 8, and Stage III after bar 21. Each stage concerns the same origin.
The ordered path uses bars 4 through 27. Its definition/path record becomes complete after bar 27 closes: origin + max(21, 3 + 24).
The equal-length post-confirmation study uses bars 4-15 after Stage I, 9-20 after Stage II when attained, and 22-33 after Stage III when attained. Its entire record becomes available after bar 33 closes. The retention readout, definition/path record and equal-length study therefore have different deadlines: +21, +27 and +33 in this example.
For an illustrative swing-high origin at 100 with origin ATR of 2 and a tick size of 0.01, the default outside boundary is 100.10. Two consecutive post-confirmation closes strictly above 100.10 complete outside acceptance. A later close strictly below 99.90 completes the default inside return. If these events occur within the path horizon, the record reaches code 3, irrespective of whether Stage III was attained.
If that origin had W B C at Stage I, it remains in the definition-sensitive group. The later return does not retroactively improve its initial agreement. This example illustrates the rules, not a measured trading result or a recommended setup.
Sampling, missing data and historical inspection
Both detailed studies default to All accepted origins and offer their own Non-overlapping per side setting. Non-overlap admits an origin only when its Stage-I confirmation is strictly after the preceding admitted origin's common deadline on that side. Admission is decided at Stage I. A later failure or exclusion does not cause retrospective replacement with a skipped origin. Opposite-side windows may overlap; non-overlap does not prove independence.
The equal-length study excludes whole records with missing required OHLC/source data between first confirmation and common maturity, or unusable origin ATR. Its rolling capacity counts usable completed initial origins.
The definition/path study retains completed admitted records, including records whose paths are unusable. Such paths are excluded from path-group statistics, while usable definition tests can remain in their respective denominators. Unknown initial definitions cannot enter either initial-definition group. Missing or malformed required path OHLC and missing or nonpositive origin ATR do not become successful holds. Counts of pending records, exclusions and admission skips are reported separately.
The table shows the latest closed-bar state of the loaded execution, not the historical bar under the cursor. Panning changes chart presentation, not the table's statistical cutoff. Use historical Data Window outputs or Bar Replay to inspect earlier available information. Tooltip timestamps identify bar-open times in the exchange timezone; observations become available only after the relevant bar closes.
Data Window, alerts and controls
The Data Window includes six stage-price event series; optional historical post-confirmation means, held frequencies and sample sizes; individual results on their common completion candle; matched comparisons and sample accounting; and six definition/path event outputs containing origin time, initial agreement and path code for each side. Outcome timestamps identify earlier origins without moving those outcomes backward in time.
Eleven alert conditions cover the six stage confirmations, any stage confirmation, retention-horizon completion, the two side-specific post-confirmation completions, and definition/path completion. Conditions commit at bar close. A completion notification may include an unusable record and is not a successful-outcome notification. Ordered-path completion is not a real-time breach or return alert.
Detection rules, confirmation spans, price sources, depth and spacing filters, ATR length, research horizons, buffers, required close runs, sample capacities, admission policies and record inspection are editable. Presentation has separate controls for placement, density, marker budgets, ages, captions, colors, typography and table position. Research can be enabled or disabled without changing the primary detector. Hiding Data Window outputs does not disable the corresponding study calculations.
Scope and limitations
The contribution is the connected same-origin research workflow: definition sensitivity at first confirmation, progressively longer confirmation records, and subsequent paths compared under explicitly defined observation windows. Pivots, ATR, tie handling and price-path analysis are established building blocks; their number is not evidence of independent confirmation or exclusive novelty.
The script uses chart OHLC without external data requests or imported indicator libraries. It is published as open-source Pine Script v6 under the Mozilla Public License 2.0. It does not identify market participants, infer hidden orders, recommend a best stage or definition, or simulate trades, costs or portfolio returns.
Results depend on settings, available history, feed revisions and chart construction. Non-standard charts describe constructed OHLC. Finite samples, serial dependence, overlapping windows, conditional comparisons and repeated parameter exploration limit interpretation. No significance test, predictive accuracy or trading-performance claim is implied. Drawing caches and platform resource limits are finite; extreme settings can increase processing time.
Use the indicator to inspect swing definitions and confirmation behavior, with clear separation between what was known at confirmation and what was observed afterward. 지표

SAMS Early Morning Range LinesThis indicator maps the premarket / early-morning range (EMR) and uses that range as a reference for regular-session structure and breakout signals.
What it plots
EMR high / low (green / red): the high and low printed during the 04:00–09:30 America/New_York window. These levels persist into the regular session.
Previous-day RTH range (Rumer Box): prior regular-session high and low, with a light purple fill between them. The prior RTH range is only updated after a full RTH session has printed.
Premarket bands (RTH only): optional ±% envelopes around the EMR high and EMR low. Default is 0.03%. Use these as a buffer around the premarket extremes instead of treating the raw high/low as a single line.
Sessions are defined in Eastern time (America/New_York) so DST is handled by TradingView’s session engine.
Signals
Signals fire only after the EMR session ends and only if EMR high and low exist.
Buy: first valid break of EMR high
Sell: first valid break of EMR low
Re-Buy: after a sell, price recrosses back up through EMR low
Re-Sell: after a buy, price recrosses back down through EMR high
Only one primary buy and one primary sell are allowed per day unless a re-entry flips the state.
Signal modes
Crossover Candle — close crosses the EMR level.
First Fully Crossed — the bar’s low crosses above EMR high (buy) or the bar’s high crosses below EMR low (sell). Stricter than a close-only cross.
Open Confirmation — the cross is detected on the current bar, then confirmed on the next bar if open continues in the breakout direction relative to the prior close. Reduces same-bar fakeouts.
Default mode is Open Confirmation.
Alerts
On a confirmed signal the script fires a once-per-bar-close alert:
SAMS_EMR_BUY / SELL / RE_BUY / RE_SELL
plus ticker, interval, and close.
Create alerts from the indicator with “Any alert() function call”.
Suggested use
Use EMR high/low as the first overnight auction box. The previous-day RTH box is context for whether the open is inside, above, or below yesterday’s cash range. Bands are for traders who want a small buffer instead of a hard level. This is a level + confirmation tool, not a standalone strategy. Combine with your own risk rules, size, and higher-timeframe bias.
Notes
Works best on intraday charts that include premarket data (1–15 minute is typical). If the symbol or session settings omit 04:00–09:30 ET prints, EMR high/low will be incomplete. Past session levels and signals are not a guarantee of future results. 지표

Sattam | Harmonic LabSattam | Harmonic Lab
Sattam | Harmonic Lab is an all-in-one overlay for pattern trading: 30 harmonic and classical pattern families, ready-made entry / targets / stop for every pattern, a live panel that tracks each pattern's progress, a "possible patterns" projection for the developing leg, and higher-timeframe Supply & Demand zones. Every setting is bilingual (English | Arabic).
WHAT IT DETECTS
• Harmonic: Gartley, Butterfly, Bat, Crab, Alternate Bat, Deep Crab, Cypher, Shark, Nen Star, AB=CD, 3-Drive, 5-0, White Swan, Black Swan, Leonardo, Partizan.
• Anti patterns: Anti-Gartley, Anti-Butterfly, Anti-Bat, Anti-Crab, Anti-Shark, Anti-Cypher, Anti-Nen Star.
• Classical: Head & Shoulders, Inverse Head & Shoulders, Double Top, Double Bottom, Ascending / Descending / Symmetrical Triangle.
Patterns are built on confirmed zigzag pivots with a developing D evaluated at bar close. Drawings anchor to past pivots and a detected pattern is never redrawn. Each pattern shows its legs, shaded triangles, measurement guides with ratios, X/A/B/C/D letters, the name at D and a dotted validation zone under D. 3-Drive uses 1/2/3 boxes with extension diagonals; 5-0 uses X–B, A–C and X–D chords.
TRADE LEVELS AND LIFECYCLE
Entry, Target 1, Target 2 and Stop are computed for every pattern (defaults 10% / 40% / 94% of the pattern leg, stop at the validation edge) and drawn to the right of price until Target 1 is reached. Each pattern moves through Pending → Entered → Target 1 → Target 2, or Stopped / Invalidated / Expired. Stopped and invalidated patterns are removed at once; patterns that reached their target stay drawn for the expiry age.
ACTIVE PATTERNS PANEL
One row per active pattern: name, direction, entry, both targets, stop and age in bars, with ✓ marks as levels are reached. Optional lifecycle counters (Found / Entry / T1 / T2 / Stops / Invalid / Expired).
POSSIBLE PATTERNS
When the current leg can still complete a pattern, the projected D line, its zone and a label listing the candidate families with their D ranges (nearest first). Visual only — never part of signals or counters.
SUPPLY & DEMAND ZONES
Built on a timeframe you choose (default 4H) from a confirmed pivot followed by a displacement close beyond ATR; extended to the right and removed once a close invalidates them. Never drawn from the forming higher-timeframe bar.
ALERTS
New pattern, BUY entry, SELL entry, Target 1, Target 2, Stop, Invalidation, Expiry, New Supply Zone, New Demand Zone — plus a dynamic alert template ({ticker} {tf} {pattern} {side} {event} {entry} {t1} {t2} {sl}) for "Any alert() function call". Use "Once per bar close": all signals are computed on closed bars.
SETTINGS (groups)
01 Detection — zigzag period (8), pivot confirmation bars, nested XABCD search, candidate cap, error rate % (8), min/max pattern bars, minimum height, direction, session, max new patterns per bar, max active patterns, same-pattern blocking, expiry age, two-sided extreme bar handling.
02 Pattern families — a switch per family, Cypher minimum XC/XA, classical symmetry tolerance, H&S rules (skipped waves, pivots after the right shoulder, shoulder difference), triangle options, AB=CD time filter and tolerances.
03 Entry and targets — level basis, entry / T1 / T2 percentages, finish at T1 or T2, reward/risk targets, entry trigger (close confirmation or high/low touch).
04 Stop and validation — stop mode (zone / manual % / break-even / trailing), band padding, invalidation source, entry-side filter, validation style.
05 Appearance — draw patterns, letters, ratios, levels, validation zones, shading and transparency, palette (classic or by direction), text size, guides, line widths and styles, projection length, only active patterns, keep last pattern, maximum patterns drawn (6), completed patterns retained.
06 Projection — show nearest possible D zone, display mode, families listed, direction, colors, line width and style, prediction PRZ, Cypher forecast preference.
07 Panels — active patterns panel, lifecycle counters, size, position, alignment, colors, detection start date.
08 Alerts — event switches and the dynamic template.
09 Supply & Demand — enable, zone timeframe, pivot length, sensitivity, displacement window, width, offset, max zones per side, hide invalidated zones, colors, midline style, timeframe label.
NOTES
• Pivots need bars after them to confirm, so a pattern appears one or more bars after D completes.
• The panel and counters are not a backtest and do not represent trading performance.
• Not financial advice.
EXAMPLES
Several families on one chart:
Leonardo with a possible-patterns label:
Alternate Bat with En / T1 / T2 / SL and the panel:
Double Bottom and Symmetrical Triangle:
3-Drive and 5-0:
AB=CD completing inside a 4H demand zone:
Double Top with four possible patterns:
------------------------------------------------------------
Harmonic Lab
مؤشر متكامل لتداول الأنماط: 30 عائلة هارمونيك وكلاسيكية، مستويات دخول وأهداف ووقف جاهزة لكل نمط، لوحة حيّة تتابع تقدّم كل نمط، توقّع «الأنماط المحتملة» للموجة الجارية، ومناطق عرض وطلب من فاصل أعلى. كل الإعدادات ثنائية اللغة (English | عربي).
ما يكتشفه
• الهارمونيك: Gartley، Butterfly، Bat، Crab، Alternate Bat، Deep Crab، Cypher، Shark، Nen Star، AB=CD، 3-Drive، 5-0، White Swan، Black Swan، Leonardo، Partizan.
• الأنماط المعاكسة: Anti-Gartley، Anti-Butterfly، Anti-Bat، Anti-Crab، Anti-Shark، Anti-Cypher، Anti-Nen Star.
• الكلاسيكية: الرأس والكتفين ومعكوسه، القمة المزدوجة، القاع المزدوج، المثلث الصاعد والهابط والمتماثل.
تُبنى الأنماط على محاور زجزاج مؤكدة مع نقطة D نامية تُختبر عند إغلاق الشمعة. الرسم يُثبَّت على المحاور السابقة ولا يُعاد رسم النمط بعد اكتشافه. لكل نمط أضلاعه ومثلثاته المظلّلة وأدلة القياس بالنِّسَب وحروف X/A/B/C/D والاسم عند D ومنطقة تحقق منقّطة تحت D. 3-Drive بأرقام 1/2/3 وقطري امتداد؛ 5-0 بأوتار X–B وA–C وX–D.
المستويات ودورة الحياة
دخول وهدف أول وهدف ثانٍ ووقف تُحسب لكل نمط (افتراضيًا 10% / 40% / 94% من ضلع النمط، والوقف عند حافة منطقة التحقق) وتُرسم يمين السعر حتى بلوغ الهدف الأول. ينتقل النمط بين: قيد الانتظار ← دخل ← الهدف 1 ← الهدف 2، أو وقف / إبطال / انتهاء. الموقوف والمُبطل يُزال فورًا، والذي حقق هدفه يبقى مرسومًا حتى عمر الانتهاء.
لوحة الأنماط النشطة
صف لكل نمط نشط: الاسم، الاتجاه، الدخول، الهدفان، الوقف، وعمره بالشموع، مع ✓ عند تحقق كل مستوى. اختياريًا عدّادات دورة الحياة (Found / Entry / T1 / T2 / Stops / Invalid / Expired).
الأنماط المحتملة
حين تكون الموجة الجارية مرشحة لإكمال نمط، يُعرض خط D المتوقع ومنطقته وملصق يسرد العائلات المحتملة ونطاق D لكل منها بالأقرب أولًا. توقع بصري فقط — لا يدخل في الإشارات أو العدّادات.
مناطق العرض والطلب
تُبنى على الفاصل الذي تختاره (افتراضي 4 ساعات) من محور مؤكد يليه إغلاق بإزاحة تتجاوز ATR؛ تمتد يمينًا وتُحذف عند إبطالها بإغلاق. لا تُرسم من شمعة الفاصل الأعلى الجارية.
التنبيهات
نمط جديد، دخول شراء، دخول بيع، الهدف الأول، الهدف الثاني، الوقف، الإبطال، الانتهاء، منطقة عرض جديدة، منطقة طلب جديدة — إضافة إلى قالب تنبيه ديناميكي ({ticker} {tf} {pattern} {side} {event} {entry} {t1} {t2} {sl}) مع "Any alert() function call". اختر «Once per bar close» لأن كل الإشارات تُحتسب عند الإغلاق.
الإعدادات (المجموعات)
01 الاكتشاف — فترة الزجزاج (8)، شموع تأكيد المحور، البحث المتداخل، سقف المرشحين، نسبة الخطأ % (8)، أقل/أقصى شموع للنمط، أقل ارتفاع، الاتجاه، الجلسة، أقصى أنماط جديدة لكل شمعة، أقصى أنماط نشطة، منع تكرار النمط، عمر الانتهاء، معالجة الشمعة ثنائية الطرف.
02 عائلات الأنماط — مفتاح لكل عائلة، أدنى XC/XA لسايفر، سماحية تماثل الكلاسيكية، قواعد الرأس والكتفين (الموجات المتخطاة، المحاور بعد الكتف الأيمن، فرق الكتفين)، خيارات المثلث، فلتر زمن AB=CD وسماحياته.
03 الدخول والأهداف — أساس المستويات، نِسَب الدخول / الهدف 1 / الهدف 2، الإنهاء عند الهدف 1 أو 2، الأهداف بالعائد/المخاطرة، مُحفّز الدخول (تأكيد الإغلاق أو لمس القمة/القاع).
04 الوقف والتحقق — وضع الوقف (منطقة / يدوي % / تعادل / متحرك)، حشو النطاق، مصدر الإبطال، فلتر جهة الدخول، نمط خط التحقق.
05 المظهر — رسم الأنماط، الحروف، النِّسَب، المستويات، مناطق التحقق، التظليل وشفافيته، الألوان (كلاسيكية أو بالاتجاه)، حجم النص، الأدلة، سُمك الخطوط وأنماطها، امتداد المستويات، الأنماط النشطة فقط، إبقاء آخر نمط، أقصى أنماط مرسومة (6)، الأنماط المنتهية المُبقاة.
06 التوقع — إظهار أقرب منطقة D محتملة، وضع العرض، عدد العائلات في الملصق، الاتجاه، الألوان، عرض الخط ونمطه، منطقة PRZ، تفضيل توقع سايفر.
07 اللوحات — لوحة الأنماط النشطة، عدّادات دورة الحياة، الحجم، الموضع، المحاذاة، الألوان، تاريخ بدء الاكتشاف.
08 التنبيهات — مفاتيح الأحداث والقالب الديناميكي.
09 العرض والطلب — التفعيل، فاصل المناطق، طول المحور، الحساسية، نافذة الإزاحة، العرض، الامتداد، أقصى مناطق لكل جهة، إخفاء المُبطل، الألوان، نمط خط المنتصف، ملصق الفاصل.
ملاحظات
• المحاور تحتاج شموعًا بعدها لتتأكد، فيظهر النمط بعد اكتمال D بشمعة أو أكثر.
• اللوحة والعدّادات ليسا اختبارًا رجعيًا ولا يمثّلان أداءً تجاريًا.
• ليس توصية مالية.
지표

ICT Daily Liquidity Sweep [PineGen AI]ICT Daily Liquidity Sweep
OVERVIEW
This strategy trades liquidity sweeps in the style of ICT (Inner Circle Trader) concepts. It marks the Asian session range each day, then looks for price to sweep above or below that range — or above/below the previous day's high/low — and reverse back inside it. A sweep followed by a close back inside the range is treated as a potential liquidity grab, and the strategy enters in the direction of the reversal.
Entries are only considered during a configurable time window (London/NY hours by default), which is when these liquidity-sweep setups are most commonly discussed in ICT-based trading approaches.
HOW IT WORKS
Asian range: the script tracks the high and low of the Asian session (00:00–08:00 UTC by default, adjustable) and locks the range once the session ends.
Sweep detection: a long setup requires price to trade below the Asian low or the previous day's low and close back above it within the trading window. A short setup is the mirror condition against the Asian high or previous day's high.
Risk and exits: stop-loss is placed beyond the sweep wick with a configurable buffer. Two take-profit levels are set at user-defined risk-reward multiples (TP1 partial close, TP2 full close). A hard time-based exit closes any open position at a configurable hour to avoid holding through low-liquidity periods.
Position sizing: quantity is calculated from account equity and a user-defined risk percentage per trade, not a fixed lot size.
SETTINGS
SL Buffer (pips) — distance beyond the sweep wick for the stop
Risk % — percentage of equity risked per trade, used to size position
TP1 / TP2 R:R — take-profit distances as a multiple of initial risk
TP1 Close % — portion of the position closed at TP1
Window Start / End (UTC) — the hours during which new entries are allowed
Labels / Session backgrounds — visual toggles only, no effect on signals
BACKTEST ASSUMPTIONS
Default backtest settings use a starting capital of 10,000, 10% of equity per trade, a 0.01% commission per side, and 2 ticks of slippage. These are configurable in the Properties tab and should be adjusted to match your actual broker/instrument costs before drawing conclusions from the results — commission and slippage assumptions materially affect strategy performance, especially on lower timeframes.
IMPORTANT NOTES
This strategy does not repaint — orders are processed on bar close and higher-timeframe data is pulled with lookahead disabled. Backtest results are hypothetical and do not account for real-world factors such as latency, partial fills, or changing market conditions, and past performance is not indicative of future results. This script is provided for educational purposes and is not financial advice. Always forward-test on a demo account before considering live use, and adjust the commission/slippage settings to reflect your actual trading costs. 전략

BB Fill + Visible-Range Fib Retracement# BB Fill + Visible-Range Fib Retracement
A 2-in-1 Pine Script indicator that bundles a **Bollinger Bands volatility fill** and a **visible-range Fibonacci retracement** into a single script. If your TradingView plan limits the number of indicators you can have on a chart at once, this lets you get both tools for the price of one indicator slot.
## Bollinger Bands (grey fill)
Standard Bollinger Bands math is used under the hood:
- **Basis** = Simple Moving Average (SMA) of the source over the chosen length.
- **Upper band** = Basis + (StdDev of source over the length × multiplier).
- **Lower band** = Basis − (StdDev of source over the length × multiplier).
Unlike a typical BB indicator, the basis, upper, and lower lines are **not drawn**. Only the shaded area between the upper and lower bands is visible, giving a quick, uncluttered read on volatility/price range without adding extra lines to your chart.
**Inputs:**
- **BB Length** (default `20`) — number of bars used for the moving average and standard deviation.
- **BB Source** (default `close`) — price series the calculation is based on.
- **BB StdDev Multiplier** (default `2.0`) — how many standard deviations the bands extend from the basis.
- **BB Fill Color** (default grey) — color of the shaded band.
- **BB Fill Transparency %** (default `85`) — how transparent the shading is (higher = more transparent/subtle).
## Visible-Range Fibonacci Retracement
This tool automatically scans the bars **currently visible on your screen** to find the highest high and the lowest low, then draws the standard Fibonacci retracement levels between them:
`0, 0.236, 0.382, 0.5, 0.618, 0.786, 1`
The retracement direction is auto-detected: if the low occurred before the high in the visible range, it's treated as an uptrend (levels retrace down from the high); otherwise it's treated as a downtrend (levels retrace up from the low). Each level is drawn as a horizontal line spanning the visible range, with an optional price label at the right edge showing the level ratio and its price.
**Inputs:**
- **Show Fib Retracement** — toggles the fib lines on/off.
- **Show Fib Price Labels** — toggles the price labels next to each fib line on/off.
**Important behavior to understand:** the lines update to reflect the highest high/lowest low of whatever range you're viewing when you scroll or zoom the chart, but Pine Script only allows a script to redraw on the arrival of new bar/tick data or when the chart is reloaded — not on every scroll/zoom gesture by itself. In practice this means the levels catch up shortly after you stop interacting with the chart (or on the next price update), rather than tracking your viewport in real time. Because of this, the tool is a **discretionary visual aid** meant for manual chart reading, not a deterministic signal — it should not be used as input to automated strategies or backtests, since its output depends on your current viewport rather than a fixed, reproducible calculation.
## How to use
- Use the grey BB fill as quick visual context for current volatility — a wide band suggests an expansive/volatile market, a narrow band suggests consolidation.
- Use the fib levels as an on-the-fly support/resistance reference for whatever swing high/low is currently in view — zoom or scroll to the price range you care about, let the chart refresh, and read the levels as potential reaction zones.
- Combine both: watch for price reacting near a fib level while inside or near the BB shaded zone for added confluence.
## Settings summary
| Input | Default | Description |
|---|---|---|
| BB Length | 20 | Number of bars for the SMA basis and standard deviation. |
| BB Source | close | Price series used for the Bollinger Bands calculation. |
| BB StdDev Multiplier | 2.0 | Multiplier applied to standard deviation to set band width. |
| BB Fill Color | grey | Color of the shaded area between the bands. |
| BB Fill Transparency (%) | 85 | Transparency of the BB shading. |
| Show Fib Retracement | true | Toggles drawing of the fib retracement lines. |
| Show Fib Price Labels | true | Toggles price labels next to each fib line. |
## Limitations
- The fib retracement only redraws when new bar/tick data arrives or the chart reloads — it does not update live as you scroll or zoom, due to a Pine Script platform limitation.
- Not intended for automated strategy logic or backtesting: the visible-range calculation is viewport-dependent and not deterministic across runs.
- The script keeps an internal history array of bar times/highs/lows that grows as the chart's loaded history grows, which can add a small amount of memory/processing overhead on very long chart histories.
---
Last updated (UTC): 2026-09-13 08:41:01 UTC
지표

MOYA Sessions & Volume Profile [RealSebastianMoya]Hello traders!
Introducing: "MOYA Sessions and Volume Profile"
This script rebuilds a full Volume Profile for any session length you choose — from a single Tokyo/London/New York session up to a full Yearly cycle — and layers on POC, Value Area High/Low, a live in-progress profile, and (new) real futures volume normalization for Forex/CFD charts.
But before getting into the settings, it's worth explaining where this way of reading the market comes from, because the indicator has no real value if you don't know what questions it's actually answering.
The Underlying Theory: Auction Market Theory
The market isn't a line going up or down. It's a continuous auction. At every moment, buyers and sellers are negotiating a "fair" price, and price moves searching for the level where both sides are willing to transact in volume.
This theory — originally developed for Market Profile by J. Peter Steidlmayer at the CBOT — starts from a simple idea:
Price tells you where the market moved. Volume tells you how much conviction was behind that move.
A regular candlestick chart only shows you the time sequence of price. A Volume Profile rotates that information 90 degrees and asks a different question at every price level: "how much actually traded here?"
The level with the most activity is the Point of Control (POC) — the price the market has "voted" for most often as fair.
The Two Market Regimes
Under this theory, the market constantly alternates between two regimes:
Balance / Equilibrium
Technical name: Balance, Rotational Value Area
What it means: Buyers and sellers accept a range and price rotates inside it without clear direction
Profile shape: Bell curve (D-Shape) — POC centered
Imbalance / Trend
Technical name: Imbalance, Trend Day, Directional Auction
What it means: One side (buyers or sellers) dominates and price refuses to rotate, moving away from the range
Profile shape: Spike (P-Shape or b-Shape) — POC at one extreme
Knowing which regime the market is in completely changes what a touch of the POC or a Value Area edge should mean to you. This is what many newer traders miss: they apply the same rule ("buy at VAL, sell at VAH") regardless of regime, and end up fading strong trends as if they were reversions.
Correct Terminology — What Each Thing Is Actually Called
Here's the real vocabulary used when trading with Volume Profile, so you know exactly which term to use and what each one means:
Levels
POC (Point of Control): the price with the highest traded volume in the session. It's the center of gravity of price.
VAH (Value Area High): the upper boundary of the zone where 70% (adjustable) of volume occurred.
VAL (Value Area Low): the lower boundary of that same zone.
Value Area (VA): the full range between VAH and VAL — the fair price zone accepted by the market.
Naked POC: a POC from a previous session that price has not yet returned to touch. These act as strong magnets because they represent unresolved business.
Price Behaviors
Mean Reversion: when price moves away from the POC but returns to it because the market is in balance. This is the dominant behavior inside an equilibrium regime.
Continuation: when price breaks a Value Area extreme and keeps moving in that direction without returning, because the market is in imbalance.
Rejection: price touches a level (VAH, VAL, or POC) and snaps back quickly, leaving a wick — a sign that level was defended.
Acceptance: price enters a zone and stays there, building new volume — a sign the market considers that new range fair.
Excess: a long, thin wick with no volume behind it — a sign of violent rejection of a price, typical at range extremes.
Breakout: when price exits the Value Area with force and increasing volume. If acceptance follows the breakout, it confirms as a trend start; if there's no acceptance, it's a false breakout (fakeout) and price returns to the range (this is mean reversion after a failed breakout attempt).
Double Distribution (B-Shape): when the profile shows two high-volume zones separated by a low-volume zone — indicates the market was in two distinct price agreements during the session, typical of a trend that paused midway.
On Buyers and Sellers
Classic Volume Profile doesn't directly measure who bought or sold (that's what Delta/CVD does, not part of pure profile reading), but dominance can be inferred by observing:
If the POC shifts upward session after session, buyers are defending higher prices, buyer control.
If the POC shifts downward session after session, seller control.
If the POC stays relatively fixed while volume grows, both sides are actively negotiating without ceding ground, balance, indecisive market.
How the Indicator Works Within This Theory
The script tracks session boundaries using exact timeframe change detection and rebuilds the price/volume grid every time a new session starts.
Each candle's volume is distributed across the price levels its high-low range actually touched (body/wick weighted model), so the profile reflects where price genuinely spent time and volume — not just where it closed.
Once a session closes, the script locates the POC and expands outward, level by level, until the configured percentage of total volume (default 70%) is captured — that boundary becomes your Value Area.
Rather than just showing you where price moved, this helps you answer:
Where did volume concentrate during the session?
Was the session accepted (balance) or rejected (imbalance)?
Where is the fair price zone for this period?
How does that zone line up against higher or lower timeframe context?
While a session is still forming, the script keeps its profile, POC, and Value Area updating in real time (Live Zone) — not just the last closed session — so you can react to developing structure instead of only analyzing it afterward.
Trading Scenarios — How This Is Actually Traded
These are the real scenarios where this reading applies. You add the chart; here's the logic behind each one.
Scenario 1 — Mean Reversion Inside Balance
Regime context: The previous session's profile shows a bell-curve shape (D-Shape), POC centered, and a wide Value Area that has stayed stable across several sessions. This indicates a market in balance.
What you see on the Volume Profile: Current price is drifting away from the POC toward the VAH without growing volume behind it (little real push).
Reading: Since we're in a balance regime, the move toward VAH is likely testing the edge of the range, not the start of a trend.
How it's traded: Look for a short on rejection at the VAH, targeting the POC. Stop above the VAH with a small buffer. This is the classic fade trade — and it only makes sense because the regime is balance; the same signal in a trending regime would be a trap.
Scenario 2 — Continuation After a Breakout With Acceptance
Regime context: Price breaks above the previous session's VAH. Instead of falling back, price stays above that level for several candles, and the new forming profile (Live Zone) starts building its own POC above the old VAH.
What you see on the Volume Profile: Acceptance — the market is actively trading in the new price range, not just passing through it.
Reading: This is evidence of directional imbalance — control shifted hands (likely to buyers) and a new Value Area is forming higher up.
How it's traded: Look for a long entry on the first pullback into the old VAH (which now acts as support — the classic resistance-to-support flip), targeting the next significant volume level from a higher timeframe (e.g., the weekly POC if you're trading on Daily). Stop below the old POC.
Scenario 3 — False Breakout (Fakeout) — Reversion, Not Continuation
Regime context: Price breaks below the VAL with a strong candle, but in the following session (or in the indicator's Live Zone) price returns inside the original Value Area without building new volume below.What you see on the Volume Profile: No acceptance — the new profile forming outside the range has very little volume compared to the prior profile, a sign nobody is defending that price.
Reading: The breakout was a liquidity grab, not a real regime change. The market is still in balance.How it's traded: Look for a long entry on the return inside the Value Area, targeting the POC and potentially the opposite VAH. This is the scenario where confusing "breakout" with "continuation" costs the most money — which is why the indicator's Live Zone is key: it lets you see in real time whether the new profile is gaining volume (real continuation) or staying empty (fakeout).
Scenario 4 — Double Distribution (B-Shape) — A Pause Inside a TrendRegime context: The session's profile shows two separate high-volume zones with a thin low-volume "neck" between them.
What you see on the Volume Profile: The market traded heavily in one range, then migrated and traded heavily again in another range, without spending much time in the middle.Reading: This typically occurs inside a trend that paused — two distinct price agreements in the same session, usually connected by a fast directional move (the low-volume "neck" is where price moved without resistance).
How it's traded: The low-volume neck (the thin part of the profile) is a low-liquidity zone — if price returns there, it tends to cut through quickly in either direction, not stay. It's not a zone to trade reversion; it's a zone to wait for price to cross through and react at the POC of whichever side it's heading toward.
Scenario 5 — Multi-Timeframe Confluence (the Indicator's Most Powerful Use)Regime context: You run the indicator on Weekly and see current price touching the weekly VAL. You switch to Daily and see a daily POC also forming right at that same level.
What you see on the Volume Profile: Two different timeframes coinciding at the same price — the "why" (weekly context) and the "when" (daily execution) are aligned.Reading: This confluence across timeframes is the highest-probability signal in the whole system, because it doesn't depend on a single profile — it depends on the market respecting the same level from two different time perspectives.
How it's traded: Take the entry on Daily (precise execution), with directional bias given by the weekly regime (if weekly price is in balance, trade the reversion toward the weekly POC; if weekly is in imbalance, trade continuation toward the next relevant volume level). Stop goes outside the daily Value Area; target is the weekly POC or the opposite VAH/VAL, depending on the identified regime.
Scenario 6 — Using Real Futures Volume to Confirm Regime on Forex/CFDRegime context: You're trading XAUUSD on your CFD broker. Your broker's tick volume is synthetic (it counts price changes, not real contracts), so a profile built on that volume can show a different shape than actual market activity.
What you see on the Volume Profile: With External Futures Volume enabled and auto-detect pointing to COMEX:GC1! (Gold futures), the profile now reflects real futures market participation, while price levels still come from your XAUUSD chart.
Reading: This matters especially when your broker's tick volume gives you a POC in one place and real futures volume gives you a POC somewhere else — the difference tells you that real institutional market activity sits at a different level than what your broker is showing.
How it's traded: Prioritize the POC/VA calculated with real futures volume over native tick volume when the two diverge, because regulated futures volume (CME/COMEX/NYMEX) is auditable and reflects real participation, while tick count only reflects your specific broker's activity.Summary — Why Use This IndicatorThis script is designed for traders who read the market through:Volume Profile and Point of Control / Value Area (Auction Market Theory)Market regime identification (balance vs. imbalance)Multi-timeframe confluenceReal vs. synthetic volume on Forex/CFD instruments
Because you can run the same profile logic across completely different session lengths — from a single hourly cycle to a full year — you can compare how conviction built across timeframes: does the Daily POC sit inside last week's Value Area? Is price accepted or rejected at last month's VAH? That layered context is where this script earns its keep.Note: every scenario assumes you identify the market regime (balance vs. imbalance) first before deciding whether to trade reversion or continuation — trading the wrong signal for the wrong regime is the most common cause of losses when using Volume Profile.
Features
56 Session Lengths — 1 to 55 Minutes (1m, 2m, 3m, 4m, 5m, 6m, 7m, 8m, 9m, 10m, 12m, 15m, 20m, 25m, 30m, 35m, 40m, 45m, 50m, 55m), Tokyo, London, New York, 1 Hour through 12 Hours, Daily through 7 Days, Weekly through 5 Weeks, Monthly through 7 Months, Quarterly, Yearly.
POC, VAH, VAL with lines and text labels.
HVN/LVN — detects multiple volume peaks and valleys per session, not just the single POC.
External Futures Volume — auto-detects the real related futures contract for your symbol (metals, forex, indices, energy, crypto).
Live Panel — POC, VAH, VAL, distance, VA position, active volume source.
Configurable Styling — independent colors, widths, and sizes for every element.
Open Source Attribution and Credits
In strict compliance with TradingViews House Rules regarding open-source code reuse, I explicitly credit and thank the original developer @LeviathanCapital for their open-source script "Market sessions and Volume profile - By Leviathan", which served as the structural foundation for the session isolation and baseline volume array logic in this indicator.
Significant Algorithmic Enhancements and Added Value:
While the primary mathematical grid expansion retains architectural roots from open source, this script introduces massive procedural improvements, structural upgrades, and new calculations developed entirely by me to transform it into an institutional-grade utility:
Automated External Futures Volume Normalization (Forex/CFD Context): Implemented a dictionary algorithm (getAutoFuturesTicker) to auto-detect and scale native tick charts against centralized futures markets (e.g., CME:6E1!, COMEX:GC1!, CME_MINI:NQ1!). This replaces synthetic broker data with authentic trading volume while maintaining local price scales.
Volume Nodes Engine (Multi-Peak HVN / LVN Detection): Developed an array scanning filter that runs on closed sessions to automatically isolate contiguous high/low volume anomalies. This effectively flags multiple supply/demand zones (like the humps of a double-distribution profile) beyond the baseline single POC.
Real-Time Live Zone Tracking: Integrated a dynamic recalculation engine for ongoing unclosed trading sessions, updating developing POCs, VAHs, and VALs seamlessly on the active bar state.
Interactive Live Dashboard Panel: Programmed a comprehensive on-screen status table displaying absolute values for POC/VAH/VAL, current distance from point of control, value area boundary status, and status indicators of the active volume feed.
Expanded Graphical and Period Customization: Redesigned aesthetic configurations, text label sizing, box boundary styles, and added resolution adjustments alongside line right-extensions.
Open Source Attribution and Credits
In strict compliance with TradingViews House Rules regarding open-source code reuse, I explicitly credit and thank the original developer LeviathanCapital for their work.
The original script "Market sessions and Volume profile - By @LeviathanCapital served as the logical foundation for the session isolation and baseline volume array logic in this indicator. All rights and original logical baselines remain under their respective ownership.
지표

Edo Swing LevelsEdo Swing Levels — Tracks the Swing High and Low, Marks the Strong Level Defending the Trend and Flags the CHoCH When It Breaks
At any moment, market structure comes down to two prices: the last swing high and the last swing low. But they are not equal. One of them is the level that defends the current trend —the one a trader watches to know whether the trend continues or breaks— and the other is only a matter of time before it is taken. Edo Swing Levels keeps both always in view and, crucially, tells them apart.
It marks the level defending the trend as Strong —a solid, marked line— and the other as Weak —a dashed, faded line. In an uptrend the swing low is Strong (the support that holds) and the high is Weak; in a downtrend the swing high is Strong (the cap that holds) and the low is Weak. When price closes through the Strong level, a change of character (CHoCH) occurs: the structure that held the trend up breaks, the bias flips and the roles swap. Everything is validated on closed bars, so it does not repaint. The strong and weak levels, their roles and the change of character are all resolved on the chart's own series, with nothing else required.
STRONG AND WEAK LEVELS
The indicator keeps the last confirmed swing high and swing low, and classifies them by the bias. In a bullish bias, the low is the Strong level and the high is Weak. In a bearish bias, the high is Strong and the low is Weak. The Strong level is drawn solid, thicker and at full opacity; the Weak level is dashed, thinner and faded. Each line carries a label —Strong High, Weak High, Strong Low or Weak Low— and both are projected to the right by a configurable number of bars so they sit ahead of price as live references. The high level is red and the low level teal by default, with a neutral gray until a trend is defined.
SWING PROFILES
The sensitivity of the levels is set by the Swing Profile: Scalper (5 bars each side) for fast intraday levels on low timeframes, Swing (10 bars, the default) for the balanced 4H and daily read, and Long Term (21 bars) for the major levels on weekly and higher horizons. The larger the length, the more significant a turn has to be, and the more important and spaced out the marked levels are.
BIAS AND CHoCH
The bias is inferred from the breaks of structure and is what decides which level is Strong and which Weak. A close above the last swing high turns the bias bullish; a close below the last swing low turns it bearish. The decisive event is the change of character: when price closes through the Strong level —below the Strong Low in an uptrend, or above the Strong High in a downtrend— the trend that the level defended breaks, the bias flips and the strong level becomes weak. Taking out the Weak level, by contrast, is a simple continuation that confirms the trend without changing it. The solid/dashed distinction separates, at a glance, the decisive level from the one that is a mere target.
INFORMATION PANEL
A compact panel under the indicator header shows the market bias (Bullish / Bearish / Neutral) and, for the high and the low, their exact price and whether each is the Strong or Weak level, in the same red/teal color code. The bias row gives the direction; the High and Low rows give the prices and, above all, which of the two is the Strong level to watch. The panel sits in any of the four chart corners (Top Right by default), comes in three sizes (Tiny / Small / Normal) and two themes (Dark / Light), and can be hidden entirely. To keep the calculation light, it is drawn only on the last bar.
NO REPAINTING
Levels are built on confirmed pivots and breaks are validated on closed bars, so a level never appears or disappears intrabar and a wick that pierces a level but closes back on the same side does not count as a break. There are no higher-timeframe functions: all logic runs on the current chart timeframe. For a multi-timeframe read, apply it on several charts at once.
CONFIGURATION
The inputs are grouped by block. Structure sets the swing profile and how many bars the levels are projected to the right. Style exposes the high-level and low-level colors, the neutral color, the label size and the Dark/Light theme. Panel controls panel visibility, position and size. The defaults are calibrated to work without adjustment on stocks, crypto, forex, indices and futures, on any timeframe — the input most users touch is the Swing Profile, to set the sensitivity of the levels to their trading horizon.
ALERTS
Four predefined alerts cover the structure read. Strong High taken and Strong Low taken fire on the change of character —when price closes through the Strong level and the trend turns— and are the context alerts. New swing high and New swing low fire when a new level is fixed. All alerts fire on bar close, consistent with the indicator's anti-repaint validation.
HOW TO READ IT
Take the Strong level as your invalidation line: while price respects it, trading with the bias has the wind at its back, and its close-through is the signal that the trend has broken. Take the Weak level as your target: in an uptrend price tends to go for the weak high, in a downtrend for the weak low, and the distance between the two levels gives the room available inside the current structure. And treat the taking of the Strong level as the cleanest turn warning —it often marks the start of a new leg in the opposite direction. Pairing it with the HH/HL/LH/LL sequence classification reinforces the read.
OPEN SOURCE
Edo Swing Levels is published as a free open source indicator. The full Pine Script is publicly accessible on TradingView for study, adaptation and integration into any workflow. Part of the Edolab Markets free tools ecosystem, all available on TradingView.
This indicator is a technical analysis tool for educational and informational purposes only. It does not generate automatic buy or sell signals and should not be considered financial advice. Trading financial markets involves significant risk of capital loss. Past performance does not guarantee future results. Always use proper risk management. 지표

지표

Coasyn Directional Order BlocksCoasyn Directional Order Blocks
Coasyn Directional Order Blocks identifies directional supply and demand zones created around market-structure breaks with displacement.
The indicator is designed to help traders visualize potential areas of prior institutional participation without turning those zones into automatic trade signals.
It tracks both:
Demand Order Blocks
Supply Order Blocks
Each block remains active until it is touched, invalidated, or removed according to the settings selected by the user.
How blocks are created
A new block requires two things:
1. A structure break
The indicator tracks recent swing highs and swing lows using the configured Structure Swing Length.
A demand block requires price to break above the most recent tracked swing high.
A supply block requires price to break below the most recent tracked swing low.
2. Displacement
The structure break must occur with a directional displacement candle.
The displacement filter uses:
ATR-relative candle range
minimum candle-body percentage
bullish direction for demand
bearish direction for supply
This helps prevent every minor structure break from automatically becoming an order block.
Origin candle
After a valid structure break, the indicator searches backward for the opposing candle that preceded the move.
For a Demand Block, it searches for a bearish candle.
For a Supply Block, it searches for a bullish candle.
The number of candles searched is controlled by:
Origin Candle Search
Order Block Zone
The Order Block Zone setting determines how much of the origin candle becomes the displayed zone.
Available options:
Full Candle
Uses the full high-to-low range of the origin candle.
Body
Uses only the candle body.
Refined
Uses a directional refinement of the candle range.
For demand, the refined zone uses the candle low through the top of the body.
For supply, the refined zone uses the bottom of the body through the candle high.
Block states
Each block begins as a fresh active zone.
The indicator then tracks whether price returns to the zone.
The Touched When setting controls when a block is considered touched.
Available options:
First Contact
The block becomes touched as soon as price reaches the outer edge of the zone.
50% Reached
Price must reach the midpoint of the order block.
Full Fill
Price must travel completely through the block to its opposite boundary.
Keeping touched blocks
Enable:
Keep Touched Blocks
to leave previously contacted blocks visible.
Touched blocks are displayed with increased transparency so they can be visually distinguished from fresh zones.
Disable this setting if you want a block removed after its first qualifying interaction.
Invalidation
The Invalidated When setting determines when a block is considered structurally broken.
Available options:
Close Beyond
A candle must close beyond the invalidation boundary.
Wick Beyond
Any wick through the invalidation boundary is sufficient.
For demand blocks, invalidation occurs below the zone.
For supply blocks, invalidation occurs above the zone.
Keeping invalidated blocks
Enable:
Keep Invalidated Blocks
if you want failed blocks to remain visible for review.
Invalidated blocks are converted to a neutral gray appearance and stop extending forward.
When disabled, invalidated blocks are removed from the chart.
Maximum active blocks
Maximum Active Blocks per Direction controls how many demand and supply zones can remain active at once.
Older blocks are removed automatically when the configured maximum is exceeded.
Demand and supply limits are tracked independently.
Forward projection
Forward Projection determines how far active order blocks extend to the right of the chart.
The zone continues updating forward while it remains active.
50% midline
Enable:
Show 50% Line
to display the midpoint of each order block.
This provides a visual reference for traders who use partial mitigation or midpoint interaction as part of their own process.
Structure break markers
Enable:
Show Structure Break Marker
to mark the candle where a valid displacement-driven structure break created a new order block.
These markers are optional and are disabled by default.
Labels
Enable:
Show Demand / Supply Label
to display the directional identity of each block directly inside the zone.
Colors
Demand and supply colors are fully configurable.
Users can also adjust:
fresh-block transparency
touched-block transparency
invalidated-block color
Alerts
The indicator includes alert conditions for:
New Demand Order Block
New Supply Order Block
Demand Order Block Entered
Supply Order Block Entered
Demand Order Block Invalidated
Supply Order Block Invalidated
Alerts must still be configured by the user through TradingView's alert system.
Example workflow
A trader may use the indicator to identify a demand zone created after a strong bullish displacement through prior structure.
The trader can then observe whether price:
remains away from the block → returns to the block → reaches the selected touch threshold → holds or invalidates
The indicator reports the state of the zone.
It does not determine whether the trader should enter.
Important
Coasyn Directional Order Blocks is a market-structure visualization tool.
It does not provide:
automatic entries
buy or sell recommendations
targets
stop placement
position sizing
automated execution
Order blocks should be interpreted within the trader's own market structure, risk, and strategy framework.
A displayed block is a reference zone, not a guarantee of future support, resistance, reversal, or continuation.
Built by Coasyn Market Systems. 지표

Coasyn Session AnchorCoasyn Session Anchor
Coasyn Session Anchor is an intraday session-reference tool for marking important FX trading-session events directly on the chart.
The indicator can track:
Tokyo Open
Tokyo Close
Europe Open
London Open
New York Open
New York Close
Each enabled event can create:
a vertical timing marker showing when the session event occurred
a horizontal price anchor extending from that event
an optional label identifying the session
The indicator does not generate trade signals, determine market direction, or execute orders.
Its purpose is to provide consistent session timing and price-reference levels.
How to use it
Open the indicator settings and first choose your Anchor Timezone.
The default is:
Etc/UTC
All session times entered in the indicator are interpreted using this timezone.
For each session event, you can:
Enable or disable the event.
Enter the event time using HH:MM format.
For example:
00:00
07:00
08:00
13:30
Session times
The default configuration is:
Tokyo Open — 00:00
Tokyo Close — 09:00
Europe Open — 07:00
London Open — 08:00
New York Open — 13:30
New York Close — 21:00
These times are fully editable.
If your preferred session definition, broker convention, daylight-saving adjustment, or operating timezone is different, change the values in the settings.
Horizontal anchor price
The Horizontal Anchor Price setting determines which price is used when a session event occurs.
Event Open
Uses the chart bar's opening price when the session anchor is detected.
Event Close
Uses the chart bar's closing price.
The resulting level extends to the right as a reference for later price interaction.
Vertical session markers
Enable:
Show Vertical Session Timing Lines
to draw a vertical line at each enabled session event.
This provides a visual reference for when major trading sessions begin or end.
Horizontal session levels
Enable:
Show Horizontal Anchor Levels
to extend the selected event price across the chart.
These levels can be used to observe how price behaves relative to prior session participation points.
The indicator does not assign bullish or bearish meaning to those levels.
Labels
Enable:
Show Anchor Labels
to identify each session directly on the chart.
Labels include:
TOKYO OPEN
TOKYO CLOSE
EUROPE OPEN
LONDON OPEN
NY OPEN
NY CLOSE
Historical anchors
By default, Keep Historical Anchors is disabled.
When disabled, each session event keeps only its most recent anchor.
For example, when the next London Open occurs, the previous London Open anchor is removed and replaced with the new one.
Enable Keep Historical Anchors if you want previous session anchors to remain visible.
Be aware that keeping large amounts of historical session data can create substantially more chart objects.
Display controls
The indicator allows you to configure:
session colors
line width
horizontal levels
vertical timing markers
labels
historical anchors
Each major session can use its own color so different session events remain easy to distinguish.
Example workflow
A trader operating during the London and New York sessions might enable:
Europe Open
London Open
New York Open
while disabling session events they do not use.
The chart will then maintain timing and price anchors for those specific events.
This makes it easier to observe whether price is trading:
above or below a session-opening reference
back through a prior session level
around the transition between trading sessions
The interpretation remains entirely with the trader.
Timeframe note
Coasyn Session Anchor is designed primarily for intraday charts.
The precision of an anchor depends on the chart timeframe.
On lower intraday timeframes, the bar containing the configured session time will generally provide a more precise representation of that event.
On larger chart intervals, one candle may span multiple session events, so the event price should be treated as a broader reference rather than an exact tick-level session price.
Important
Coasyn Session Anchor is an informational charting tool only.
It does not provide:
buy or sell signals
trade entries
targets
stop placement
position sizing
automated execution
directional recommendations
It provides time and price anchors around the session events selected by the user.
Built by Coasyn Market Systems. 지표

50% Retrace of Previous HTF Candles50% Retrace of Previous HTF Candles
This indicator plots the 50% midpoint of the most recently completed candle on five higher timeframes: Daily, 4-Hour, 1-Hour, 30-Minute, and 15-Minute.
Each level is drawn as a horizontal line that starts at the exact close of the previous higher-timeframe candle and ends a short distance after the current bar. A clear label sits to the right of each line so you can quickly see which timeframe it belongs to.
How it works
The script pulls the high and low of the last fully closed candle on each timeframe using request.security(), then calculates the simple midpoint: (High + Low) / 2. Because it only uses completed candles, the levels do not repaint.
Why these timeframes?
These five timeframes cover a useful range of market structure:
Daily – Captures the broader daily bias and key structural levels.
4H – Common intermediate timeframe used by many day and swing traders.
1H – Bridges higher timeframes with intraday price action.
30m & 15m – Provide finer, more responsive levels for shorter-term entries and exits.
Together they give a layered view of recent higher-timeframe midpoints without cluttering the chart with every possible timeframe.
Why this is useful
Many traders watch the midpoint of recent higher-timeframe candles as potential areas of interest. Price often reacts around these 50% levels — either finding support/resistance or treating them as mean-reversion reference points. Having multiple HTF midpoints visible at once gives useful context without constantly switching timeframes.
Customization
You can toggle each timeframe on or off independently, change the colors, adjust the line width and style, and modify the labels if you prefer different wording. Everything is controlled from the indicator settings.
Currently uses a coral color palette designed to stay visible on both light and dark charts.
Simple, clean, and focused on one practical concept. 지표

Smart Money Concepts [AxeAlgo]Overview
- Smart Money Concepts is a clean, non-repainting indicator designed for traders who want to identify institutional market structure without clutter.
The indicator visualizes where smart money is likely to defend, attack, and accumulate positions by displaying order blocks, fair value gaps, liquidity pools, and premium/discount dealing ranges on your chart.
What It Shows
Market Structure (CHoCH and BOS)Identifies when the market changes direction (Change of Character) and when new directional commitment breaks prior structure (Break of Structure). Each signal confirms only after a specified number of bars, ensuring no repainting.
Order BlocksHighlights the price zones where the last aggressive institutional movement originated. These are areas where smart money entered positions and often acts as support or resistance on subsequent pullbacks.
Fair Value GapsDetects imbalances between candlesticks (gaps not filled by wicks). The indicator marks these zones because institutions often return to fill them as price moves away.
Liquidity PoolsAutomatically identifies clusters of equal highs and equal lows where retail traders typically set stop losses. The indicator marks when price breaks through these pools (institutional sweeps).
Premium and DiscountDisplays whether price is trading above (premium) or below (discount) the 50% equilibrium level between the most recent swing high and low. Extreme premium or discount often precedes reversals.
How to Use It
Enable individual components using the dashboard toggles: Show Structure, Show Order Blocks, Show Fair Value Gaps, Show Liquidity Pools, Show Premium/Discount.
Turn on the dashboard to see your current swing bias, internal structure direction, and range position at a glance.
Auto-Tune automatically scales all sensitivity parameters based on your chart timeframe. Turn it off if you prefer manual tuning.
Use Simple Mode to display only swing structure without internal noise for a cleaner chart.
Key Settings
Confirmation Bars: How many bars confirm a pivot before a structure signal fires. Higher values filter out false signals but add lag. Default is 2.
Min Displacement: The minimum price movement (in ATR multiples) required for a structure signal to register. Default is 1.0 ATR.
Zone Sizing: Controls the minimum and maximum height of order blocks and FVGs. Adjust to filter noise or capture smaller opportunities.
P/D Lookback: How many bars back to scan for the swing high and low that define your premium/discount range.
Dashboard Position and Size: Choose where the info table appears and how large you want it.
Colors: Customize bullish, bearish, and gap colors to match your chart theme.
What This Indicator Is For
Smart Money Concepts is intended for traders who want to visually identify institutional order flow patterns and understand where smart money accumulates and distributes. It helps you:
Spot areas where institutions likely accumulated or distributed (order blocks and FVGs)
Recognize when price is overextended and vulnerable to reversal (premium/discount extremes)
Distinguish real structural breaks from noise during choppy consolidation
Plan entries and stops around levels where smart money defends
How It Works
The indicator uses pivot-point analysis to identify swing highs and lows, then marks the price zones where directional movement originated (order blocks). Fair value gaps are detected using standard three-candle imbalance logic. Liquidity pools are identified by clustering equal price levels within a configurable tolerance.
All signals confirm only on closed bars. Zones never repaint, but they shrink or change state as price action develops.
Limitations
The indicator shows 5 active zones at a time to keep your chart clean. If multiple institutional structures are forming simultaneously, older zones will age out. This is by design to prioritize the most recent price action.
This indicator identifies structural levels and patterns. It does not predict price direction or guaranteed support/resistance. Use it as one component of a complete trading plan, not as a standalone signal.
Fair value gaps and order blocks are useful but not infallible. Price may skip through them or reverse before reaching them.
Important Disclaimer
This indicator is for educational and analytical purposes only. It does not provide financial advice, and past performance does not guarantee future results. Trading involves risk of loss. Always use proper risk management, stop losses, and position sizing. Never risk more than you can afford to lose.
The accuracy and effectiveness of this indicator depends on your market conditions, timeframe, and trading methodology. Results vary by trader and asset class.
지표

Swing Liquidity Targets (BSL/SSL)Swing Liquidity Targets (BSL/SSL) marks confirmed swing highs as buy-side liquidity (BSL) and swing lows as sell-side liquidity (SSL), each as a line extending forward from the swing.
HOW IT WORKS:
A target is marked swept the moment price wicks through it. The line freezes there and turns gray. Rather than leaving every old swing on the chart forever, unswept targets expire after a set number of calendar days, so the same setting behaves the same whether you're on a 5 minute chart or a daily one, and when two same-side targets land close together, only the one nearer to price is kept instead of stacking duplicate lines on top of each other.
NON-REPAINTING:
pivots confirm after the bars set in Right Bars, and lines don't move once drawn.
USAGE:
treat the lines as context for where price may be drawn to next, not as a standalone entry signal. Combine with your own structure and confirmation.
LIMITATIONS:
like any pivot-based tool, the most recent swing won't show a target until Right Bars bars have closed after it, so very recent price action may look "missing" for a short while. That's what keeps it non-repainting rather than a bug.
WHAT YOU CAN CHANGE:
-> Left/Right Bars, pivot sensitivity for swing detection
-> Max Target Length (days), how long an unswept target stays active before it stops extending
-> Cluster Tolerance (x ATR), how close two same-side targets need to be before the weaker one is dropped
-> Show BSL / Show SSL, turn either side off completely
-> Line Style, dotted, dashed, or solid
-> Line Width
-> BSL / SSL / Swept colors
-> Show BSL/SSL Labels toggle
I hope this is of use to you! Let me know if you like it. 지표

지표

TIS_SwingOVERVIEW
TIS_Swing detects swing highs and swing lows and, unlike most pivot tools, publishes the last confirmed level as a continuous value that other scripts can read.
Standard pivot indicators return a number only on the bar where the pivot is confirmed and nothing on every other bar. That is fine for drawing a dot on the chart, but it makes the level unusable for comparison: on any given bar you cannot ask whether the current price is above the last confirmed swing high, because on that bar the pivot series holds no value. TIS_Swing keeps the level alive between pivots, so that question can be answered on every bar, by you visually or by another script through the source dropdown.
HOW IT WORKS
A bar qualifies as a swing high when its high is greater than or equal to the highs of the bars that follow it, and strictly greater than the highs of the bars that precede it. The number of bars checked on each side is set by Strength Left and Strength Right. Swing lows use the mirrored rule. The comparison on the right side is inclusive, so a candidate that ties with a later bar still qualifies; this produces slightly more pivots than a strictly greater definition, and is intentional.
A pivot can only be confirmed once the bars to its right exist, so a pivot is always confirmed Strength Right bars after it forms. It is never confirmed earlier and it is never revised afterwards, so nothing repaints.
Once a pivot is confirmed, its price becomes the current level for that side and stays there until the next pivot on the same side replaces it. When the series trades through the level, the level is marked as broken. What happens next depends on Remove Broken Pivot Lines:
- ON, the default: the visible level is dropped and no level is shown until a new pivot forms. This is the familiar behaviour of most pivot tools.
- OFF: the visible level stays where it was until a new pivot replaces it, so a broken level remains on screen as a reference.
Either way, a second pair of values keeps the last level regardless of the setting. Those are the plots marked (persistent), and they exist so that comparisons are always possible.
WHAT YOU CAN DO WITH IT
Market structure on price. With the level available on every bar, a higher high is simply the current price trading above the last confirmed swing high, and a lower low is the mirror. You can read it off the chart or compute it in your own script by selecting Last Swing High (persistent) as a source and comparing it against the close.
Divergence on an oscillator. Turn on Use Other Source, point it at a stochastic, an RSI or any other plotted series, and move the script to its own pane. The pivots are then detected on the oscillator instead of on price. A higher swing low on the oscillator while price is still making lower lows is a classic divergence, and here it is visible as a stepped level moving up while price moves down.
Breakout timing. With Remove Broken Pivot Lines on, the moment the level disappears is the moment the last swing was taken out. That transition is also available as an alert.
PARAMETERS
Parameters
- Strength Left: bars to the left of the candidate that must be lower for a high, or higher for a low. Default 5.
- Strength Right: bars to the right required to confirm the pivot. Also the confirmation delay, in bars. Default 2.
- Remove Broken Pivot Lines: drop the visible level once it is broken. Default on. Does not affect the (persistent) plots.
- Use Other Source: detect pivots on another plotted series instead of the bar highs and lows. Both sides then use the selected series.
- Source: the series used when Use Other Source is on.
Visual Settings
- Show Levels: opacity of the stepped level lines.
- Show Persistent Levels: opacity of the thin lines that always keep the last level. Off by default to keep the chart clean.
- Show Pivot Markers: diamonds drawn on the confirmed pivot bars.
- Extend to the Right: horizontal line projected forward from the last pivot on each side.
- Swing High Color, Swing Low Color, Line Width, Extension Line Style.
The Show options change opacity only. The four series are always published, so another script can read them even when they are not visible on the chart.
OUTPUTS
Four values are available in the source dropdown of any other indicator or strategy:
- Last Swing High and Last Swing Low: the level as shown, honouring Remove Broken Pivot Lines.
- Last Swing High (persistent) and Last Swing Low (persistent): the last confirmed level, kept regardless of that setting.
Four alerts are available: New Swing High, New Swing Low, Swing High Broken, Swing Low Broken.
LIMITATIONS
- A pivot is confirmed Strength Right bars after the bar that forms it. On the chart this looks like a delay, and it is one. It is inherent to any pivot definition that requires confirmation from the right, and it is the price of not repainting.
- These levels are reference points, not entry signals. Nothing here tells you which way to trade.
- With Remove Broken Pivot Lines on, the level is dropped on the same bar as the break. A comparison such as close above Last Swing High will therefore never be true, because the value is already gone by the time it would be. Use the (persistent) plots for that comparison, or detect the break as the transition of the visible plot to no value.
- Before the first pivot on a side is confirmed, that side publishes no value.
- Pine fixes the pane at compile time, so with a non-price source the script has to be moved to its own pane manually.
- Larger Strength values give fewer and more significant levels but a longer confirmation delay. There is no setting that avoids that trade-off. 지표

B8 UltimateB8 Ultimate
An Open Price Range indicator that automatically identifies the High/Low of a reference hour and extends this range over a configurable duration.
Features:
Up to 5 configurable symbols.
Zones are displayed only on their corresponding symbol.
Independent reference time for each symbol, in 30-minute increments.
Independent time zone for each symbol, with automatic Daylight Saving Time (DST) handling.
Rectangle duration and color configurable for each symbol.
Optional first-hour marker.
Configurable number of historical zones.
IG DAX and CAC preconfigured, with 3 additional free slots.
Behatsla’ha
Notes:
Uses 1H data for XX:00 reference times and aggregates 2 × 30-minute candles for XX:30.
Rectangle border width and transparency are configurable globally.
Rectangle fill can be enabled or disabled.
The optional first-hour marker automatically adapts to the chart timeframe.
The first-hour marker is displayed only on timeframes below 1H.
For XX:30 reference times on a 1H chart, the rectangle starts at the opening of the 1H candle containing XX:30. Example: 14:30 → displayed from 14:00.
The rectangle end is recalculated from this visual starting point. With a 24-hour duration: 14:00 → 14:00 the following day, preventing overlapping zones.
The High/Low is always calculated from the actual reference hour.
Short legend name: B8.
==========================================================================
Français :
B8 Ultimate
Indicateur de type "open price range" permettant de matérialiser automatiquement le High/Low d’une heure de référence et de prolonger cette zone sur une durée configurable.
Fonctionnalités :
Jusqu’à 5 actifs configurables.
Affichage uniquement sur l’actif correspondant.
Heure de référence configurable par actif, par pas de 30 minutes.
Fuseau horaire indépendant par actif, avec gestion automatique des changements d’heure.
Durée et couleur du rectangle configurables par actif.
Marqueur optionnel de la première heure
Nombre de zones historiques configurable.
DAX et CAC IG préconfigurés, avec 3 emplacements supplémentaires libres.
Behatsla’ha
Notes :
Calcul en 1H pour XX:00 et agrégation de 2 × 30 min pour XX:30.
Épaisseur et transparence du rectangle configurables globalement.
Option pour afficher ou masquer le remplissage du rectangle.
Marqueur optionnel de la première heure, adapté automatiquement à l’unité de temps affichée.
Le marqueur est affiché uniquement sur les timeframes inférieurs à 1H.
Pour XX:30 sur un graphique 1H, le rectangle commence à l’ouverture de la bougie 1H contenant XX:30. Exemple : 14:30 → affichage à partir de 14:00.
La fin est recalculée depuis ce début visuel. Avec une durée de 24 h : 14:00 → 14:00 le lendemain, afin d’éviter le chevauchement des rectangles.
Le High/Low est calculé sur l’heure réelle de référence.
Nom court dans la légende : B8. 지표

FVG AtlasFVG Atlas — Multi-Timeframe Gap Mapping
FVG Atlas maps Fair Value Gaps across up to four timeframe layers, helping you see nearby zones, overlapping imbalances, and how price interacts with them.
Designed around a clean 1-minute NQ workflow, its timeframes, filters, and display settings are adjustable for other charts.
Features
Multi-timeframe FVGs: Track bullish and bearish gaps with independent colors and invalidation rules for each layer.
Focus mode: Display nearby zones while hidden records continue tracking fills, reactions, and statistics.
50% midpoint: Show consequent encroachment and emphasize it once reached.
Origin markers: Retain a small outline where an invalidated FVG originally formed.
BPR and confluence: Highlight opposing-gap overlaps within a layer and overlapping FVGs across distinct timeframes.
Session labels: Identify gaps formed during your configured regular-session window or outside it.
Nearest-gap panel: Show the distance in points to the closest active bullish and bearish FVG.
Third-candle classification: Describe confirmed FVG formation as Expansion, Inside, Opposing, or Neutral.
First-touch reactions: Mark confirmed rejections and provide hover details identifying the contributing zones.
Optional tools: Volume Imbalances, Opening Gaps, inverse FVGs, formation grading, and configurable lifecycle alerts.
How gaps are tracked
A bullish FVG forms when candle 3’s low is above candle 1’s high. A bearish FVG uses the opposite relationship.
Choose when a zone retires: first touch, midpoint reached, full wick penetration, or a confirmed chart close at or beyond its far edge. Invalidation and complete filling are tracked separately.
Live mode displays developing gaps that can change or disappear. Confirmation is processed when the next candle of that timeframe begins, so session breaks can delay confirmation. Higher-timeframe candles are assembled from chart data.
Reading the signals
Third-candle classifications describe formation behavior; they do not predict continuation or a fill.
Rejection triangles mark price touching a confirmed zone and subsequently closing back outside its near edge within the configured window. They represent observed reactions, not buy/sell instructions.
The dashboard reports detected zones, active records, invalidation statistics, and completed first-touch reactions. These are descriptive statistics—not strategy win rates.
Customization
Adjust minimum gap size, timeframe layers, drawing lookback, Focus limits, session hours, labels, colors, and alerts. Drawing and record limits keep the display manageable. Session labels use a configurable clock window rather than an exchange holiday calendar.
For alerts, enable the desired events in settings and create a TradingView alert using “Any alert() function call.” 지표

Liquidity Sweep Confirmation Zones [Pineify]Liquidity Sweep Confirmation Zones
Overview
This overlay separates a wick beyond known swing liquidity from a response that earns a zone. It shows rails, a candidate bridge, confirmed boxes, retest wear, and a dashboard.
Problem Definition
A basic sweep rule labels every wick beyond a prior high or low. It cannot separate rejection from a breakout near the level, and it ignores later response. Permanent lines remain prominent after failure. Back-plotting a pivot also hides that right-side bars were required to confirm it. The task is to find a closed-bar pierce and reclaim at a level already known, then require timely departure before creating support or resistance.
Design Rationale
Confirmed pivots provide structure that existed before the sweep. Each rail is armed once to stop repeated events. ATR scaling replaces raw ticks across price levels, while the sweep freezes its rail, extreme, close, and ATR so later bars cannot rewrite the test. A limited window rejects delayed movement. Net displacement alone was rejected because a choppy path can eventually travel as far; efficiency also measures progress versus total close travel. This can omit real reversals, but accepted events are easier to audit. Dual-rail sweeps are ignored as directionally ambiguous.
Key Features
One-shot confirmed swing rails.
ATR-scaled pierce and reclaim gates.
Frozen response, path efficiency, and age.
Zones beginning at confirmation, with retest wear and bounded life.
Closed-bar candidate, confirmation, and invalidation alerts.
How It Works
ATR is calculated while a pivot waits for its right-side bars; its rail appears only when confirmed. A later closed bar becomes a candidate when its wick pierces one armed rail by the required ATR fraction and its close reclaims it by the chosen distance. That rail is consumed, while a dual-rail reclaim is ignored.
The candidate freezes direction, rail, extreme, reclaim close, and ATR. Later bars accumulate close travel. Response is directional progress divided by frozen ATR, and efficiency divides positive response by total travel. Both thresholds must pass on the reclaimed side before timeout. Closing through the extreme also fails the candidate.
Confirmation creates a green support or red resistance box on that bar. Each new entry counts as a retest and increases transparency. Bullish zones invalidate below their extreme; bearish zones invalidate above it. Age stops extension, storage removes the oldest excess box, and warm-up shows no rail until ATR and a pivot exist.
How Multiple Indicators Work Together
The stages form one causal chain. Pivots supply pre-existing levels; ATR supplies scale; reclaim establishes rejection; displacement tests follow-through; efficiency rejects wandering paths; the time window links response to sweep. The box preserves that frozen evidence for retest and invalidation. Removing a stage changes the question, so the components are not an arbitrary mashup.
Trading Ideas and Insights
A circle records rejection, not completed follow-through. The amber bridge shows the pending interval while response develops. Green means a downside sweep received efficient upward confirmation; red means the inverse. Fading records more separate retests and can suggest wear for review. These states organize rejection, confirmation, retest, and failure, but do not define entries, targets, returns, or size.
Unique Aspects
The contribution separates event knowledge from outcome. A rail begins only when confirmed, a sweep consumes it once, and its facts are frozen. Promotion needs ATR-scaled progress plus path efficiency within a fixed window. The box starts at promotion, so history does not imply earlier confirmation. Retests count only new entries, not every bar inside. This is an auditable state sequence rather than a renamed pivot marker.
How to Use
Choose pivots for the intended structure horizon.
Watch armed rails; a circle marks a closed-bar pierce and reclaim.
Read bridge, response ATR, efficiency, and age while pending.
Treat a diamond and new box as confirmation on that bar; then monitor retests and failure.
Use Once Per Bar Close alerts with separate execution and risk rules.
Customization
Larger pivots select broader but later structure. Higher pierce or reclaim values filter shallow probes. Raising displacement or efficiency requires cleaner response but reduces events; longer windows weaken temporal linkage. Zone life sets the horizon, maximum zones bounds objects, and maximum retests changes wear shading only. Visual layers hide independently. Defaults are not universal optima.
Assumptions and Limitations
Confirmed pivots are assumed useful liquidity references and ATR an adequate scale. Pivot delay leaves recent structure unavailable. Only one candidate is tracked, and dual-rail sweeps are rejected. Bar-based efficiency cannot reveal intrabar order, actual liquidity, stops, or intent. Gaps, fast trends, thin markets, and poor settings can break interpretation. Closed bars drive state, but setting or data revisions can recalculate history. The script does not detect actual stop hunts, predict reversals, measure profitability, or decide whether to trade a zone.
Conclusion
The overlay turns a known swing, closed-bar reclaim, and bounded efficient response into a staged record. No zone exists before follow-through qualifies it; delay, wear, expiry, and failure stay visible.
지표
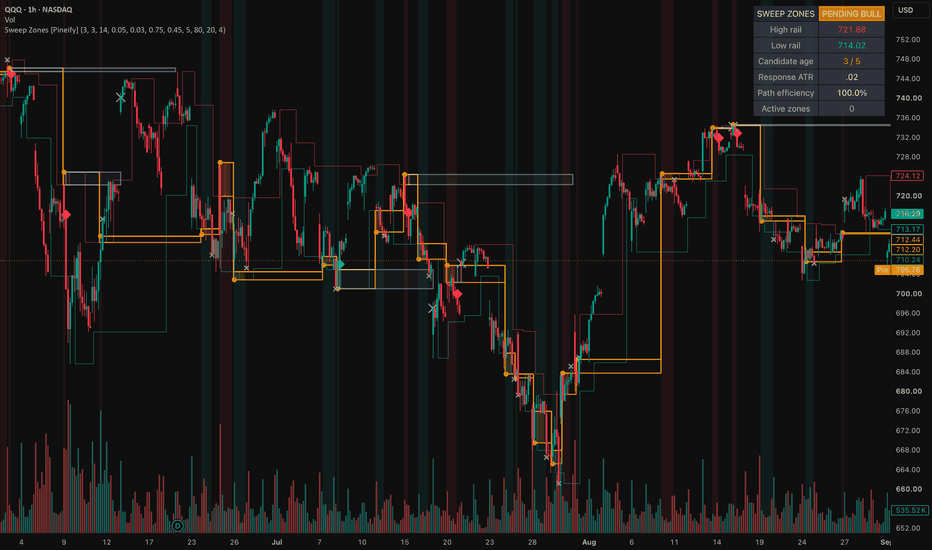
Liquidity Absorption Engine [StrixEDGE]TRADINGVIEW TITLE
Liquidity Absorption Engine Liquidity
DESCRIPTION
StrixEDGE Liquidity Absorption Engine is Engine #01 in the StrixEDGE indicator framework. It is a liquidity-focused market-state tool designed to identify changes in directional quality, liquidity behavior, volatility structure and confirmation strength without relying on a single conventional oscillator.
WHAT THIS INDICATOR IS DESIGNED TO DO
Scores wick absorption, sweep rejection and directional flow to identify defended liquidity zones.
Rather than treating one input as a complete signal, StrixEDGE combines the engine's dedicated core logic with an optional DNA layer. The final result is normalized into a 0–100 Strix Score so the same framework can be read consistently across different symbols and timeframes.
HOW TO READ THE STRIX SCORE
• Above 72: bullish state / long-side trigger zone.
• Below 28: bearish state / short-side trigger zone.
• Around 50: balanced or neutral state.
• A signal is generated on a transition into a trigger zone, not on every bar that remains inside it.
SIGNAL & POSITION FRAMEWORK
When a valid state transition is detected, the overlay version can create a structured trade plan containing:
• Entry
• DCA level
• TP1
• TP2
• TP3
• Stop Loss
Each projected level includes its percentage distance from Entry. When a level is reached, the same chart label is updated with a ✓ marker. TP and SL outcome tracking is mutually controlled so the dashboard does not report contradictory terminal results for the same setup.
PROFESSIONAL DASHBOARD
The built-in StrixEDGE dashboard summarizes the active market state in a compact TradingView table, including:
• Engine and category
• Strix Score and directional bias
• Signal / market regime
• Flow pressure and trend quality
• Relative volume and ATR volatility
• Structure / VWAP context
• Active position and signal age
• Entry, DCA, TP1, TP2, TP3 and SL
• Hit status for each projected level
COMBINATION PROFILE
• CORE BALANCE
• Active DNA modules: 3
• Lookback: 24
• Smoothing: 5
• Signal threshold: 72
ENGINE DNA
• Wick Absorption Pressure — Compares upper/lower wick asymmetry and amplifies it when relative volume is elevated.
• Liquidity Sweep Rejection — Detects previous-range stop sweeps that close back inside the broken boundary.
• Normalized Flow Acceleration — Smooths ATR-normalized return × relative volume to estimate directional flow.
MARKET / STYLE PROFILE
• Market focus: Crypto
• Intended style: Swing
• Core engine: #01 Liquidity Absorption Engine
• Category: Liquidity
NON-REPAINT / DATA HANDLING
By default, signals require a confirmed chart-bar close. This reduces intrabar signal fluctuation and makes historical signal placement more stable.
ALERTS
The generated script includes alert conditions for:
• Long state shift
• Short state shift
• DCA reached
• TP1 reached
• TP2 reached
• TP3 reached
• Stop Loss reached
HOW I USE IT
StrixEDGE is designed as a market-state and trade-structure tool rather than a standalone prediction system. Stronger setups generally occur when the Strix Score, market regime, flow pressure, structure and volatility context agree instead of relying on the trigger alone.
LIMITATIONS
No indicator can predict future price movement with certainty. Signals can fail during sudden news events, illiquid conditions, gaps, abnormal volatility, regime transitions or unreliable volume. DCA, TP and SL levels are systematic projections derived from the active setup and should not be interpreted as guaranteed outcomes.
Users should validate the indicator on the symbol, exchange and timeframe they trade, and should apply independent position sizing and risk management. Historical behavior does not guarantee future performance.
ORIGINALITY
StrixEDGE Engine #01 is built from generic price, volume, volatility, structure and confirmed-context primitives arranged in a dedicated engine formula and optional DNA layer. It is not intended to reproduce or rename a specific community indicator.
DISCLAIMER
For research and educational purposes only. This indicator is not financial advice and does not guarantee profitability. 지표

MarketCraft FX - Liquidity Matrix V1.1MARKETCRAFT FX – LIQUIDITY MATRIX V1.1
The MarketCraft FX Liquidity Matrix is a free liquidity-mapping indicator designed to identify areas where buy-side and sell-side liquidity may be resting.
Rather than displaying every minor swing, the indicator evaluates confirmed pivot structure, relative volume and displacement away from the level. Qualified liquidity zones are then displayed clearly on the chart, helping traders identify potential targets, reaction areas and liquidity events.
KEY FEATURES
• Buy-Side Liquidity (BSL) zones above confirmed swing highs
• Sell-Side Liquidity (SSL) zones below confirmed swing lows
• Dual structural and relative-volume detection
• PRIMARY, STRONG and MAJOR zone classifications
• ATR-based zone depth
• Optional dynamic zone sizing
• Nearby-level merging to reduce chart clutter
• Zones extend automatically beyond current price action
• Separate liquidity-sweep and close-through identification
• Nearest BSL and SSL displayed in a compact dashboard
• Configurable colours, transparency and display limits
• Alerts for approaches, sweeps and candle close-through events
• Suitable for light and dark chart backgrounds
HOW THE LIQUIDITY ENGINE WORKS
A liquidity zone begins with a confirmed swing high or swing low.
The indicator then evaluates the quality of that swing using two independent qualification paths:
1. Structural displacement away from the swing
2. Relative volume surrounding the liquidity origin
This dual-detection method allows a meaningful structural level to qualify even when market volume is relatively quiet. It can also identify volume-backed liquidity that may not produce an unusually large immediate displacement.
ZONE CLASSIFICATIONS
PRIMARY
A confirmed liquidity-bearing swing that meets the minimum qualification requirements.
STRONG
A higher-quality level supported by additional displacement, relative volume or price-action confirmation.
MAJOR
A high-scoring liquidity level with multiple supporting factors. These zones represent the strongest levels identified by the engine.
READING THE ZONES
BSL zones appear above price and represent areas where liquidity may be resting beyond previous highs.
SSL zones appear below price and represent areas where liquidity may be resting beyond previous lows.
Each active zone extends beyond current price action by the selected number of bars. The default extension is 20 bars.
The zone remains live and continues moving forward until its outer boundary is reached.
ZONE STATES
FRESH
The liquidity zone has been created and has not yet been approached or swept.
APPROACHING
Price has moved within the selected ATR distance of an active liquidity zone.
LIQUIDITY SWEPT
Price has wicked through the outer boundary of the zone. The zone stops extending at the sweep candle and changes to a dashed historical level.
CLOSE-THROUGH
A candle has closed beyond the outer boundary. This is separated from a wick-only sweep because it may indicate acceptance beyond the liquidity zone rather than an immediate rejection.
COMPACT DASHBOARD
The dashboard displays:
• Current draw on liquidity
• Nearest active BSL
• Nearest active SSL
• Strength of each nearest zone
• Number of retained zones
• Latest liquidity event
IMPORTANT SETTINGS
Minimum Zone Grade controls the overall quality of zones displayed.
Dual Structural + Volume Detection allows zones to qualify through either displacement or relative volume.
Swing Length and Confirmation Bars control how significant a swing must be before it is confirmed.
Base Zone Depth controls zone thickness using ATR.
Merge Nearby Levels combines levels forming within the selected ATR distance.
Extend Past Current Price controls how far active zones project beyond the latest candle.
Retain Swept Zones determines whether completed liquidity events remain visible for historical analysis.
TRADING APPLICATION
The indicator can be used to help identify:
• Potential draws on liquidity
• Areas above highs or below lows where stops may be resting
• Potential reaction points
• Liquidity sweeps
• Failed sweeps and close-through events
• Confluence with market structure, order blocks, supply and demand, Fibonacci levels or higher-timeframe analysis
Liquidity zones should not be treated as automatic entry signals. A zone identifies an area of interest; traders should use their own confirmation process before making a trading decision.
MARKETCRAFT FX
Craft Your Edge. Master the Market.
This indicator is an original MarketCraft FX development created as a free educational and chart-analysis tool.
DISCLAIMER
This indicator is provided for educational and informational purposes only. It does not constitute financial advice, investment advice or a recommendation to buy or sell any financial instrument.
No indicator can predict future market movements or guarantee profitable results. Liquidity zones may fail, price may trade through them, and historical performance does not guarantee future performance.
Always conduct your own analysis and use appropriate risk management.
지표

Market Structure BOS/CHoCH + Break Follow-Through [ForexCracked]🔵 OVERVIEW
Most market structure indicators stop at the break. This one keeps counting after it.
It draws the structure the way you already read it: confirmed swing highs and lows tagged HH, HL, LH and LL, a solid line at the level that would flip the current structure, and a BOS or CHoCH label the moment a bar closes through a swing. Then it does the part most structure tools stop short of. For every break it watches what price did next, files the outcome, and prints the counted result on the chart with the sample size next to it.
So the label on a break does not just say BOS. It says BOS, and that on this chart breaks like this one reached 1 ATR beyond the level before snapping back 116 times out of the last 200.
🔵 THE ANSWER IS THERE BEFORE THE BREAK
The two live levels, the last confirmed swing high and swing low that price has not yet closed through, are drawn as blocks at the right edge of the chart, teal above price and pink below. Each block is captioned with the break it would be under the current structure (BOS or CHoCH), the price, the distance, and what breaks of that kind did here: "BOS above 1.08420 · 12p · 1.0 ATR reached 116/200 (58%) · typical run to 1.08790".
The block's height is not decoration. It is the measured median run after breaks of that class on this symbol, so the top of the teal block is a price that breaks like this one typically reached. Medians print from eight samples and percentages from the minimum n. Below that the block falls back to the follow-through distance and its caption reads "finish line at" instead of "typical run to". A block never draws thinner than the minimum block height, and when that floor is what sets its height the caption reads "run floor at".
🔵 HOW A BREAK IS MEASURED
A break is a bar that closes through a live swing level. It is a BOS if it goes with the current structure and a CHoCH if it goes against it and flips it.
From the next bar the script runs a race with two finish lines the same distance from the level: 1 ATR beyond it in the break direction, and 1 ATR back through it on the other side. ATR is frozen at the break bar so later volatility cannot move the finish lines. Whichever is touched first decides the outcome: reached, or snapped back. If one bar touches both lines it is filed as snapped back, the conservative reading. If neither is touched within 30 bars the outcome is filed as neither. Nothing is estimated and nothing is fitted. Every figure is a count of price events on the chart in front of you, over the last 200 filed breaks of that class, and the n printed beside it is the real count.
Wick-only breaks, where a bar trades through a level but closes back inside, are measured with the same race in their own class. They are never drawn as events (the level's block border turns dashed once it has been wicked), but their number sits on the level's caption, so "should I wait for the close" gets an answer from your own symbol instead of a rule of thumb.
🔵 THE RUN BOX
After each close break a box is drawn from the level in the direction of the break. Its height is the median run for that class, its width the median bars it took to reach the finish line, and its caption prints the far edge as a price. The box then records what this particular break did: the border thickens when the finish line is reached, the box hollows and its border goes dashed when the break snaps back, and it fades if neither happens. The last few breaks stay on the chart as filled or hollow shapes, so the recent record is visible without reading a single number.
The break label itself is frozen at the moment of the break. It shows what the tool said at the time, never a hindsight figure. Only the outcome is added to it afterwards.
🔵 THE SWINGS
Swings are confirmed by price, not by counting bars. A swing high is confirmed the first time a bar closes a set number of ATR below it, and a close through the previous swing confirms the swing in between. There is no lookback length to tune and the same setting reads the same on gold, indices, crypto and forex. Tags land on the swing bar when the swing confirms, so they appear a few bars after the extreme printed. That is confirmation lag, not repainting. No tag, break line or break label is ever moved; only the outcome text is added to a label later. The two right-edge blocks and the panel are redrawn every bar by design, so their height follows the current ATR.
🔵 WHAT IS ON THE CHART
• HH, HL, LH and LL tags on confirmed swings (the first swing of each side is tagged H or L)
• A dashed border on a block means that level has already been wicked without a close through it
• A solid structure line at the level that would flip the current structure, teal under price while bullish and pink above it while bearish, with the dealing range shaded between it and the other live level
• A block at each live level, projected into the space right of price, captioned with the break type, the price, the distance and the counted result for breaks like it
• A line from each broken swing to the bar that closed through it, with a BOS or CHoCH label carrying the count as it stood at that moment
• A run box after each break, filled or hollow depending on what the break did
• A compact panel restating the structure, the two levels, the class counts and the last break
🔵 WHAT THIS IS NOT
This script draws no entries, no stops, no targets and no arrows. It has no order blocks, no fair value gaps, no sessions and no higher timeframe calls. It does not tell you to trade a break. It does not map liquidity pools, equal highs and lows or session extremes, does not count how often price reaches them, and does not mark sweeps or reversals. It is the structure map with the follow-through counted, so you can see on your own symbol whether the breaks you are reading have tended to carry on or to come straight back.
🔵 HOW TO USE
• Read the two blocks first. The block above is the level a close must clear and what happened after closes like that; the block below is the level a close must lose. The prices are printed.
• Treat the follow-through percentage as a base rate for this class on this chart, not as a forecast for this break. One hundred and sixteen out of 200 is a description of the past.
• Use the class split. If close breaks on your chart reach 1 ATR far more often than wick-only breaks, waiting for the close is worth its cost here. If the two numbers are close, it is not.
• Watch the run box after a break rather than the label. A box that hollows out is a break that snapped back, and the structure line will tell you where the next flip sits.
• Lower the swing setting to 1.0 ATR to see internal structure, raise it to 2.0 or more on choppy symbols so only real pullbacks count as swings.
🔵 SETTINGS
• Swing confirmation (x ATR): the close distance from the running extreme that confirms a swing (default 1.5)
• Follow-through distance (x ATR): the two finish lines, the same distance either way from the level (default 1.0)
• Outcome window (bars): how long the race runs before the outcome is filed as neither (default 30)
• Breaks kept per class: the rolling window every count is taken over (default 200), and the minimum n before a percentage prints (default 20)
• Chart: break lines to keep, run boxes to keep, minimum block height, how far the blocks project right, the dashboard and its position, colours
• Works on any symbol and any timeframe. Charts with little history print n below the minimum until the numbers fill in
🔵 ALERTS
• Bullish BOS, bearish BOS, bullish CHoCH, bearish CHoCH, each on the closing bar
• Wick-only break: price traded through a structure level and closed back inside
• Break reached its follow-through distance
• Break snapped back
• Price within a quarter of an ATR of a live structure level
The engine is close-based, so set alerts to fire once per bar close.
⚠️ DISCLAIMER
BOS and CHoCH are community terms for market structure. This is independent work and is not affiliated with or endorsed by any educator or course.
The percentages are counted descriptions of what happened after past breaks on this chart, not predictions. A class that reached its follow-through distance 70 times in 100 can snap back today. Samples vary by symbol and timeframe, and small samples are unreliable by nature, which is why every figure carries its n and prints nothing below the minimum. Nothing here is a trade signal. Results depend on market conditions, settings, and your own execution and risk management. Shared for educational and research purposes. Not financial advice. 지표

Virgin CPR Zones (Open Source) D / W / M / YVirgin CPR Zones — D / W / M / Y
OVERVIEW
This indicator plots the Central Pivot Range (CPR) for four timeframes — Daily, Weekly,
Monthly and Yearly — and automatically marks the "virgin" ones as extending zones on the
chart.
A CPR is called virgin when price never traded inside it during the period it belonged to.
Because that range was never tested while it was active, many traders treat it as an
untouched area of interest that price may react to when it eventually returns.
WHAT IT DRAWS
1. CPR lines for each enabled timeframe:
- TC (Top Central) = 2 × Pivot − BC
- Pivot = (High + Low + Close) / 3
- BC (Bottom Central) = (High + Low) / 2
The CPR is latched at the first bar of each new period using the previous period's
completed HLC, so the levels never repaint or shift mid-period.
2. Virgin CPR zones: when a period closes without price having traded into its own CPR,
a box is drawn between TC and BC and extended forward bar by bar. The zone stops
extending the moment price trades into it, leaving a permanent record of where and
when it was consumed.
HOW IT WORKS
Each timeframe runs through its own self-contained state machine, so the Daily, Weekly,
Monthly and Yearly logic never share arrays, latches or touch flags with one another.
Higher-timeframe data is requested with lookahead disabled and gaps off, so nothing is
known before it would have been known in real time.
The touch test is reset at the start of each new period before the current bar is
evaluated, which means the very first candle of a period can register as a touch. A CPR
is only promoted to a virgin zone after its own period has closed untouched, so zones
appear at the period boundary rather than intrabar.
Each timeframe only draws if the chart timeframe is equal to or lower than the CPR
timeframe. For example, Weekly zones will not appear on a Monthly chart.
INPUTS
- General: toggle the D / W / M / Y text tags on each zone.
- Per timeframe (Daily, Weekly, Monthly, Yearly):
- Show CPR lines on/off
- Show virgin CPR zones on/off
- Maximum number of zones to keep (oldest is deleted first)
- Colour
Defaults: Daily and Weekly lines are on, Monthly and Yearly lines are off to keep the
chart clean, while zones are enabled for all four.
HOW TO USE IT
Untested zones from a higher timeframe tend to carry more weight than lower ones, so a
virgin Monthly or Yearly CPR is generally treated as more significant than a virgin
Daily. Common uses are watching for a reaction on the first tag of a zone, or using the
zone edges (TC and BC) as reference levels for entries, targets and invalidation.
This is a levels and context tool. It does not generate buy or sell signals and should be
combined with your own structure, trend and risk management rules.
NOTES
- Zones are capped per timeframe to stay within drawing object limits. Increase the
"Max zones" input if you want more history, reduce it if the chart feels crowded.
- Because CPR is built from the previous period's completed data, the levels for the
current period are fixed from its first bar onward.
Author: Vishwajeeth J K 지표

Consolidation Ranges [ITA]🟠 OVERVIEW
Consolidation Ranges finds the places where price stopped trending and went sideways, draws the range while it forms, marks the bar that closes outside it, and then keeps watching to see whether that breakout actually held.
Finding a sideways range is the easy half. Every tool in this category draws the box and marks the breakout, and then stops, which is where the trader's real problem starts. The most common complaint about trading ranges is that the breakout fails and price comes straight back in, and almost nothing measures how often that happens.
So this one waits. After a breakout it gives price a set number of bars to stay outside. Close back inside within that window and the breakout is marked Failed. Stay out and it is marked Held. The running count of both sits in the corner.
🟠 CONCEPTS
* Consolidation - A stretch of bars whose full high to low span stays inside a chosen multiple of ATR. Measuring the range in ATR rather than in points means the same setting behaves the same way on a quiet symbol and a volatile one.
* Range Widening - While price stays inside, the box grows to contain each new bar, but only while the result is still narrow enough to count as a range. Without that limit a slow drift never breaks out, it just drags the box along with it.
* Breakout - The first close outside the box. The close matters rather than the wick, because a wick outside a range is the thing that most often reverses.
* Confirmation Window - The number of bars a breakout is given to prove itself.
* Held and Failed - What actually happened. Held means price stayed outside for the whole window. Failed means it closed back inside the range it had just left.
🟠 FEATURES
🔹 Range width measured in ATR, so one setting works across symbols and timeframes rather than needing to be retuned for each
🔹 The box builds live as the range develops and locks on the bar that breaks it
🔹 Breakouts marked in both directions at the price where the close happened
🔹 Every breakout followed to an outcome and labelled Held or Failed
🔹 A running count of held against failed breakouts, with the rate, for the symbol and timeframe on screen
🔹 Separate alerts for a break up, a break down, a failed breakout and a held breakout
🔹 If the settings are strict enough that nothing is found, the chart says so and names the two inputs to change, rather than leaving you looking at an empty chart unable to tell a quiet symbol from a bad setting
🟠 HOW TO USE
Set Range Length first. It decides how significant a consolidation has to be before it is drawn at all. Twenty bars is a reasonable starting point on any timeframe. Raise it for fewer and larger ranges.
Max Width is the second control. If nothing is being found on a volatile symbol, raise it. If the whole chart is boxes, lower it.
Then read the count in the corner before anything else. It is telling you whether breakouts on this symbol and timeframe have been worth taking. A symbol where most breakouts failed is not a symbol to trade breakouts on, and that is worth knowing before the next one rather than after it.
Bars To Confirm decides how patient the measurement is. A short window counts quick reversals as failures. A longer one only counts a breakout as failed if price genuinely came back.
🟠 CONCLUSION
Drawing the range is the part every tool does. The part that decides whether the range was worth trading is what happened after the break, and that is what this one records. 지표


