
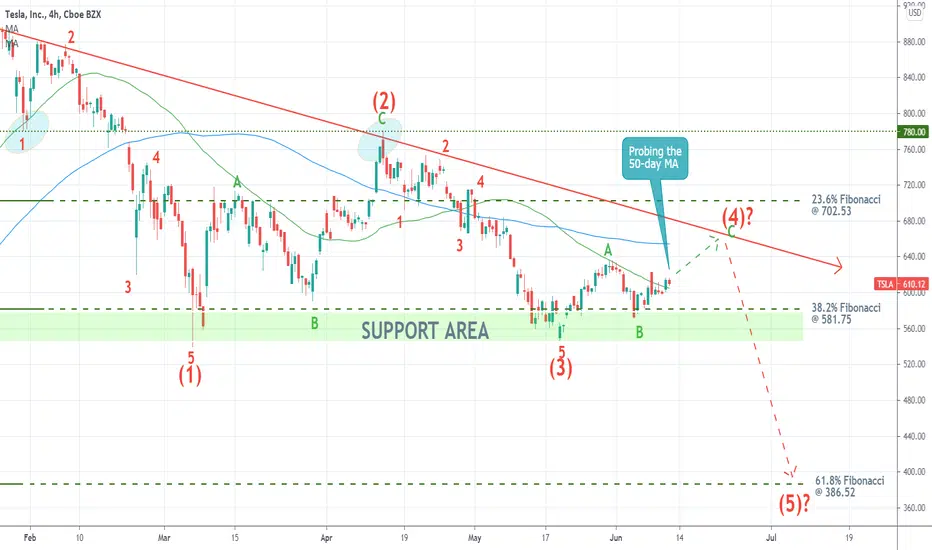
Tesla's shares are currently consolidating above the 38.2 per cent Fibonacci retracement level at 581.75.
Given the expectations of the Elliott Wave Theory, the price action could establish another upswing towards the descending trend line (in red). This would represent the second retracement leg (3-4) of the broader pattern.
A potential reversal from the trend line could entail a likely dropdown towards the 61.8 per cent Fibonacci retracement at 386.52. This would manifest the final impulse leg (4-5).
Given the expectations of the Elliott Wave Theory, the price action could establish another upswing towards the descending trend line (in red). This would represent the second retracement leg (3-4) of the broader pattern.
A potential reversal from the trend line could entail a likely dropdown towards the 61.8 per cent Fibonacci retracement at 386.52. This would manifest the final impulse leg (4-5).

Penerbitan berkaitan
Penafian
Maklumat dan penerbitan adalah tidak bertujuan, dan tidak membentuk, nasihat atau cadangan kewangan, pelaburan, dagangan atau jenis lain yang diberikan atau disahkan oleh TradingView. Baca lebih dalam Terma Penggunaan.
Penerbitan berkaitan
Penafian
Maklumat dan penerbitan adalah tidak bertujuan, dan tidak membentuk, nasihat atau cadangan kewangan, pelaburan, dagangan atau jenis lain yang diberikan atau disahkan oleh TradingView. Baca lebih dalam Terma Penggunaan.